SlideShare a Scribd company logo
1 of 10
Download to read offline
Field Measurements of Nonlinear Distortion in Digital Cable Plants
Tom Williams and Belal Hamzeh, CableLabs
Ron Hranac, Cisco Systems
Abstract
As cable networks transition from the
carriage of analog TV signals to digital
signals, the second- and third-order nonlinear
distortion products, known as composite
second order (CSO) and composite triple beat
(CTB), are still present but now appear on
conventional spectrum analyzers to be similar
to random noise. Thus, to technicians the
distortion energy is indistinguishable from
random noise. A new digital signal processing
(DSP) technique has been developed to
process the spectral “noise” in a vacant band
to determine if the energy is random, or
correlated to a full-band nonlinear distortion
signal that could have created it. This paper
discusses the processing details of the new
test method and presents lab, cascade, and
field test results. These data demonstrate the
operational benefits of making nonlinear
distortion measurements in mostly- or all-
digital cable plants.
DISTORTIONS IN CABLE NETWORKS
Active devices through which a cable
network’s signals pass compensate for various
losses in the transmission path, and extend the
physical reach of the network. Unfortunately,
those same active devices also degrade the
quality of the signals to some extent, with the
amount of degradation largely related to the
active circuit type (e.g., single-ended, push-
pull), the active device’s noise figure, number
of signals carried in the network, the number
and types of cascaded active devices through
which the signals pass, the active devices’
dynamic range, and the active devices’
operating RF levels. The degradation is
characterized in terms of parameters such as
carrier-to-noise ratio (CNR) and carrier-to-
nonlinear distortion ratio. This paper focuses
on nonlinear distortions, in particular the
measurement of nonlinear distortions in
mostly- or all-digital networks.
Nonlinear distortions
The amplifiers used in cable networks are
not perfectly linear devices, that is, their
transfer function is not constant. If one were
to plot an amplifier’s instantaneous output
voltage versus its instantaneous input voltage
on a graph (see Figure 1), the resulting line
would not be straight.
This behavior can be modeled
mathematically using a Taylor Series
expansion given by the equation
( )
where x is a time-varying input signal, and f()
is a nonlinear operator such as an overdriven
amplifier (or a cascade of overdriven
amplifiers). The A term is linear gain, B is
second-order distortion, and C is third order
distortion. Higher terms, such as D, E, and F,
also may be significant.
E out
E in
Figure 1. Example plot of amplifier output versus
input voltage.
In typical operating conditions, the
amplifier operates in the linear region (solid
line in Figure ). In non-ideal operating
conditions, such as amplifier failure or
overdriving the amplifier into its saturation
region, the amplifier starts operating in the
nonlinear region (dashed line in Figure 1).
Nonlinear behavior in an amplifier is
related in part to small-signal nonlinearities in
the amplifier’s semiconductor devices, but
mostly to signal compression that occurs as
the amplifier is operated near its saturation
point.
Nonlinear distortions get their name from
the nonlinear operation of the amplifier or
other active device that creates the distortions.
One notable differentiator between linear
distortion, such as group delay, and nonlinear
distortion is that linear distortion cannot
create distortion energy at new frequencies,
but nonlinear distortion can. Likewise, as an
amplifier’s operating signal levels are
increased, the relative output ratios of desired
carrier levels to distortion levels will be
maintained for linear distortion, but will not
be maintained for nonlinear distortions.
A graphical illustration of second order
nonlinear distortion caused by two signals, F1
(75 MHz) and F2 (100 MHz), is shown in
Figure 2. Note the discrete distortions or beats
at the absolute value of the difference F1 - F2
(25 MHz), the second harmonic 2F1 (150
MHz), the sum of the two frequencies F1 + F2
(175 MHz), and the second harmonic 2F2
(200 MHz).
Second and third order distortions
A quick operational test to determine the
order of nonlinear distortion in the spectrum is
to elevate the amplifier’s input signal. If the
distortion energy increases 3 dB for a 1 dB
step increase of the input signal, the nonlinear
distortion is probably third order. If the
undesired energy increases 2 dB for a 1 dB
step increase of the input signal, the nonlinear
distortion is probably second order.
Second order distortion in cable networks
should be substantially suppressed relative to
third order distortion because cable networks
use balanced push-pull amplifiers. Push-pull
amplifiers cancel even order (second, fourth,
sixth, etc.) distortions. Expected potential
sources of abnormal second order distortions
are imperfect analog downstream linear
lasers; damaged or unbalanced push-pull
amplifiers; and distortion caused by diode-like
junctions created by corrosion in the plant.
Third order distortion is the dominant
nonlinear distortion in cable networks. High-
output amplifiers are used to provide needed
dynamic range. Cable systems are operated
with up-tilt (higher frequencies operated at
higher RF output levels than lower
frequencies) to provide more uniform
distortion over the downstream band. The
potential sources mentioned previously for
second order distortion also can contribute to
third order distortion.
History
In the days of 12-channel operation in
North American cable networks, the active
devices in the outside plant were single-
ended. The nonlinear distortion of concern to
most operators was for the most part cross-
modulation (XMOD), which, if severe
enough, produced a windshield wiper effect in
the pictures of analog TV signals. XMOD is a
third order distortion.
Since 12-channel cable systems used the
same frequencies and channel plan as over-
Figure 2. Simplified graphic illustrating discrete
second order distortion.
the-air VHF broadcast television (54 MHz to
88 MHz for channels 2-6, and 174 MHz to
216 MHz for channels 7-13), the discrete
second- and some of the third-order nonlinear
distortions produced by amplifiers fell in parts
of the spectrum where TV signals were not
carried.
The introduction of push-pull amplifier
technology accommodated more usable
channels beyond the 12 VHF broadcast
equivalents. The new push-pull actives
provided a significant improvement in second
order nonlinear distortion performance, so the
VHF midband and superband frequency
ranges could now be used. That meant an
increase in cable network channel capacity.
As the downstream spectrum’s upper
frequency limit continued to increase with
improvements in active and passive device
technology over time, so did the number of
channels provided by cable operators. Along
with increased channel counts were an
increase in the numbers of discrete nonlinear
distortion products or beats, eventually to the
point where it became difficult or impossible
to discern individual beats.
Composite distortions
Because of the almost “comb-like” regular
frequency spacing of analog TV signals in a
cable network using the CEA-542-D channel
plan, the resulting distortions cluster at
various and predictable frequencies in the
spectrum. The individual distortions can be so
numerous within each cluster that the
descriptor composite distortion arguably is
more appropriate than discrete distortion.
CTB distortions of concern cluster in a narrow
bandwidth under each visual carrier, and CSO
distortion clusters appear ±0.75 and ±1.25
MHz relative to the visual carriers.
Nonlinear distortions such as CTB, CSO,
and common path distortion (CPD) don’t go
away in an all-digital network. Rather than
clusters of discrete distortions that occur in a
network carrying large numbers of analog TV
signals, the nonlinear distortions in a mostly-
or all-digital network are noise-like. Those
noise-like nonlinear distortion products are
known as composite intermodulation noise
(CIN), composite intermodulation distortion
(CID) or intermodulation noise (IMN) –
which should not be confused with thermal
noise. (Note: The term composite
intermodulation noise and its abbreviation are
used in this paper.)
Confusion does occur, though. It is
widely-known that raising RF levels in the
plant improves the CNR, where “N” is
thermal noise. But in a system with a lot of
digital signals, raising signal levels improves
CNR to a point, then the noise floor starts to
increase and the CNR appears to get worse.
That seems counterintuitive, but the now-
elevated noise floor no longer is just thermal
noise. It is a combination of thermal noise and
the previously mentioned noise-like nonlinear
distortions. When characterizing plant
performance in the presence of CIN, the term
“carrier-to-composite noise (CCN) ratio”
commonly is used.
Indeed, CCN is a much more appropriate
measurement metric than is CNR under these
circumstances, because there is no practical
way to differentiate thermal noise from CIN
on a spectrum analyzer display. One could
turn off all downstream signals except for
automatic gain control/automatic level control
(AGC/ALC) pilot(s); the noise-like nonlinear
distortions would go away, leaving just
thermal noise. Unfortunately, this method is
service disruptive, and as such is not a
practical way to characterize noise versus
noise-like nonlinear distortions.
How, then, can nonlinear distortions in a
mostly- or all-digital network be measured in
an operating network?
Characterizing noise-like nonlinear distortion
Noise-like nonlinear distortion energy is
not random, and can be quantified with
knowledge of the input signal that created it.
It is particularly easy to quantify in vacant test
bands, such as a roll-off region. If a vacant
band is not available, one can be created by
demodulating the RF signal occupying the
band, and then subtracting it mathematically.
There are a few possible ways that
detection of signal distortion can be done.
One method is to capture the same signal
twice: One copy of which is a clean
undistorted signal at the headend or hub site,
and the other copy is captured at a test point
in the field. This method has the added
complexity of requiring synchronized capture
and the transfer of data to a central processing
point, in addition to removing linear distortion
differences between the nonlinearly distorted
signal and the pristine headend signal.
Another method involves capturing the
signal at the input and the output test points of
an amplifier, and then determining how much
additional distortion was added by the
amplifier. The linear distortion of the
amplifier, including diplex filters response,
tilt, and equalization makes this method non-
trivial.
The next section of this paper describes a
test methodology that requires only a signal
capture at one location, where the single full
band signal is captured in the field. The
captured vacant band signal is stored as a
“measured” signal, and processed with a
“manufactured” signal. The level of match
between the measured and manufactured
signals determines how much nonlinear
distortion was present in the captured signal’s
vacant band.
ONE-SIGNAL NONLINEAR DISTORTION
TEST METHOD
The following steps can be used to
facilitate a one-signal nonlinear distortion
measurement, using just the signal captured in
the field.
1) Capture a full-band downstream signal (the
entire downstream RF spectrum with all
signals and vacant bands) using a digital
oscilloscope that has a sampling rate of at
least twice the bandwidth of the downstream
band, and 10-12 bits of analog-to-digital (A-
D) resolution for at least 32,768 samples. In
our example, the downstream bandwidth is
less than 1,250 MHz, thus the downstream
signal is digitized at a rate of at least 2.5*109
Hz. If necessary, a low-distortion, low-noise
preamplifier can be used to boost the full band
downstream signal prior to capture (digital
oscilloscopes generally have a poor noise
figure). A low pass filter should be used to
remove any energy above 1250MHz, to
prevent aliasing. Figure 3 illustrates a time
domain display of a signal captured by a
digital oscilloscope operating at 2.5 giga-
samples per second and 12 bits of A-D
resolution. The downstream signal processing
requires a vacant band, which may be a roll-
off band. This example 54 MHz to 860 MHz
signal comprised mostly digital signals, plus a
few continuous wave (CW) carriers used as
pilots and alignment aids. The captured signal
contains a vacant band between about 770
MHz and 860 MHz, which is not evident in
the time domain trace.
2) Convert the time domain signal of Figure 3
into the frequency domain with a fast Fourier
transform (FFT). The resulting frequency
domain plot is illustrated in Figure 4. In the
frequency domain, the vacant band energy
values between 770 MHz and 860 MHz are
Figure 3. Captured time domain signal comprising
32768 samples, and with a duration of 16.384 µs.
cut and stored. These frequency domain
samples are called the “measured” vacant
band distortion signal. Next, replace the
vacant band energy in the frequency domain
signal between 770 MHz and 860 MHz with
zeroes. This spectral plot is illustrated in
Figure 5.
3) Next, convert the 54 MHz to 860 MHz
signal of Figure 5 with the newly-vacated
band back into the time domain with an
inverse fast Fourier transform (IFFT), and
distort a resulting time sequence with a
second and third order nonlinear distortion.
The latter is accomplished by squaring
and cubing each term in the time sequence.
This creates a second order “manufactured”
signal and a third order “manufactured”
signal. This distortion manufacturing method
gives a good approximate estimate because
the nonlinear distortion components are small
in operating cable networks. That is:
( )
4) Convert the “manufactured” signals back
into the frequency domain and store only the
distortion components in the vacant band (770
MHz to 860 MHz in our example).
5) Process the vacant band “measured” signal
with the vacant band “manufactured” signals.
One processing method that has worked well
is frequency domain division of the
“manufactured” samples, illustrated in Figure
8, by the complex conjugate of the same
frequency “measured” samples, illustrated in
Figure 9, to produce frequency domain
quotients.
6) Convert the 1024 frequency domain
quotients into the time domain. This is
illustrated in Figure 6 for second order
distortion and Figure 7 for third order
distortion. Energy in the first (DC) term
Figure 4. Full bandwidth downstream frequency
domain signal obtained by performing an FFT on
the time samples shown in Figure 3.
Figure 5. Full bandwidth downstream display with
vacant band zeroed out.
Figure 6. Time domain plot of quotient showing
average first term relative to other terms, indicating
low second order distortion.
Figure 7. Time domain plot of quotient showing
large first term relative to other terms,
indicating third order distortion.
indicates a match of the “measured” signal
with the “manufactured” signal.
7) If necessary, averaging may be used to
better discern the DC term relative to the
other terms. Note that the DC terms are
correlated vectors that will add, but the other
terms are uncorrelated.
8) Repeat the previous steps for other orders
of distortion that might be present.
The plots of Figure 6 and Figure 7 are
complex time series, and only 64 sample
points are illustrated. As the number of
averages increases, the noisy components
associated with using a noise-like downstream
test signal are reduced. Another improvement
to reduce noise in the plots is to use a larger
percentage of vacant bandwidth relative to the
occupied bandwidth. There is generally a
angle to the distortion, and in most observed
tests on distorted cable amplifiers, the first
term (t = 0) contains most of the energy. As
the amplifier’s input drive level increases,
both the level of nonlinear distortion and the
angle of the DC terms change.
OUTSIDE PLANT TESTING
Test Results Obtained from Testing Inside
Houses
Figure 10 is a composite plot from seven
different locations for second order distortion
test results, and Figure 1 contains third order
distortion results. Fifteen separate tests were
conducted to determine if the measurements
were repeatable, and 10 averages used for
each point. Locations 6 and 7 had downstream
high pass filters to block all but the data-only
traffic. Note the top trace on the second order
distortion Figure 10, which was location 3.
This particular location was later diagnosed
also have high linear distortion, as determined
by ripples in the upstream equalization
response.
The .750 trunk cable feeding this location
appeared to have been damaged when it was
installed many years ago. In the photograph of
Figure 12, one can make out the conduit
which may have been fractured by a boring
machine. The cable was severely kinked
several feet below ground and corroding as
one would expect. After repair both the
second and third order distortion improved
significantly.
Figure 10. Second order results for seven locations
(15 tests each location, 10 averages)
The highest third order distortion came
from a home with known ingress issues.
Figure 9. Sample points of measured distortion
from the vacant band.
Figure 8. Sample points of manufactured second
order distortion from the vacant band.
Figure 11. Third order results for seven locations
(15 tests each location, 10 averages)
Figure 12. The kinked corroding cable causing the
high second order distortion for location 3.
Test Results Obtained from Testing a Node
Plus 6 Amplifier Cascade
Tests were performed on a cascade of
node plus six push pull amplifiers. The
amplifiers were capable of 860 MHz but were
only loaded to 770 MHz, so testing was done
in the vacant band between 770 MHz and 860
MHz, as described previously. Loading was
with digital carriers.
Figure 13 shows the test results for second
and third order distortion. Note that the third
order nonlinear distortion increased through
the third amplifier as expected, but then began
to decrease. At amplifiers 6 and 7 the
nonlinear third order distortion took a
precipitous drop. Second order distortion was
not significant. Note, too, that the worst
second order distortion was observed at the
fiber node.
Figure 13. Distortion changes in a cascade of node
plus seven amplifiers
This observed third order behavior is not
understood at this time. One possible
explanation is distortion cancellation by
inadvertent addition out-of-phase distortion
(a.k.a. predistortion). This method is used
commercially in high power amplifiers to
extend their dynamic ranges, but the authors
are not aware of this being done in cable TV-
type distribution amplifiers. Testing additional
cascades will hopefully be done in the future
to determine whether what was seen here was
an anomaly.
0
0.05
0.1
0.15
0.2
0.25
0.3
0.35
0.4
0.45
0.5
1 2 3 4 5 6 7 8
Amplifier Number
Cascade Nonlinear Distortion
2nd Order
3rd Order
LAB TESTING
Lab-based testing was conducted to
validate the nonlinear distortion measurement
concept discussed in this paper. A single-
ended amplifier (Agilent 8447D) and a 54
MHz to 860 MHz cable push-pull hybrid
amplifier (ATX model QDAXU) were used in
the lab tests.
The input signal was a broadband random
noise source (NoiseCom UFX 7109) with its
RF output filtered using a 600 MHz low pass
filter (Mini-Circuits model BLP-600-75) to
create a vacant test band around 800 MHz.
The ratio of the energy in the DC term of the
correlation plot to all other correlation
coefficients was plotted versus input drive
level as the input drive level was increased in
2 dB steps. Figure 14 shows that the single-
ended amplifier first exhibited an increase in
2nd
order distortion, followed by an increase
in 3rd
order distortion at higher input drive
levels. Of interest was the second order
distortion decreasing with heavy saturation
levels.
Figure 15 shows the same plots for the
push-pull cable downstream amplifier. The
second order distortion remains low for all
drive levels, while the third order distortion
increases with higher drive levels.
Figure 14. Single-ended amplifier performance.
Figure 15. Push-pull amplifier performance.
RETURN PATH TESTING
The nonlinear distortion measurement
method described in this section was
demonstrated at the CableLabs 2014 Winter
Conference. This new method was developed
to analyze RF signals to determine the
presence of nonlinear distortion using digital
signal processing techniques. The method
involves multiple transmissions of a burst (or
a known variant of the burst), and performing
a full-band signal capture containing a vacant
band having noise and/or distortion for each
transmission. As described here, it is possible
to use this measurement method to evaluate a
cable network’s return spectrum, although it
also could be used for other applications, such
as wireless transmitters.
The energy in the vacant band from the
first burst transmission in Figure 18 is
processed with the energy in the vacant band
from the subsequent transmissions in Figure
18 to see the correlation between the two
energies. Figure 16 shows the mid-split 5
MHz to 85 MHz upstream burst test signals
with a vacant band 25 MHz to 35 MHz, where
the energies were processed and analyzed. In
situations where there is no nonlinear
distortion occurring in the network, the signal
in the vacant band is expected to be white
Gaussian noise, and thus the energy captures
in the vacant band from the multiple
transmissions are expected to be uncorrelated.
When nonlinear distortion does occur in the
network, the signal in the vacant band is
expected to contain distortion components
from the transmitted signal; the energy levels
of the distortion components in the vacant
bands are directly related to the amount of
distortion occurring in the network. In these
situations, the energy captures in the vacant
band from the multiple transmissions are
expected to have a certain level of correlation.
By correlating the energy captures in the
vacant band, detection of non-linear distortion
is possible. Figure 17 shows the result from
correlating (using frequency domain
processing) the vacant band energy captures
for two identical time-separated bursts sent
through a network suffering from nonlinear
distortion. The presence of a large DC term in
the correlation plot is indicative of the
presence of nonlinear distortion.
As mentioned previously, the transmitted
bursts are sent in sequence, and are either
identical, or the subsequent bursts could be a
variant of the original burst. One option
would be to transmit a second identical burst
and the third burst as an inverted version of
the original burst as is shown in Figure 18.
Transmission of the third inverted burst
enables the identification of odd-ordered
distortion in the network such as CTB.
To detect CTB (or odd-ordered
distortion), the correlation results of the
Figure 16. Full band capture for upstream signal
with a vacant band.
Figure 17. Correlation plot of vacant band energy
from two identical bursts.
Figure 18. Multiple burst transmission in time
domain: identical first and second bursts, identical
but inverted third burst.
vacant band energy of the first burst and the
second burst are compared to the correlation
results of the vacant band energy of the first
(or second) burst and the third burst. If the
correlation results from the inverted burst go
negative, it is indicative of odd-ordered
distortion.
These test methods can potentially be
incorporated into digital terminals and
CMTSs, so that testing can be performed
remotely without the need for a truck roll.
Patent pending.
SUMMARY
This paper discussed nonlinear distortions
in cable networks and methods to discriminate
nonlinear distortion from thermal noise in all-
digital networks. One method is appropriate
for downstream signals which are continuous
transmissions, and another method is for
upstream transmissions, which are generally
bursty. With these new test methods, cable
operators can potentially move to new levels
of plant fault detection.
REFERENCES
Broadband Cable Access Networks, by David
Large and James Farmer (© 2009, Morgan
Kaufmann Publishers, ISBN 978-0-12-
374401-2)
Code of Federal Regulations, Title 47, Part 76
Modern Cable Television Technology, 2nd
Edition, by Walter Ciciora, James Farmer,
David Large, and Michael Adams (© 2004,
Morgan Kaufmann Publishers, ISBN 1-
55860-828-1)
SCTE Measurement Recommended Practices
for Cable Systems, Fourth Edition, (© 2012,
Society of Cable Telecommunications
Engineers, TS46)
ACKNOWLEDGMENTS:
The authors wish to express their gratitude for
access and support to the cable operators that
supported research for this paper.

More Related Content

What's hot

How to solve ACLR issue
How to solve ACLR issueHow to solve ACLR issue
How to solve ACLR issuecriterion123
 
PA Output Notch Filter Consideration
PA Output Notch Filter ConsiderationPA Output Notch Filter Consideration
PA Output Notch Filter Considerationcriterion123
 
Introduction to modern receiver
Introduction to modern receiverIntroduction to modern receiver
Introduction to modern receivercriterion123
 
Performance Requirement and Lessons Learnt of LTE Terminal_Transmitter Part
Performance Requirement and Lessons Learnt of LTE Terminal_Transmitter PartPerformance Requirement and Lessons Learnt of LTE Terminal_Transmitter Part
Performance Requirement and Lessons Learnt of LTE Terminal_Transmitter Partcriterion123
 
Carrier Aggregation Discussion
Carrier Aggregation DiscussionCarrier Aggregation Discussion
Carrier Aggregation Discussioncriterion123
 
SAW-less Direct Conversion Receiver Consideration
SAW-less Direct Conversion Receiver ConsiderationSAW-less Direct Conversion Receiver Consideration
SAW-less Direct Conversion Receiver Considerationcriterion123
 
GNSS De-sense By IMT and PCS DA Output
GNSS De-sense By IMT and PCS DA OutputGNSS De-sense By IMT and PCS DA Output
GNSS De-sense By IMT and PCS DA Outputcriterion123
 
System(board level) noise figure analysis and optimization
System(board level) noise figure analysis and optimizationSystem(board level) noise figure analysis and optimization
System(board level) noise figure analysis and optimizationcriterion123
 
Challenges In Designing 5 GHz 802.11 ac WIFI Power Amplifiers
Challenges In Designing 5 GHz 802.11 ac WIFI Power AmplifiersChallenges In Designing 5 GHz 802.11 ac WIFI Power Amplifiers
Challenges In Designing 5 GHz 802.11 ac WIFI Power Amplifierscriterion123
 
CDMA Zero-IF Receiver Consideration
CDMA  Zero-IF Receiver ConsiderationCDMA  Zero-IF Receiver Consideration
CDMA Zero-IF Receiver Considerationcriterion123
 
Receiver Desense Common Issue
Receiver Desense Common IssueReceiver Desense Common Issue
Receiver Desense Common Issuecriterion123
 
RF Matching Guidelines for WIFI
RF Matching Guidelines for WIFIRF Matching Guidelines for WIFI
RF Matching Guidelines for WIFIcriterion123
 
Introduction to differential signal -For RF and EMC engineer
Introduction to differential signal -For RF and EMC engineerIntroduction to differential signal -For RF and EMC engineer
Introduction to differential signal -For RF and EMC engineercriterion123
 
Performance requirement and lessons learnt of LTE terminal---transmitter part
Performance requirement and lessons learnt of LTE terminal---transmitter partPerformance requirement and lessons learnt of LTE terminal---transmitter part
Performance requirement and lessons learnt of LTE terminal---transmitter partcriterion123
 
The ABCs of ADCs Understanding How ADC Errors Affect System Performance
The ABCs of ADCs Understanding How ADC Errors Affect System PerformanceThe ABCs of ADCs Understanding How ADC Errors Affect System Performance
The ABCs of ADCs Understanding How ADC Errors Affect System Performancecriterion123
 
One LTE B7 Desense Case Study
One LTE B7 Desense Case StudyOne LTE B7 Desense Case Study
One LTE B7 Desense Case Studycriterion123
 
Cwte_Wi-Fii6-presentation_dec_7_2021
Cwte_Wi-Fii6-presentation_dec_7_2021Cwte_Wi-Fii6-presentation_dec_7_2021
Cwte_Wi-Fii6-presentation_dec_7_2021Mayur Sarode
 

What's hot (19)

8-15
8-158-15
8-15
 
How to solve ACLR issue
How to solve ACLR issueHow to solve ACLR issue
How to solve ACLR issue
 
PA Output Notch Filter Consideration
PA Output Notch Filter ConsiderationPA Output Notch Filter Consideration
PA Output Notch Filter Consideration
 
Introduction to modern receiver
Introduction to modern receiverIntroduction to modern receiver
Introduction to modern receiver
 
Performance Requirement and Lessons Learnt of LTE Terminal_Transmitter Part
Performance Requirement and Lessons Learnt of LTE Terminal_Transmitter PartPerformance Requirement and Lessons Learnt of LTE Terminal_Transmitter Part
Performance Requirement and Lessons Learnt of LTE Terminal_Transmitter Part
 
Carrier Aggregation Discussion
Carrier Aggregation DiscussionCarrier Aggregation Discussion
Carrier Aggregation Discussion
 
SAW-less Direct Conversion Receiver Consideration
SAW-less Direct Conversion Receiver ConsiderationSAW-less Direct Conversion Receiver Consideration
SAW-less Direct Conversion Receiver Consideration
 
GNSS De-sense By IMT and PCS DA Output
GNSS De-sense By IMT and PCS DA OutputGNSS De-sense By IMT and PCS DA Output
GNSS De-sense By IMT and PCS DA Output
 
System(board level) noise figure analysis and optimization
System(board level) noise figure analysis and optimizationSystem(board level) noise figure analysis and optimization
System(board level) noise figure analysis and optimization
 
Challenges In Designing 5 GHz 802.11 ac WIFI Power Amplifiers
Challenges In Designing 5 GHz 802.11 ac WIFI Power AmplifiersChallenges In Designing 5 GHz 802.11 ac WIFI Power Amplifiers
Challenges In Designing 5 GHz 802.11 ac WIFI Power Amplifiers
 
CDMA Zero-IF Receiver Consideration
CDMA  Zero-IF Receiver ConsiderationCDMA  Zero-IF Receiver Consideration
CDMA Zero-IF Receiver Consideration
 
Receiver Desense Common Issue
Receiver Desense Common IssueReceiver Desense Common Issue
Receiver Desense Common Issue
 
RF Matching Guidelines for WIFI
RF Matching Guidelines for WIFIRF Matching Guidelines for WIFI
RF Matching Guidelines for WIFI
 
Introduction to differential signal -For RF and EMC engineer
Introduction to differential signal -For RF and EMC engineerIntroduction to differential signal -For RF and EMC engineer
Introduction to differential signal -For RF and EMC engineer
 
Performance requirement and lessons learnt of LTE terminal---transmitter part
Performance requirement and lessons learnt of LTE terminal---transmitter partPerformance requirement and lessons learnt of LTE terminal---transmitter part
Performance requirement and lessons learnt of LTE terminal---transmitter part
 
The ABCs of ADCs Understanding How ADC Errors Affect System Performance
The ABCs of ADCs Understanding How ADC Errors Affect System PerformanceThe ABCs of ADCs Understanding How ADC Errors Affect System Performance
The ABCs of ADCs Understanding How ADC Errors Affect System Performance
 
Nonlinearity
NonlinearityNonlinearity
Nonlinearity
 
One LTE B7 Desense Case Study
One LTE B7 Desense Case StudyOne LTE B7 Desense Case Study
One LTE B7 Desense Case Study
 
Cwte_Wi-Fii6-presentation_dec_7_2021
Cwte_Wi-Fii6-presentation_dec_7_2021Cwte_Wi-Fii6-presentation_dec_7_2021
Cwte_Wi-Fii6-presentation_dec_7_2021
 

Viewers also liked

Rf circuit non linearity characterization
Rf circuit non linearity characterizationRf circuit non linearity characterization
Rf circuit non linearity characterizationNizam Din
 
2015 10 07 - efficient optical transport layer for high-capacity optical netw...
2015 10 07 - efficient optical transport layer for high-capacity optical netw...2015 10 07 - efficient optical transport layer for high-capacity optical netw...
2015 10 07 - efficient optical transport layer for high-capacity optical netw...Xtera Communications
 
Leveraging External Applications For DOCSIS 3.1 HFC Plant Optimization
Leveraging External Applications For DOCSIS 3.1 HFC Plant OptimizationLeveraging External Applications For DOCSIS 3.1 HFC Plant Optimization
Leveraging External Applications For DOCSIS 3.1 HFC Plant OptimizationCisco Service Provider
 
ACG Research Paper: Business Case for Cisco Evolved Services Platform and NFV
ACG Research Paper: Business Case for Cisco Evolved Services Platform and NFVACG Research Paper: Business Case for Cisco Evolved Services Platform and NFV
ACG Research Paper: Business Case for Cisco Evolved Services Platform and NFVCisco Service Provider
 
An SDN Based Approach To Measuring And Optimizing ABR Video Quality Of Experi...
An SDN Based Approach To Measuring And Optimizing ABR Video Quality Of Experi...An SDN Based Approach To Measuring And Optimizing ABR Video Quality Of Experi...
An SDN Based Approach To Measuring And Optimizing ABR Video Quality Of Experi...Cisco Service Provider
 
Smart Power Amplifier
Smart Power AmplifierSmart Power Amplifier
Smart Power AmplifierMagdi Mohamed
 
NFV, SDN: the evolution beyond virtualization
NFV, SDN: the evolution beyond virtualizationNFV, SDN: the evolution beyond virtualization
NFV, SDN: the evolution beyond virtualizationCisco Service Provider
 
Remote PHY for Converged DOCSIS, Video and OOB
Remote PHY for Converged DOCSIS, Video and OOBRemote PHY for Converged DOCSIS, Video and OOB
Remote PHY for Converged DOCSIS, Video and OOBCisco Service Provider
 
RF Module Design - [Chapter 3] Linearity
RF Module Design - [Chapter 3]  LinearityRF Module Design - [Chapter 3]  Linearity
RF Module Design - [Chapter 3] LinearitySimen Li
 
Introduction to Optical Backbone Networks
Introduction to Optical Backbone NetworksIntroduction to Optical Backbone Networks
Introduction to Optical Backbone NetworksAnuradha Udunuwara
 

Viewers also liked (12)

Rf circuit non linearity characterization
Rf circuit non linearity characterizationRf circuit non linearity characterization
Rf circuit non linearity characterization
 
2015 10 07 - efficient optical transport layer for high-capacity optical netw...
2015 10 07 - efficient optical transport layer for high-capacity optical netw...2015 10 07 - efficient optical transport layer for high-capacity optical netw...
2015 10 07 - efficient optical transport layer for high-capacity optical netw...
 
Leveraging External Applications For DOCSIS 3.1 HFC Plant Optimization
Leveraging External Applications For DOCSIS 3.1 HFC Plant OptimizationLeveraging External Applications For DOCSIS 3.1 HFC Plant Optimization
Leveraging External Applications For DOCSIS 3.1 HFC Plant Optimization
 
ACG Research Paper: Business Case for Cisco Evolved Services Platform and NFV
ACG Research Paper: Business Case for Cisco Evolved Services Platform and NFVACG Research Paper: Business Case for Cisco Evolved Services Platform and NFV
ACG Research Paper: Business Case for Cisco Evolved Services Platform and NFV
 
Moving CCAP To The Cloud
Moving CCAP To The CloudMoving CCAP To The Cloud
Moving CCAP To The Cloud
 
An SDN Based Approach To Measuring And Optimizing ABR Video Quality Of Experi...
An SDN Based Approach To Measuring And Optimizing ABR Video Quality Of Experi...An SDN Based Approach To Measuring And Optimizing ABR Video Quality Of Experi...
An SDN Based Approach To Measuring And Optimizing ABR Video Quality Of Experi...
 
Smart Power Amplifier
Smart Power AmplifierSmart Power Amplifier
Smart Power Amplifier
 
NFV, SDN: the evolution beyond virtualization
NFV, SDN: the evolution beyond virtualizationNFV, SDN: the evolution beyond virtualization
NFV, SDN: the evolution beyond virtualization
 
Remote PHY for Converged DOCSIS, Video and OOB
Remote PHY for Converged DOCSIS, Video and OOBRemote PHY for Converged DOCSIS, Video and OOB
Remote PHY for Converged DOCSIS, Video and OOB
 
Long-Haul Transmission
Long-Haul Transmission Long-Haul Transmission
Long-Haul Transmission
 
RF Module Design - [Chapter 3] Linearity
RF Module Design - [Chapter 3]  LinearityRF Module Design - [Chapter 3]  Linearity
RF Module Design - [Chapter 3] Linearity
 
Introduction to Optical Backbone Networks
Introduction to Optical Backbone NetworksIntroduction to Optical Backbone Networks
Introduction to Optical Backbone Networks
 

Similar to Field Measurements of Nonlinear Distortion in Digital Cable Plants

low_noise_NIS_final_print
low_noise_NIS_final_printlow_noise_NIS_final_print
low_noise_NIS_final_printTom Derks
 
Link budjet radio and spread spectrum theory
Link budjet   radio and spread spectrum theoryLink budjet   radio and spread spectrum theory
Link budjet radio and spread spectrum theoryDiogo Edler Menezes
 
distortion analysis of cmos based analog circuits
distortion analysis of cmos based analog circuitsdistortion analysis of cmos based analog circuits
distortion analysis of cmos based analog circuitsINFOGAIN PUBLICATION
 
A Review on Wide Bandwidth Low Noise Amplifier for Modern Wireless Communication
A Review on Wide Bandwidth Low Noise Amplifier for Modern Wireless CommunicationA Review on Wide Bandwidth Low Noise Amplifier for Modern Wireless Communication
A Review on Wide Bandwidth Low Noise Amplifier for Modern Wireless CommunicationIRJET Journal
 
chapter-2_part-2.ppt
chapter-2_part-2.pptchapter-2_part-2.ppt
chapter-2_part-2.pptKaytusKaytus
 
Telecommunications basics
Telecommunications basicsTelecommunications basics
Telecommunications basicsAarón Candia
 
Frequency coordination-between-umts-and-gsm-systems-900-mhz
Frequency coordination-between-umts-and-gsm-systems-900-mhzFrequency coordination-between-umts-and-gsm-systems-900-mhz
Frequency coordination-between-umts-and-gsm-systems-900-mhzMahmoud Abd Elrahman
 
Frequency coordination between umts and gsm systems at 900 m hz
Frequency coordination between umts and gsm systems at 900 m hzFrequency coordination between umts and gsm systems at 900 m hz
Frequency coordination between umts and gsm systems at 900 m hzGeorgios Giannakopoulos
 
2.4GHz/5.8GHz WiFi Antenna Principle And Parameters
2.4GHz/5.8GHz WiFi Antenna Principle And Parameters2.4GHz/5.8GHz WiFi Antenna Principle And Parameters
2.4GHz/5.8GHz WiFi Antenna Principle And ParametersAntenna Manufacturer Coco
 
Double feedback technique for reduction of Noise LNA with gain enhancement
Double feedback technique for reduction of Noise LNA with gain enhancementDouble feedback technique for reduction of Noise LNA with gain enhancement
Double feedback technique for reduction of Noise LNA with gain enhancementijceronline
 
Volume 2-issue-6-1965-1968
Volume 2-issue-6-1965-1968Volume 2-issue-6-1965-1968
Volume 2-issue-6-1965-1968Editor IJARCET
 
Volume 2-issue-6-1965-1968
Volume 2-issue-6-1965-1968Volume 2-issue-6-1965-1968
Volume 2-issue-6-1965-1968Editor IJARCET
 
Integrated sub-harmonically pumped up-converter antenna for spatial power com...
Integrated sub-harmonically pumped up-converter antenna for spatial power com...Integrated sub-harmonically pumped up-converter antenna for spatial power com...
Integrated sub-harmonically pumped up-converter antenna for spatial power com...fanfan he
 
Poster_140320705506
Poster_140320705506Poster_140320705506
Poster_140320705506Patel Neel
 
DESIGN AND ANALYSIS OF 2 GHz 130nm CMOS CASCODE LOW NOISE AMPLIFIER WITH INTE...
DESIGN AND ANALYSIS OF 2 GHz 130nm CMOS CASCODE LOW NOISE AMPLIFIER WITH INTE...DESIGN AND ANALYSIS OF 2 GHz 130nm CMOS CASCODE LOW NOISE AMPLIFIER WITH INTE...
DESIGN AND ANALYSIS OF 2 GHz 130nm CMOS CASCODE LOW NOISE AMPLIFIER WITH INTE...csijjournal
 
Fundamental of Radio Frequency communications.ppt
Fundamental of Radio Frequency communications.pptFundamental of Radio Frequency communications.ppt
Fundamental of Radio Frequency communications.pptginanjaradi2
 
Radio frequency power point presentation
Radio frequency power point presentationRadio frequency power point presentation
Radio frequency power point presentationprabalkalita13
 
An introduction to spread spectrum communications
An introduction to spread spectrum communicationsAn introduction to spread spectrum communications
An introduction to spread spectrum communicationsFarzad Nuseeb
 

Similar to Field Measurements of Nonlinear Distortion in Digital Cable Plants (20)

Radio Conformance Test
Radio Conformance TestRadio Conformance Test
Radio Conformance Test
 
low_noise_NIS_final_print
low_noise_NIS_final_printlow_noise_NIS_final_print
low_noise_NIS_final_print
 
Link budjet radio and spread spectrum theory
Link budjet   radio and spread spectrum theoryLink budjet   radio and spread spectrum theory
Link budjet radio and spread spectrum theory
 
distortion analysis of cmos based analog circuits
distortion analysis of cmos based analog circuitsdistortion analysis of cmos based analog circuits
distortion analysis of cmos based analog circuits
 
A Review on Wide Bandwidth Low Noise Amplifier for Modern Wireless Communication
A Review on Wide Bandwidth Low Noise Amplifier for Modern Wireless CommunicationA Review on Wide Bandwidth Low Noise Amplifier for Modern Wireless Communication
A Review on Wide Bandwidth Low Noise Amplifier for Modern Wireless Communication
 
chapter-2_part-2.ppt
chapter-2_part-2.pptchapter-2_part-2.ppt
chapter-2_part-2.ppt
 
Telecommunications basics
Telecommunications basicsTelecommunications basics
Telecommunications basics
 
Frequency coordination-between-umts-and-gsm-systems-900-mhz
Frequency coordination-between-umts-and-gsm-systems-900-mhzFrequency coordination-between-umts-and-gsm-systems-900-mhz
Frequency coordination-between-umts-and-gsm-systems-900-mhz
 
Frequency coordination between umts and gsm systems at 900 m hz
Frequency coordination between umts and gsm systems at 900 m hzFrequency coordination between umts and gsm systems at 900 m hz
Frequency coordination between umts and gsm systems at 900 m hz
 
2.4GHz/5.8GHz WiFi Antenna Principle And Parameters
2.4GHz/5.8GHz WiFi Antenna Principle And Parameters2.4GHz/5.8GHz WiFi Antenna Principle And Parameters
2.4GHz/5.8GHz WiFi Antenna Principle And Parameters
 
Double feedback technique for reduction of Noise LNA with gain enhancement
Double feedback technique for reduction of Noise LNA with gain enhancementDouble feedback technique for reduction of Noise LNA with gain enhancement
Double feedback technique for reduction of Noise LNA with gain enhancement
 
Volume 2-issue-6-1965-1968
Volume 2-issue-6-1965-1968Volume 2-issue-6-1965-1968
Volume 2-issue-6-1965-1968
 
Volume 2-issue-6-1965-1968
Volume 2-issue-6-1965-1968Volume 2-issue-6-1965-1968
Volume 2-issue-6-1965-1968
 
Integrated sub-harmonically pumped up-converter antenna for spatial power com...
Integrated sub-harmonically pumped up-converter antenna for spatial power com...Integrated sub-harmonically pumped up-converter antenna for spatial power com...
Integrated sub-harmonically pumped up-converter antenna for spatial power com...
 
Poster_140320705506
Poster_140320705506Poster_140320705506
Poster_140320705506
 
DESIGN AND ANALYSIS OF 2 GHz 130nm CMOS CASCODE LOW NOISE AMPLIFIER WITH INTE...
DESIGN AND ANALYSIS OF 2 GHz 130nm CMOS CASCODE LOW NOISE AMPLIFIER WITH INTE...DESIGN AND ANALYSIS OF 2 GHz 130nm CMOS CASCODE LOW NOISE AMPLIFIER WITH INTE...
DESIGN AND ANALYSIS OF 2 GHz 130nm CMOS CASCODE LOW NOISE AMPLIFIER WITH INTE...
 
PID1063629
PID1063629PID1063629
PID1063629
 
Fundamental of Radio Frequency communications.ppt
Fundamental of Radio Frequency communications.pptFundamental of Radio Frequency communications.ppt
Fundamental of Radio Frequency communications.ppt
 
Radio frequency power point presentation
Radio frequency power point presentationRadio frequency power point presentation
Radio frequency power point presentation
 
An introduction to spread spectrum communications
An introduction to spread spectrum communicationsAn introduction to spread spectrum communications
An introduction to spread spectrum communications
 

More from Cisco Service Provider

SP Network Automation: Automated Operations Overview
SP Network Automation: Automated Operations Overview SP Network Automation: Automated Operations Overview
SP Network Automation: Automated Operations Overview Cisco Service Provider
 
[Whitepaper] Cisco Vision: 5G - THRIVING INDOORS
[Whitepaper] Cisco Vision: 5G - THRIVING INDOORS[Whitepaper] Cisco Vision: 5G - THRIVING INDOORS
[Whitepaper] Cisco Vision: 5G - THRIVING INDOORSCisco Service Provider
 
[Infographic] Cisco Visual Networking Index (VNI): Mobile-Connected Devices p...
[Infographic] Cisco Visual Networking Index (VNI): Mobile-Connected Devices p...[Infographic] Cisco Visual Networking Index (VNI): Mobile-Connected Devices p...
[Infographic] Cisco Visual Networking Index (VNI): Mobile-Connected Devices p...Cisco Service Provider
 
[Infographic] Cisco Visual Networking Index (VNI): Mobile Users Growth
[Infographic] Cisco Visual Networking Index (VNI): Mobile Users Growth[Infographic] Cisco Visual Networking Index (VNI): Mobile Users Growth
[Infographic] Cisco Visual Networking Index (VNI): Mobile Users GrowthCisco Service Provider
 
Cisco Cloud-Scale Innovation Infographic
Cisco Cloud-Scale Innovation InfographicCisco Cloud-Scale Innovation Infographic
Cisco Cloud-Scale Innovation InfographicCisco Service Provider
 
Operator Drives Bandwidth Efficiency and Optimizes Satellite Link Performance
Operator Drives Bandwidth Efficiency and Optimizes Satellite Link PerformanceOperator Drives Bandwidth Efficiency and Optimizes Satellite Link Performance
Operator Drives Bandwidth Efficiency and Optimizes Satellite Link PerformanceCisco Service Provider
 
Application Engineered Routing Segment Routing and the Cisco WAN Automation ...
Application Engineered Routing  Segment Routing and the Cisco WAN Automation ...Application Engineered Routing  Segment Routing and the Cisco WAN Automation ...
Application Engineered Routing Segment Routing and the Cisco WAN Automation ...Cisco Service Provider
 
Research Highlight: Independent Validation of Cisco Service Provider Virtuali...
Research Highlight: Independent Validation of Cisco Service Provider Virtuali...Research Highlight: Independent Validation of Cisco Service Provider Virtuali...
Research Highlight: Independent Validation of Cisco Service Provider Virtuali...Cisco Service Provider
 
Cisco Policy Suite for Service Providers
Cisco Policy Suite for Service ProvidersCisco Policy Suite for Service Providers
Cisco Policy Suite for Service ProvidersCisco Service Provider
 
Deploy New Technologies Quickly with Cisco Managed Services for Service Provi...
Deploy New Technologies Quickly with Cisco Managed Services for Service Provi...Deploy New Technologies Quickly with Cisco Managed Services for Service Provi...
Deploy New Technologies Quickly with Cisco Managed Services for Service Provi...Cisco Service Provider
 
Segment Routing: Prepare Your Network For New Business Models
Segment Routing:  Prepare Your Network For New Business ModelsSegment Routing:  Prepare Your Network For New Business Models
Segment Routing: Prepare Your Network For New Business ModelsCisco Service Provider
 
Cisco Virtual Managed Services: Transform Your Business with Cloud-based Inn...
Cisco Virtual Managed Services:  Transform Your Business with Cloud-based Inn...Cisco Virtual Managed Services:  Transform Your Business with Cloud-based Inn...
Cisco Virtual Managed Services: Transform Your Business with Cloud-based Inn...Cisco Service Provider
 
Cisco Virtual Managed Services Solution
Cisco Virtual Managed Services SolutionCisco Virtual Managed Services Solution
Cisco Virtual Managed Services SolutionCisco Service Provider
 
Cisco cBR-8 Evolved CCAP: Deliver Scalable Network and Service Growth at a Lo...
Cisco cBR-8 Evolved CCAP: Deliver Scalable Network and Service Growth at a Lo...Cisco cBR-8 Evolved CCAP: Deliver Scalable Network and Service Growth at a Lo...
Cisco cBR-8 Evolved CCAP: Deliver Scalable Network and Service Growth at a Lo...Cisco Service Provider
 

More from Cisco Service Provider (20)

SP 5G: Unified Enablement Platform
SP 5G: Unified Enablement Platform  SP 5G: Unified Enablement Platform
SP 5G: Unified Enablement Platform
 
SP Network Automation: Automated Operations Overview
SP Network Automation: Automated Operations Overview SP Network Automation: Automated Operations Overview
SP Network Automation: Automated Operations Overview
 
[Whitepaper] Cisco Vision: 5G - THRIVING INDOORS
[Whitepaper] Cisco Vision: 5G - THRIVING INDOORS[Whitepaper] Cisco Vision: 5G - THRIVING INDOORS
[Whitepaper] Cisco Vision: 5G - THRIVING INDOORS
 
Cisco at OFC 2016
Cisco at OFC 2016Cisco at OFC 2016
Cisco at OFC 2016
 
[Infographic] Cisco Visual Networking Index (VNI): Mobile-Connected Devices p...
[Infographic] Cisco Visual Networking Index (VNI): Mobile-Connected Devices p...[Infographic] Cisco Visual Networking Index (VNI): Mobile-Connected Devices p...
[Infographic] Cisco Visual Networking Index (VNI): Mobile-Connected Devices p...
 
[Infographic] Cisco Visual Networking Index (VNI): Mobile Users Growth
[Infographic] Cisco Visual Networking Index (VNI): Mobile Users Growth[Infographic] Cisco Visual Networking Index (VNI): Mobile Users Growth
[Infographic] Cisco Visual Networking Index (VNI): Mobile Users Growth
 
Cisco Cloud-Scale Innovation Infographic
Cisco Cloud-Scale Innovation InfographicCisco Cloud-Scale Innovation Infographic
Cisco Cloud-Scale Innovation Infographic
 
Simplify Operations
Simplify OperationsSimplify Operations
Simplify Operations
 
Expand Your Market Opportunities
Expand Your Market OpportunitiesExpand Your Market Opportunities
Expand Your Market Opportunities
 
Orchestrated Assurance
Orchestrated Assurance Orchestrated Assurance
Orchestrated Assurance
 
Operator Drives Bandwidth Efficiency and Optimizes Satellite Link Performance
Operator Drives Bandwidth Efficiency and Optimizes Satellite Link PerformanceOperator Drives Bandwidth Efficiency and Optimizes Satellite Link Performance
Operator Drives Bandwidth Efficiency and Optimizes Satellite Link Performance
 
Application Engineered Routing Segment Routing and the Cisco WAN Automation ...
Application Engineered Routing  Segment Routing and the Cisco WAN Automation ...Application Engineered Routing  Segment Routing and the Cisco WAN Automation ...
Application Engineered Routing Segment Routing and the Cisco WAN Automation ...
 
Research Highlight: Independent Validation of Cisco Service Provider Virtuali...
Research Highlight: Independent Validation of Cisco Service Provider Virtuali...Research Highlight: Independent Validation of Cisco Service Provider Virtuali...
Research Highlight: Independent Validation of Cisco Service Provider Virtuali...
 
Cisco Policy Suite for Service Providers
Cisco Policy Suite for Service ProvidersCisco Policy Suite for Service Providers
Cisco Policy Suite for Service Providers
 
Deploy New Technologies Quickly with Cisco Managed Services for Service Provi...
Deploy New Technologies Quickly with Cisco Managed Services for Service Provi...Deploy New Technologies Quickly with Cisco Managed Services for Service Provi...
Deploy New Technologies Quickly with Cisco Managed Services for Service Provi...
 
Segment Routing: Prepare Your Network For New Business Models
Segment Routing:  Prepare Your Network For New Business ModelsSegment Routing:  Prepare Your Network For New Business Models
Segment Routing: Prepare Your Network For New Business Models
 
Cisco Virtual Managed Services: Transform Your Business with Cloud-based Inn...
Cisco Virtual Managed Services:  Transform Your Business with Cloud-based Inn...Cisco Virtual Managed Services:  Transform Your Business with Cloud-based Inn...
Cisco Virtual Managed Services: Transform Your Business with Cloud-based Inn...
 
Cisco Virtual Managed Services Solution
Cisco Virtual Managed Services SolutionCisco Virtual Managed Services Solution
Cisco Virtual Managed Services Solution
 
Cisco cBR-8 Evolved CCAP: Deliver Scalable Network and Service Growth at a Lo...
Cisco cBR-8 Evolved CCAP: Deliver Scalable Network and Service Growth at a Lo...Cisco cBR-8 Evolved CCAP: Deliver Scalable Network and Service Growth at a Lo...
Cisco cBR-8 Evolved CCAP: Deliver Scalable Network and Service Growth at a Lo...
 
IPv6: Unleashing The Power
IPv6: Unleashing The PowerIPv6: Unleashing The Power
IPv6: Unleashing The Power
 

Recently uploaded

What is Artificial Intelligence?????????
What is Artificial Intelligence?????????What is Artificial Intelligence?????????
What is Artificial Intelligence?????????blackmambaettijean
 
Passkey Providers and Enabling Portability: FIDO Paris Seminar.pptx
Passkey Providers and Enabling Portability: FIDO Paris Seminar.pptxPasskey Providers and Enabling Portability: FIDO Paris Seminar.pptx
Passkey Providers and Enabling Portability: FIDO Paris Seminar.pptxLoriGlavin3
 
Digital Identity is Under Attack: FIDO Paris Seminar.pptx
Digital Identity is Under Attack: FIDO Paris Seminar.pptxDigital Identity is Under Attack: FIDO Paris Seminar.pptx
Digital Identity is Under Attack: FIDO Paris Seminar.pptxLoriGlavin3
 
Generative AI for Technical Writer or Information Developers
Generative AI for Technical Writer or Information DevelopersGenerative AI for Technical Writer or Information Developers
Generative AI for Technical Writer or Information DevelopersRaghuram Pandurangan
 
How AI, OpenAI, and ChatGPT impact business and software.
How AI, OpenAI, and ChatGPT impact business and software.How AI, OpenAI, and ChatGPT impact business and software.
How AI, OpenAI, and ChatGPT impact business and software.Curtis Poe
 
Sample pptx for embedding into website for demo
Sample pptx for embedding into website for demoSample pptx for embedding into website for demo
Sample pptx for embedding into website for demoHarshalMandlekar2
 
Unraveling Multimodality with Large Language Models.pdf
Unraveling Multimodality with Large Language Models.pdfUnraveling Multimodality with Large Language Models.pdf
Unraveling Multimodality with Large Language Models.pdfAlex Barbosa Coqueiro
 
TrustArc Webinar - How to Build Consumer Trust Through Data Privacy
TrustArc Webinar - How to Build Consumer Trust Through Data PrivacyTrustArc Webinar - How to Build Consumer Trust Through Data Privacy
TrustArc Webinar - How to Build Consumer Trust Through Data PrivacyTrustArc
 
Ensuring Technical Readiness For Copilot in Microsoft 365
Ensuring Technical Readiness For Copilot in Microsoft 365Ensuring Technical Readiness For Copilot in Microsoft 365
Ensuring Technical Readiness For Copilot in Microsoft 3652toLead Limited
 
New from BookNet Canada for 2024: Loan Stars - Tech Forum 2024
New from BookNet Canada for 2024: Loan Stars - Tech Forum 2024New from BookNet Canada for 2024: Loan Stars - Tech Forum 2024
New from BookNet Canada for 2024: Loan Stars - Tech Forum 2024BookNet Canada
 
The Fit for Passkeys for Employee and Consumer Sign-ins: FIDO Paris Seminar.pptx
The Fit for Passkeys for Employee and Consumer Sign-ins: FIDO Paris Seminar.pptxThe Fit for Passkeys for Employee and Consumer Sign-ins: FIDO Paris Seminar.pptx
The Fit for Passkeys for Employee and Consumer Sign-ins: FIDO Paris Seminar.pptxLoriGlavin3
 
Use of FIDO in the Payments and Identity Landscape: FIDO Paris Seminar.pptx
Use of FIDO in the Payments and Identity Landscape: FIDO Paris Seminar.pptxUse of FIDO in the Payments and Identity Landscape: FIDO Paris Seminar.pptx
Use of FIDO in the Payments and Identity Landscape: FIDO Paris Seminar.pptxLoriGlavin3
 
DevEX - reference for building teams, processes, and platforms
DevEX - reference for building teams, processes, and platformsDevEX - reference for building teams, processes, and platforms
DevEX - reference for building teams, processes, and platformsSergiu Bodiu
 
How to write a Business Continuity Plan
How to write a Business Continuity PlanHow to write a Business Continuity Plan
How to write a Business Continuity PlanDatabarracks
 
Transcript: New from BookNet Canada for 2024: BNC CataList - Tech Forum 2024
Transcript: New from BookNet Canada for 2024: BNC CataList - Tech Forum 2024Transcript: New from BookNet Canada for 2024: BNC CataList - Tech Forum 2024
Transcript: New from BookNet Canada for 2024: BNC CataList - Tech Forum 2024BookNet Canada
 
SIP trunking in Janus @ Kamailio World 2024
SIP trunking in Janus @ Kamailio World 2024SIP trunking in Janus @ Kamailio World 2024
SIP trunking in Janus @ Kamailio World 2024Lorenzo Miniero
 
"Subclassing and Composition – A Pythonic Tour of Trade-Offs", Hynek Schlawack
"Subclassing and Composition – A Pythonic Tour of Trade-Offs", Hynek Schlawack"Subclassing and Composition – A Pythonic Tour of Trade-Offs", Hynek Schlawack
"Subclassing and Composition – A Pythonic Tour of Trade-Offs", Hynek SchlawackFwdays
 
DSPy a system for AI to Write Prompts and Do Fine Tuning
DSPy a system for AI to Write Prompts and Do Fine TuningDSPy a system for AI to Write Prompts and Do Fine Tuning
DSPy a system for AI to Write Prompts and Do Fine TuningLars Bell
 
Developer Data Modeling Mistakes: From Postgres to NoSQL
Developer Data Modeling Mistakes: From Postgres to NoSQLDeveloper Data Modeling Mistakes: From Postgres to NoSQL
Developer Data Modeling Mistakes: From Postgres to NoSQLScyllaDB
 
A Deep Dive on Passkeys: FIDO Paris Seminar.pptx
A Deep Dive on Passkeys: FIDO Paris Seminar.pptxA Deep Dive on Passkeys: FIDO Paris Seminar.pptx
A Deep Dive on Passkeys: FIDO Paris Seminar.pptxLoriGlavin3
 

Recently uploaded (20)

What is Artificial Intelligence?????????
What is Artificial Intelligence?????????What is Artificial Intelligence?????????
What is Artificial Intelligence?????????
 
Passkey Providers and Enabling Portability: FIDO Paris Seminar.pptx
Passkey Providers and Enabling Portability: FIDO Paris Seminar.pptxPasskey Providers and Enabling Portability: FIDO Paris Seminar.pptx
Passkey Providers and Enabling Portability: FIDO Paris Seminar.pptx
 
Digital Identity is Under Attack: FIDO Paris Seminar.pptx
Digital Identity is Under Attack: FIDO Paris Seminar.pptxDigital Identity is Under Attack: FIDO Paris Seminar.pptx
Digital Identity is Under Attack: FIDO Paris Seminar.pptx
 
Generative AI for Technical Writer or Information Developers
Generative AI for Technical Writer or Information DevelopersGenerative AI for Technical Writer or Information Developers
Generative AI for Technical Writer or Information Developers
 
How AI, OpenAI, and ChatGPT impact business and software.
How AI, OpenAI, and ChatGPT impact business and software.How AI, OpenAI, and ChatGPT impact business and software.
How AI, OpenAI, and ChatGPT impact business and software.
 
Sample pptx for embedding into website for demo
Sample pptx for embedding into website for demoSample pptx for embedding into website for demo
Sample pptx for embedding into website for demo
 
Unraveling Multimodality with Large Language Models.pdf
Unraveling Multimodality with Large Language Models.pdfUnraveling Multimodality with Large Language Models.pdf
Unraveling Multimodality with Large Language Models.pdf
 
TrustArc Webinar - How to Build Consumer Trust Through Data Privacy
TrustArc Webinar - How to Build Consumer Trust Through Data PrivacyTrustArc Webinar - How to Build Consumer Trust Through Data Privacy
TrustArc Webinar - How to Build Consumer Trust Through Data Privacy
 
Ensuring Technical Readiness For Copilot in Microsoft 365
Ensuring Technical Readiness For Copilot in Microsoft 365Ensuring Technical Readiness For Copilot in Microsoft 365
Ensuring Technical Readiness For Copilot in Microsoft 365
 
New from BookNet Canada for 2024: Loan Stars - Tech Forum 2024
New from BookNet Canada for 2024: Loan Stars - Tech Forum 2024New from BookNet Canada for 2024: Loan Stars - Tech Forum 2024
New from BookNet Canada for 2024: Loan Stars - Tech Forum 2024
 
The Fit for Passkeys for Employee and Consumer Sign-ins: FIDO Paris Seminar.pptx
The Fit for Passkeys for Employee and Consumer Sign-ins: FIDO Paris Seminar.pptxThe Fit for Passkeys for Employee and Consumer Sign-ins: FIDO Paris Seminar.pptx
The Fit for Passkeys for Employee and Consumer Sign-ins: FIDO Paris Seminar.pptx
 
Use of FIDO in the Payments and Identity Landscape: FIDO Paris Seminar.pptx
Use of FIDO in the Payments and Identity Landscape: FIDO Paris Seminar.pptxUse of FIDO in the Payments and Identity Landscape: FIDO Paris Seminar.pptx
Use of FIDO in the Payments and Identity Landscape: FIDO Paris Seminar.pptx
 
DevEX - reference for building teams, processes, and platforms
DevEX - reference for building teams, processes, and platformsDevEX - reference for building teams, processes, and platforms
DevEX - reference for building teams, processes, and platforms
 
How to write a Business Continuity Plan
How to write a Business Continuity PlanHow to write a Business Continuity Plan
How to write a Business Continuity Plan
 
Transcript: New from BookNet Canada for 2024: BNC CataList - Tech Forum 2024
Transcript: New from BookNet Canada for 2024: BNC CataList - Tech Forum 2024Transcript: New from BookNet Canada for 2024: BNC CataList - Tech Forum 2024
Transcript: New from BookNet Canada for 2024: BNC CataList - Tech Forum 2024
 
SIP trunking in Janus @ Kamailio World 2024
SIP trunking in Janus @ Kamailio World 2024SIP trunking in Janus @ Kamailio World 2024
SIP trunking in Janus @ Kamailio World 2024
 
"Subclassing and Composition – A Pythonic Tour of Trade-Offs", Hynek Schlawack
"Subclassing and Composition – A Pythonic Tour of Trade-Offs", Hynek Schlawack"Subclassing and Composition – A Pythonic Tour of Trade-Offs", Hynek Schlawack
"Subclassing and Composition – A Pythonic Tour of Trade-Offs", Hynek Schlawack
 
DSPy a system for AI to Write Prompts and Do Fine Tuning
DSPy a system for AI to Write Prompts and Do Fine TuningDSPy a system for AI to Write Prompts and Do Fine Tuning
DSPy a system for AI to Write Prompts and Do Fine Tuning
 
Developer Data Modeling Mistakes: From Postgres to NoSQL
Developer Data Modeling Mistakes: From Postgres to NoSQLDeveloper Data Modeling Mistakes: From Postgres to NoSQL
Developer Data Modeling Mistakes: From Postgres to NoSQL
 
A Deep Dive on Passkeys: FIDO Paris Seminar.pptx
A Deep Dive on Passkeys: FIDO Paris Seminar.pptxA Deep Dive on Passkeys: FIDO Paris Seminar.pptx
A Deep Dive on Passkeys: FIDO Paris Seminar.pptx
 

Field Measurements of Nonlinear Distortion in Digital Cable Plants

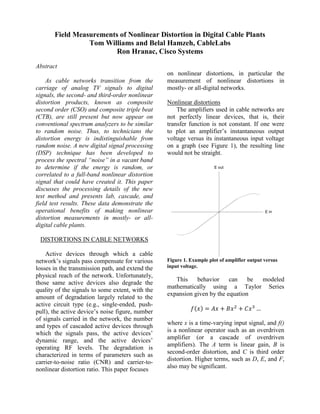
  • 1. Field Measurements of Nonlinear Distortion in Digital Cable Plants Tom Williams and Belal Hamzeh, CableLabs Ron Hranac, Cisco Systems Abstract As cable networks transition from the carriage of analog TV signals to digital signals, the second- and third-order nonlinear distortion products, known as composite second order (CSO) and composite triple beat (CTB), are still present but now appear on conventional spectrum analyzers to be similar to random noise. Thus, to technicians the distortion energy is indistinguishable from random noise. A new digital signal processing (DSP) technique has been developed to process the spectral “noise” in a vacant band to determine if the energy is random, or correlated to a full-band nonlinear distortion signal that could have created it. This paper discusses the processing details of the new test method and presents lab, cascade, and field test results. These data demonstrate the operational benefits of making nonlinear distortion measurements in mostly- or all- digital cable plants. DISTORTIONS IN CABLE NETWORKS Active devices through which a cable network’s signals pass compensate for various losses in the transmission path, and extend the physical reach of the network. Unfortunately, those same active devices also degrade the quality of the signals to some extent, with the amount of degradation largely related to the active circuit type (e.g., single-ended, push- pull), the active device’s noise figure, number of signals carried in the network, the number and types of cascaded active devices through which the signals pass, the active devices’ dynamic range, and the active devices’ operating RF levels. The degradation is characterized in terms of parameters such as carrier-to-noise ratio (CNR) and carrier-to- nonlinear distortion ratio. This paper focuses on nonlinear distortions, in particular the measurement of nonlinear distortions in mostly- or all-digital networks. Nonlinear distortions The amplifiers used in cable networks are not perfectly linear devices, that is, their transfer function is not constant. If one were to plot an amplifier’s instantaneous output voltage versus its instantaneous input voltage on a graph (see Figure 1), the resulting line would not be straight. This behavior can be modeled mathematically using a Taylor Series expansion given by the equation ( ) where x is a time-varying input signal, and f() is a nonlinear operator such as an overdriven amplifier (or a cascade of overdriven amplifiers). The A term is linear gain, B is second-order distortion, and C is third order distortion. Higher terms, such as D, E, and F, also may be significant. E out E in Figure 1. Example plot of amplifier output versus input voltage.
  • 2. In typical operating conditions, the amplifier operates in the linear region (solid line in Figure ). In non-ideal operating conditions, such as amplifier failure or overdriving the amplifier into its saturation region, the amplifier starts operating in the nonlinear region (dashed line in Figure 1). Nonlinear behavior in an amplifier is related in part to small-signal nonlinearities in the amplifier’s semiconductor devices, but mostly to signal compression that occurs as the amplifier is operated near its saturation point. Nonlinear distortions get their name from the nonlinear operation of the amplifier or other active device that creates the distortions. One notable differentiator between linear distortion, such as group delay, and nonlinear distortion is that linear distortion cannot create distortion energy at new frequencies, but nonlinear distortion can. Likewise, as an amplifier’s operating signal levels are increased, the relative output ratios of desired carrier levels to distortion levels will be maintained for linear distortion, but will not be maintained for nonlinear distortions. A graphical illustration of second order nonlinear distortion caused by two signals, F1 (75 MHz) and F2 (100 MHz), is shown in Figure 2. Note the discrete distortions or beats at the absolute value of the difference F1 - F2 (25 MHz), the second harmonic 2F1 (150 MHz), the sum of the two frequencies F1 + F2 (175 MHz), and the second harmonic 2F2 (200 MHz). Second and third order distortions A quick operational test to determine the order of nonlinear distortion in the spectrum is to elevate the amplifier’s input signal. If the distortion energy increases 3 dB for a 1 dB step increase of the input signal, the nonlinear distortion is probably third order. If the undesired energy increases 2 dB for a 1 dB step increase of the input signal, the nonlinear distortion is probably second order. Second order distortion in cable networks should be substantially suppressed relative to third order distortion because cable networks use balanced push-pull amplifiers. Push-pull amplifiers cancel even order (second, fourth, sixth, etc.) distortions. Expected potential sources of abnormal second order distortions are imperfect analog downstream linear lasers; damaged or unbalanced push-pull amplifiers; and distortion caused by diode-like junctions created by corrosion in the plant. Third order distortion is the dominant nonlinear distortion in cable networks. High- output amplifiers are used to provide needed dynamic range. Cable systems are operated with up-tilt (higher frequencies operated at higher RF output levels than lower frequencies) to provide more uniform distortion over the downstream band. The potential sources mentioned previously for second order distortion also can contribute to third order distortion. History In the days of 12-channel operation in North American cable networks, the active devices in the outside plant were single- ended. The nonlinear distortion of concern to most operators was for the most part cross- modulation (XMOD), which, if severe enough, produced a windshield wiper effect in the pictures of analog TV signals. XMOD is a third order distortion. Since 12-channel cable systems used the same frequencies and channel plan as over- Figure 2. Simplified graphic illustrating discrete second order distortion.
  • 3. the-air VHF broadcast television (54 MHz to 88 MHz for channels 2-6, and 174 MHz to 216 MHz for channels 7-13), the discrete second- and some of the third-order nonlinear distortions produced by amplifiers fell in parts of the spectrum where TV signals were not carried. The introduction of push-pull amplifier technology accommodated more usable channels beyond the 12 VHF broadcast equivalents. The new push-pull actives provided a significant improvement in second order nonlinear distortion performance, so the VHF midband and superband frequency ranges could now be used. That meant an increase in cable network channel capacity. As the downstream spectrum’s upper frequency limit continued to increase with improvements in active and passive device technology over time, so did the number of channels provided by cable operators. Along with increased channel counts were an increase in the numbers of discrete nonlinear distortion products or beats, eventually to the point where it became difficult or impossible to discern individual beats. Composite distortions Because of the almost “comb-like” regular frequency spacing of analog TV signals in a cable network using the CEA-542-D channel plan, the resulting distortions cluster at various and predictable frequencies in the spectrum. The individual distortions can be so numerous within each cluster that the descriptor composite distortion arguably is more appropriate than discrete distortion. CTB distortions of concern cluster in a narrow bandwidth under each visual carrier, and CSO distortion clusters appear ±0.75 and ±1.25 MHz relative to the visual carriers. Nonlinear distortions such as CTB, CSO, and common path distortion (CPD) don’t go away in an all-digital network. Rather than clusters of discrete distortions that occur in a network carrying large numbers of analog TV signals, the nonlinear distortions in a mostly- or all-digital network are noise-like. Those noise-like nonlinear distortion products are known as composite intermodulation noise (CIN), composite intermodulation distortion (CID) or intermodulation noise (IMN) – which should not be confused with thermal noise. (Note: The term composite intermodulation noise and its abbreviation are used in this paper.) Confusion does occur, though. It is widely-known that raising RF levels in the plant improves the CNR, where “N” is thermal noise. But in a system with a lot of digital signals, raising signal levels improves CNR to a point, then the noise floor starts to increase and the CNR appears to get worse. That seems counterintuitive, but the now- elevated noise floor no longer is just thermal noise. It is a combination of thermal noise and the previously mentioned noise-like nonlinear distortions. When characterizing plant performance in the presence of CIN, the term “carrier-to-composite noise (CCN) ratio” commonly is used. Indeed, CCN is a much more appropriate measurement metric than is CNR under these circumstances, because there is no practical way to differentiate thermal noise from CIN on a spectrum analyzer display. One could turn off all downstream signals except for automatic gain control/automatic level control (AGC/ALC) pilot(s); the noise-like nonlinear distortions would go away, leaving just thermal noise. Unfortunately, this method is service disruptive, and as such is not a practical way to characterize noise versus noise-like nonlinear distortions. How, then, can nonlinear distortions in a mostly- or all-digital network be measured in an operating network?
  • 4. Characterizing noise-like nonlinear distortion Noise-like nonlinear distortion energy is not random, and can be quantified with knowledge of the input signal that created it. It is particularly easy to quantify in vacant test bands, such as a roll-off region. If a vacant band is not available, one can be created by demodulating the RF signal occupying the band, and then subtracting it mathematically. There are a few possible ways that detection of signal distortion can be done. One method is to capture the same signal twice: One copy of which is a clean undistorted signal at the headend or hub site, and the other copy is captured at a test point in the field. This method has the added complexity of requiring synchronized capture and the transfer of data to a central processing point, in addition to removing linear distortion differences between the nonlinearly distorted signal and the pristine headend signal. Another method involves capturing the signal at the input and the output test points of an amplifier, and then determining how much additional distortion was added by the amplifier. The linear distortion of the amplifier, including diplex filters response, tilt, and equalization makes this method non- trivial. The next section of this paper describes a test methodology that requires only a signal capture at one location, where the single full band signal is captured in the field. The captured vacant band signal is stored as a “measured” signal, and processed with a “manufactured” signal. The level of match between the measured and manufactured signals determines how much nonlinear distortion was present in the captured signal’s vacant band. ONE-SIGNAL NONLINEAR DISTORTION TEST METHOD The following steps can be used to facilitate a one-signal nonlinear distortion measurement, using just the signal captured in the field. 1) Capture a full-band downstream signal (the entire downstream RF spectrum with all signals and vacant bands) using a digital oscilloscope that has a sampling rate of at least twice the bandwidth of the downstream band, and 10-12 bits of analog-to-digital (A- D) resolution for at least 32,768 samples. In our example, the downstream bandwidth is less than 1,250 MHz, thus the downstream signal is digitized at a rate of at least 2.5*109 Hz. If necessary, a low-distortion, low-noise preamplifier can be used to boost the full band downstream signal prior to capture (digital oscilloscopes generally have a poor noise figure). A low pass filter should be used to remove any energy above 1250MHz, to prevent aliasing. Figure 3 illustrates a time domain display of a signal captured by a digital oscilloscope operating at 2.5 giga- samples per second and 12 bits of A-D resolution. The downstream signal processing requires a vacant band, which may be a roll- off band. This example 54 MHz to 860 MHz signal comprised mostly digital signals, plus a few continuous wave (CW) carriers used as pilots and alignment aids. The captured signal contains a vacant band between about 770 MHz and 860 MHz, which is not evident in the time domain trace. 2) Convert the time domain signal of Figure 3 into the frequency domain with a fast Fourier transform (FFT). The resulting frequency domain plot is illustrated in Figure 4. In the frequency domain, the vacant band energy values between 770 MHz and 860 MHz are Figure 3. Captured time domain signal comprising 32768 samples, and with a duration of 16.384 µs.
  • 5. cut and stored. These frequency domain samples are called the “measured” vacant band distortion signal. Next, replace the vacant band energy in the frequency domain signal between 770 MHz and 860 MHz with zeroes. This spectral plot is illustrated in Figure 5. 3) Next, convert the 54 MHz to 860 MHz signal of Figure 5 with the newly-vacated band back into the time domain with an inverse fast Fourier transform (IFFT), and distort a resulting time sequence with a second and third order nonlinear distortion. The latter is accomplished by squaring and cubing each term in the time sequence. This creates a second order “manufactured” signal and a third order “manufactured” signal. This distortion manufacturing method gives a good approximate estimate because the nonlinear distortion components are small in operating cable networks. That is: ( ) 4) Convert the “manufactured” signals back into the frequency domain and store only the distortion components in the vacant band (770 MHz to 860 MHz in our example). 5) Process the vacant band “measured” signal with the vacant band “manufactured” signals. One processing method that has worked well is frequency domain division of the “manufactured” samples, illustrated in Figure 8, by the complex conjugate of the same frequency “measured” samples, illustrated in Figure 9, to produce frequency domain quotients. 6) Convert the 1024 frequency domain quotients into the time domain. This is illustrated in Figure 6 for second order distortion and Figure 7 for third order distortion. Energy in the first (DC) term Figure 4. Full bandwidth downstream frequency domain signal obtained by performing an FFT on the time samples shown in Figure 3. Figure 5. Full bandwidth downstream display with vacant band zeroed out. Figure 6. Time domain plot of quotient showing average first term relative to other terms, indicating low second order distortion. Figure 7. Time domain plot of quotient showing large first term relative to other terms, indicating third order distortion.
  • 6. indicates a match of the “measured” signal with the “manufactured” signal. 7) If necessary, averaging may be used to better discern the DC term relative to the other terms. Note that the DC terms are correlated vectors that will add, but the other terms are uncorrelated. 8) Repeat the previous steps for other orders of distortion that might be present. The plots of Figure 6 and Figure 7 are complex time series, and only 64 sample points are illustrated. As the number of averages increases, the noisy components associated with using a noise-like downstream test signal are reduced. Another improvement to reduce noise in the plots is to use a larger percentage of vacant bandwidth relative to the occupied bandwidth. There is generally a angle to the distortion, and in most observed tests on distorted cable amplifiers, the first term (t = 0) contains most of the energy. As the amplifier’s input drive level increases, both the level of nonlinear distortion and the angle of the DC terms change. OUTSIDE PLANT TESTING Test Results Obtained from Testing Inside Houses Figure 10 is a composite plot from seven different locations for second order distortion test results, and Figure 1 contains third order distortion results. Fifteen separate tests were conducted to determine if the measurements were repeatable, and 10 averages used for each point. Locations 6 and 7 had downstream high pass filters to block all but the data-only traffic. Note the top trace on the second order distortion Figure 10, which was location 3. This particular location was later diagnosed also have high linear distortion, as determined by ripples in the upstream equalization response. The .750 trunk cable feeding this location appeared to have been damaged when it was installed many years ago. In the photograph of Figure 12, one can make out the conduit which may have been fractured by a boring machine. The cable was severely kinked several feet below ground and corroding as one would expect. After repair both the second and third order distortion improved significantly. Figure 10. Second order results for seven locations (15 tests each location, 10 averages) The highest third order distortion came from a home with known ingress issues. Figure 9. Sample points of measured distortion from the vacant band. Figure 8. Sample points of manufactured second order distortion from the vacant band.
  • 7. Figure 11. Third order results for seven locations (15 tests each location, 10 averages) Figure 12. The kinked corroding cable causing the high second order distortion for location 3. Test Results Obtained from Testing a Node Plus 6 Amplifier Cascade Tests were performed on a cascade of node plus six push pull amplifiers. The amplifiers were capable of 860 MHz but were only loaded to 770 MHz, so testing was done in the vacant band between 770 MHz and 860 MHz, as described previously. Loading was with digital carriers. Figure 13 shows the test results for second and third order distortion. Note that the third order nonlinear distortion increased through the third amplifier as expected, but then began to decrease. At amplifiers 6 and 7 the nonlinear third order distortion took a precipitous drop. Second order distortion was not significant. Note, too, that the worst second order distortion was observed at the fiber node. Figure 13. Distortion changes in a cascade of node plus seven amplifiers This observed third order behavior is not understood at this time. One possible explanation is distortion cancellation by inadvertent addition out-of-phase distortion (a.k.a. predistortion). This method is used commercially in high power amplifiers to extend their dynamic ranges, but the authors are not aware of this being done in cable TV- type distribution amplifiers. Testing additional cascades will hopefully be done in the future to determine whether what was seen here was an anomaly. 0 0.05 0.1 0.15 0.2 0.25 0.3 0.35 0.4 0.45 0.5 1 2 3 4 5 6 7 8 Amplifier Number Cascade Nonlinear Distortion 2nd Order 3rd Order
  • 8. LAB TESTING Lab-based testing was conducted to validate the nonlinear distortion measurement concept discussed in this paper. A single- ended amplifier (Agilent 8447D) and a 54 MHz to 860 MHz cable push-pull hybrid amplifier (ATX model QDAXU) were used in the lab tests. The input signal was a broadband random noise source (NoiseCom UFX 7109) with its RF output filtered using a 600 MHz low pass filter (Mini-Circuits model BLP-600-75) to create a vacant test band around 800 MHz. The ratio of the energy in the DC term of the correlation plot to all other correlation coefficients was plotted versus input drive level as the input drive level was increased in 2 dB steps. Figure 14 shows that the single- ended amplifier first exhibited an increase in 2nd order distortion, followed by an increase in 3rd order distortion at higher input drive levels. Of interest was the second order distortion decreasing with heavy saturation levels. Figure 15 shows the same plots for the push-pull cable downstream amplifier. The second order distortion remains low for all drive levels, while the third order distortion increases with higher drive levels. Figure 14. Single-ended amplifier performance. Figure 15. Push-pull amplifier performance.
  • 9. RETURN PATH TESTING The nonlinear distortion measurement method described in this section was demonstrated at the CableLabs 2014 Winter Conference. This new method was developed to analyze RF signals to determine the presence of nonlinear distortion using digital signal processing techniques. The method involves multiple transmissions of a burst (or a known variant of the burst), and performing a full-band signal capture containing a vacant band having noise and/or distortion for each transmission. As described here, it is possible to use this measurement method to evaluate a cable network’s return spectrum, although it also could be used for other applications, such as wireless transmitters. The energy in the vacant band from the first burst transmission in Figure 18 is processed with the energy in the vacant band from the subsequent transmissions in Figure 18 to see the correlation between the two energies. Figure 16 shows the mid-split 5 MHz to 85 MHz upstream burst test signals with a vacant band 25 MHz to 35 MHz, where the energies were processed and analyzed. In situations where there is no nonlinear distortion occurring in the network, the signal in the vacant band is expected to be white Gaussian noise, and thus the energy captures in the vacant band from the multiple transmissions are expected to be uncorrelated. When nonlinear distortion does occur in the network, the signal in the vacant band is expected to contain distortion components from the transmitted signal; the energy levels of the distortion components in the vacant bands are directly related to the amount of distortion occurring in the network. In these situations, the energy captures in the vacant band from the multiple transmissions are expected to have a certain level of correlation. By correlating the energy captures in the vacant band, detection of non-linear distortion is possible. Figure 17 shows the result from correlating (using frequency domain processing) the vacant band energy captures for two identical time-separated bursts sent through a network suffering from nonlinear distortion. The presence of a large DC term in the correlation plot is indicative of the presence of nonlinear distortion. As mentioned previously, the transmitted bursts are sent in sequence, and are either identical, or the subsequent bursts could be a variant of the original burst. One option would be to transmit a second identical burst and the third burst as an inverted version of the original burst as is shown in Figure 18. Transmission of the third inverted burst enables the identification of odd-ordered distortion in the network such as CTB. To detect CTB (or odd-ordered distortion), the correlation results of the Figure 16. Full band capture for upstream signal with a vacant band. Figure 17. Correlation plot of vacant band energy from two identical bursts. Figure 18. Multiple burst transmission in time domain: identical first and second bursts, identical but inverted third burst.
  • 10. vacant band energy of the first burst and the second burst are compared to the correlation results of the vacant band energy of the first (or second) burst and the third burst. If the correlation results from the inverted burst go negative, it is indicative of odd-ordered distortion. These test methods can potentially be incorporated into digital terminals and CMTSs, so that testing can be performed remotely without the need for a truck roll. Patent pending. SUMMARY This paper discussed nonlinear distortions in cable networks and methods to discriminate nonlinear distortion from thermal noise in all- digital networks. One method is appropriate for downstream signals which are continuous transmissions, and another method is for upstream transmissions, which are generally bursty. With these new test methods, cable operators can potentially move to new levels of plant fault detection. REFERENCES Broadband Cable Access Networks, by David Large and James Farmer (© 2009, Morgan Kaufmann Publishers, ISBN 978-0-12- 374401-2) Code of Federal Regulations, Title 47, Part 76 Modern Cable Television Technology, 2nd Edition, by Walter Ciciora, James Farmer, David Large, and Michael Adams (© 2004, Morgan Kaufmann Publishers, ISBN 1- 55860-828-1) SCTE Measurement Recommended Practices for Cable Systems, Fourth Edition, (© 2012, Society of Cable Telecommunications Engineers, TS46) ACKNOWLEDGMENTS: The authors wish to express their gratitude for access and support to the cable operators that supported research for this paper.