Electrolux Interim Report Q3 2018 - Report
•
1 j'aime•445 vues

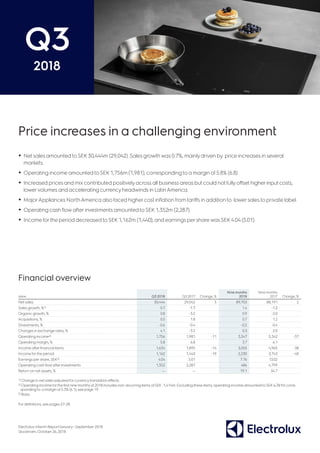
Highlights of the third quarter of 2018 Net sales amounted to SEK 30,444m (29,042). Sales growth was 0.7%, mainly driven by price increases in several markets. Operating income amounted to SEK 1,756m (1,981), corresponding to a margin of 5.8% (6.8). Increased prices and mix contributed positively across all business areas but could not fully offset higher input costs, lower volumes and accelerating currency headwinds in Latin America. Major Appliances North America also faced higher cost inflation from tariffs in addition to lower sales to private label. Operating cash flow after investments amounted to SEK 1,352m (2,287). Income for the period decreased to SEK 1,162m (1,440), and earnings per share was SEK 4.04 (5.01).

Recommandé
Recommandé
Contenu connexe
Tendances
Tendances (20)
Similaire à Electrolux Interim Report Q3 2018 - Report
Similaire à Electrolux Interim Report Q3 2018 - Report (20)
Plus de Electrolux Group
Plus de Electrolux Group (13)
Dernier
Dernier (19)
Electrolux Interim Report Q3 2018 - Report
- 1. Electrolux Interim ReportJanuary – September2018 Stockholm, October26, 2018 Q3 2018 Price increases in a challenging environment • Net sales amounted to SEK30,444m (29,042). Sales growth was 0.7%, mainlydriven by price increases in several markets. • Operating income amounted to SEK 1,756m (1,981), corresponding to a margin of 5.8% (6.8). • Increased prices and mixcontributed positivelyacross all business areas but could notfullyoffset higherinput costs, lowervolumes and accelerating currency headwinds in LatinAmerica. • MajorAppliances NorthAmerica also faced highercost inflation from tariffs in addition to lowersales to private label. • Operating cash flow afterinvestments amounted to SEK 1,352m (2,287). • Income forthe period decreased to SEK 1,162m (1,440), and earnings pershare was SEK4.04 (5.01). Financial overview SEKm Q3 2018 Q3 2017 Change, % Nine months 2018 Nine months 2017 Change, % Net sales 30,444 29,042 5 89,703 88,191 2 Sales growth, %1) 0.7 -1.7 1.4 -1.2 Organic growth, % 0.8 -3.2 0.9 -2.0 Acquisitions, % 0.5 1.8 0.7 1.2 Divestments, % -0.6 -0.4 -0.2 -0.4 Changes in exchange rates, % 4.1 -3.2 0.3 2.0 Operating income2) 1,756 1,981 -11 3,347 5,342 -37 Operating margin, % 5.8 6.8 3.7 6.1 Income afterfinancial items 1,634 1,895 -14 3,055 4,965 -38 Income forthe period 1,162 1,440 -19 2,230 3,743 -40 Earnings pershare, SEK3) 4.04 5.01 7.76 13.02 Operating cash flow afterinvestments 1,352 2,287 486 4,799 Return on net assets, % — — 19.1 34.7 1) Change in net sales adjusted forcurrencytranslation effects. 2)Operating income forthe first nine months of2018 includes non-recurring items ofSEK-1,414m. Excluding these items, operating income amounted to SEK4,761m corre- sponding to a margin of 5.3% (6.1), see page 19. 3) Basic. Fordefinitions, see pages 27-28.
- 2. 2 | AB ELECTROLUX INTERIM REPORT Q3 2018 Ourstrategic focus on innovation improving consumers’ experience, togetherwith high agility in today’s more challenging cost environment, are great competitive assets and I am very pleased to see that we are continuing to improve the product mix. Mix improvements togetherwith cost-based price increases contributed step-by-step to the development in the quarter. Organic growth was 0.8% while the operating margin con- tracted to 5.8%, as we were not yet able to fullyoffsetthe negative impact from higherraw material costs, currency headwinds and lowervolumes. EMEA’s performance was once again strong and I am pleased to see consumer-experienced innovation resulting in market share gains under ourpremium brands. OurNorthAmerican and LatinAmerican opera- tions implemented cost-based price increases, but also saw volumes declining. In addition to higherraw material costs, NorthAmerica faced highercost inflation from tariffs and also lowerprivate label sales, while the currency headwind accelerated forLatinAmerica.Asia Pacific increased its sales in SoutheastAsia but was impacted negatively bythe softerAustralian market. Home Care SDAis still in a producttransition phase with lowersales volumes as a consequence. Professional Products’ earnings remained solid and it is encouraging to see good growth across all segments, including the new beverage segment. Additional trade actions underSection 301 in the U.S. were announced in the quarter.We now estimate the negative year-over-yearimpactfrom raw materials, tariffs and currencyto be approximatelySEK3bn in 2018, compared to the previous estimate ofapproximatelySEK2.7bn. Looking into 2019, based on current market conditions, these combined head- winds could continue with a similaryear-over-yearimpact as in 2018.A significant portion ofthese effects are offset byalready implemented and announced price increases. Furtherprice increases will be implemented to mitigate cost inflation. With one quarterremaining in 2018, we have improved visibilityand revise ourmarket outlookfor2018 to more narrow ranges.The UKis still largely impacted by Brexit and hence the European market is expected to grow byapproximately 1% in 2018. Current macro trends indicate slightly softermarketdemand forAustralia. Outlook 2018 Market outlook, units year-over-year1) FY2018 Previous outlook for FY20185) Market outlook, units year-over-year1) FY2018 Previous outlook for FY20185) Europe ~ +1% +1% — +2% SoutheastAsia Positive Positive NorthAmerica 0% — +1% 0% — +2% Australia Slightly negative +/-0% LatinAmerica -1% — 0% -2% — +1% 1) Electrolux estimates forindustry shipments ofcore appliances. Business outlook2), year-over-year Q4 2018 FY2018 Previous outlook for the FY20185) Volume/price/mix Positive Positive Positive Raw material costs and trade tariffs Increase ofSEK~0.7bn Increase ofSEK~2.1bn Increase ofSEK~1.9bn6) Net cost efficiency3) Neutral Positive Positive Currency effect4) SEK-250m SEK-850m SEK-750m Capex Increase SEK ~6bn SEK ~6bn 2) Business outlook range: Positive - Neutral - Negative. 3) Efficiencies in variable costs (excl. raw materials and trade tariffs) and structural costs. 4) Impact on operating income forthe full year2018, whereofcurrencytransaction effects ofSEK-950m and currencytranslation effects ofSEK100m.The calculation is based on currency rates as perOctober17, 2018. 5) Published onJuly 18, 2018. 6) SEK~ 1.8bn in raw material costs and SEK~ 0.1bn in costs related to trade tariffs in the U.S. Note: Business outlook in the above table excludes non-recurring items. President and CEOJonas Samuelson’s comment Ourfocus on creating best-in-class consumerexperiences is vital to drive profitable growth. I am therefore very pleased that we launched a numberof new products with relevant consumerbenefits in the quarter; EMEAintroduced a new range of induction hobs designed to enhance the consumer’s cooking experience. Home Care SDAstrengthened its floorcare offering with a ground-breaking cordless vacuum cleanerthat can fully replace its corded counterpart. Professional Products presented a new laundry line, based on new product architecture, using cutting- edge innovations and connectivity solutions to maximize uptime and best-in-class energy savings. In October, we acquired SPM DrinkSystems, thereby expanding Professional Products’ current beverage offering, which is important in orderto become a full-service solution provider. Home Care SDA has now completed its product portfolio review afterdivesting its North American commercial and central vacuum cleanerbusinesses. I am confidentthat we are well positioned with the right business focus in this challenging cost environmentto continue delivering shareholder value.
- 3. 3 | AB ELECTROLUX INTERIM REPORT Q3 2018 Summary of the third quarter Net sales Sales forthe ElectroluxGroup increased by 0.7% in the quarter, exclud- ing currencytranslation effects.The organic growth was 0.8%, driven by higherprices and mix, although sales volumes declined.Acquisitions and divestments had an impact of 0.5% and -0.6%, respectively. Sales forMajorAppliances EMEAincreased as a result of higher volumes underpremium brands and an improved product mix. Major AppliancesAsia/Pacific reported strong growth in SoutheastAsia while sales inAustralia declined. Professional Products continued to grow across all three segments. Sales increased slightlyforMajorAppliances LatinAmerica, mainlyas a result ofcost-based price increases fully offsetting lowervolumes. Sales forMajorAppliances NorthAmerica declined. This was primarily related to lowersales volumes of products underprivate label while cost- based price increases contributed positively. Sales forHome Care SDA declined mainlydue to lowersales ofcorded vacuum-cleaners. Operating income Operating income declined to SEK 1,756m (1,981), corresponding to a margin of 5.8% (6.8).All business areas had positive earnings contribution from price/mix. However, this could notfullycompensate forincreased costs forraw materials, accelerating currency headwinds and lower volumes. Operating income forMajorAppliances EMEAimproved as a result of increased sales volumes and mix improvements. Operating income forMajorAppliances LatinAmerica was positively impacted by price increases and a reversal ofa provision.The performance of Professional Products remained solid. Operating income declined significantlyforMajorAppliances North America primarilydue to lowervolumes of private label products and increased input costs. MajorAppliancesAsia/Pacific’s earnings also declined, mainlydue to accelerating currency headwind. Home Care SDAreported a loweroperating income year-over-year. Effects of changes in exchange rates Changes in exchange rates had a negative year-over-yearimpact of SEK 252m. The impact oftransaction effects was SEK-353m and refers primarilyto the operations in LatinAmerica but also to operations in Australia and Europe.Translation effects in the quarteramounted to SEK102m. Financial net Net financial items forthe third quarteramounted to SEK –121m (–86). Income forthe period Income forthe period amounted to SEK 1,162m (1,440), corresponding to SEK 4.04 (5.01) in earnings pershare. SHARE OF SALES BYBUSINESSAREAINTHETHIRDQUARTEROF 2018 OPERATING INCOMEAND MARGIN The EBITmargin - 12m is excluding non-re- curring items, see pages 19 and 26. SEKm Q3 2018 Q3 2017 Change, % Nine months 2018 Nine months 2017 Change, % Net sales 30,444 29,042 5 89,703 88,191 2 Operating income MajorAppliances Europe, Middle East andAfrica 792 761 4 1,181 1,795 -34 MajorAppliances NorthAmerica 347 719 -52 792 2,310 -66 MajorAppliances LatinAmerica 200 77 163 178 207 -14 MajorAppliancesAsia/Pacific 174 214 -19 489 535 -9 Home Care SDA 69 89 -22 193 218 -12 Professional Products 280 272 3 841 779 8 Other, Common Group costs, etc. -107 -150 29 -326 -503 35 Total Group 1,756 1,981 -11 3,347 5,342 -37 Operating margin, % 5.8 6.8 3.7 6.1 Operating margin excl. non-recurring items, %1) 5.8 6.8 5.3 6.1 1) The non-recurring items refers to the first halfof2018, see page 19. First nine months of 2018 Sales growth forthe ElectroluxGroup was 1.4% in the first nine months, excluding currencytranslation effects. Organic growth was 0.9% and contribution from acquisitions and divestments was 0.7% and -0.2%, respectively. Operating income amounted to SEK 3,347m (5,342), correspond- ing to a margin of 3.7% (6.1). In the first nine months non-recurring items amounted to SEK -1,414m, see page 19. Excluding these non-recurring items, operating income amounted to SEK 4,761m corresponding to a margin of 5.3% (6.1). Income forthe period amounted to SEK2,230m (3,743), corresponding to SEK 7.76 (13.02) in earnings per share. 35% 33% 12% 7% 6% 7% Major Appliances Europe, Middle East and Africa Major Appliances North America Major Appliances Latin America Major Appliances Asia/Pacific Home Care SDA Professional Products 0 1 2 3 4 5 6 7 0 300 600 900 1,200 1,500 1,800 2,100 Q3 Q4 Q1 Q2 Q3 Q4 Q1 Q2 Q3 2016 2017 2018 %SEKm EBIT EBIT margin EBIT margin - 12m
- 4. 4 | AB ELECTROLUX INTERIM REPORT Q3 2018 Market overview Several markets, including the U.S. , Brazil,Argentina andAustralia, showed a weakerdemand trend in the quarter. Highercost-based pricing impacted marketvolumes negatively. However, the market in Europe increased driven by Eastern Europe whileWestern Europe declined somewhat. Formore information aboutthe markets, please see the Business areas section below and theAnnual Report 2017 pages 36-39. INDUSTRYSHIPMENTS OF COREAPPLIANCES IN EUROPE* INDUSTRYSHIPMENTS OF COREAPPLIANCES INTHE U.S.* Sources: Europe: Electrolux estimate, US:AHAM. Fordefinitions see, pages 4 and 5. Forothermarkets, there are no comprehensive market statistics. Major Appliances Europe, Middle East and Africa (EMEA) In the third quarter, overall marketdemand in Europe increased by 1% year-over-year.This continued to be driven by strong growth of 7% in Eastern Europe, while demand inWestern Europe declined by2%. Electroluxoperations in EMEAreported organic sales growth of 6.2% forthe quarter.This is primarilya result ofthe consistentfocus on premium brands resulting in increased sales volumes and product mix improve- ments.The business area continued to gain market shares in laundryand built-in kitchen products. Operating income improved as highervolumes and mix improve- ments offset increasing costs forraw material.The business area continues to invest in innovation forfuture product launches and the RD costs increased. During the quarter, new innovative induction hobs, a strategic profitable growth area forElectrolux, were introduced atthe IFA fairin Berlin, see page 11. Industry shipments ofcore appliances in Europe, units, year-over-year,%* Q3 2018 Q3 2017 Nine months 2018 Nine months 2017 Full year2017 Western Europe -2 1 -1 0 1 Eastern Europe (excludingTurkey) 7 4 7 4 5 Total Europe 1 1 1 1 2 SEKm Net sales 10,749 9,465 30,556 27,310 38,524 Organic growth,% 6.2 -1.1 6.0 -0.5 0.6 Acquisitions,% 0.4 2.5 1.3 1.8 2.1 Operating income 792 761 1,181 1,795 2,764 Operating margin,% 7.4 8.0 3.9 6.6 7.2 Operating margin excl. non-recurring items, %1) 7.4 8.0 6.5 6.6 7.2 Business areas *Units year-over-year, % * Source: Electrolux estimates. Core appliances include: Refrigeratiors, Freezers,Washing machines,Tumble dryers, Free-standing Cookers, Built-in Ovens, Built-in Hobs, Hoods and Dishwashers. 1) Forinformation on non-recurring items, see page 19. OPERATING INCOMEAND MARGIN The EBITmargin - 12m is excluding non-recurring items, see page 19 and 26. -6 -4 -2 0 2 4 6 8 10 12 Q3 Q4 Q1 Q2 Q3 Q4 Q1 Q2 Q3 2016 2017 2018 % -4 -2 0 2 4 6 8 10 12 -300 -150 0 150 300 450 600 750 900 1,050 Q3 Q4 Q1 Q2 Q3 Q4 Q1 Q2 Q3 2016 2017 2018 %SEKm EBIT EBIT margin EBIT margin - 12m -2 -1 0 1 2 3 4 5 6 7 8 9 Q3 Q4 Q1 Q2 Q3 Q4 Q1 Q2 Q3 2016 2017 2018 % Western Europe Eastern Europe
- 5. 5 | AB ELECTROLUX INTERIM REPORT Q3 2018 Major Appliances North America During the quarter, marketdemand forcore appliances in the U.S. declined by2% year-over-year, partly relating to higherindustry prices. Marketdemand formajorappliances, including microwave ovens and home-comfort products, was flat. Electroluxoperations in NorthAmerica reported an organic sales decline of 3.9% forthe quarter.This was mainly related to lowersales of products underprivate label. Cost-based price increases contributed positivelyto sales, although these had a somewhat negative impact on sales volumes in the quarter. Operating income declined significantly year-over-yeardue to lower volumes and increased costs related to raw material, logistics and the trade actions underSection 301 that were implemented during the quar- ter.The restructuring underChapter11 ofSears, a majorprivate label customer, had a negative non-material earnings effectfrom increased provisions. Price increases and mix improvements had a positive earn- ings impact. Last year’s earnings were positively impacted bya strong cost efficiencycontribution. Major Appliances Latin America In the third quarter, consumerdemand forcore appliances in Brazil and Argentina is estimated to have decreased. Uncertainties in the political and economic environment impacted marketdemand negatively, particularly inArgentina where the marketdeclined significantlyafter currencydevaluation. Consumerdemand in Chile is estimated to have been stable in the quarter. Electroluxoperations in LatinAmerica had organic sales growth of 0.5%. Price increases were implemented in Brazil,Argentina and Chile to mitigate increased costs forraw materials and currency headwinds.This had a negative impact on sales volumes across these regions. Operating income improved year-over-year. Operating income includes a positive impactfrom a reversal ofa provision related to an administrative case in the amount ofapproximatelySEK170m. Price increases and cost-saving measures mitigated increased costs forraw materials and accelerating currency headwinds. SEKm Q3 2018 Q3 2017 Nine months 2018 Nine months 2017 Full year2017 Net sales 3,640 4,132 11,978 12,290 17,302 Organic growth, % 0.5 7.4 8.8 0.7 7.9 Operating income 200 77 178 207 425 Operating margin, % 5.5 1.9 1.5 1.7 2.5 The EBITmargin - 12m is excluding non-recurring items, see page 19 and 26. * Source: Core appliances includesAHAM 6 (Washers, Dryers, Dishwashers, Refrigerators, Freezers, Ranges and Ovens) + Cooktops. Industry shipments ofappliances in the U.S., units, year-over-year, %* Q3 2018 Q3 2017 Nine months 2018 Nine months 2017 Full year2017 Core appliances -2 3 -1 4 3 Microwave ovens and home-comfort products 5 12 -1 14 14 Total MajorAppliances 0 5 -1 7 6 SEKm Net sales 9,949 9,544 29,062 31,093 40,656 Organic growth, % -3.9 -10.8 -6.4 -6.6 -6.1 Operating income 347 719 792 2,310 2,757 Operating margin, % 3.5 7.5 2.7 7.4 6.8 Operating margin excl. non-recurring items, %1) 3.5 7.5 4.8 7.4 6.8 1) Forinformation on non-recurring items, se page 19. OPERATING INCOMEAND MARGIN OPERATING INCOMEAND MARGIN -2 0 2 4 6 8 10 -200 0 200 400 600 800 1,000 Q3 Q4 Q1 Q2 Q3 Q4 Q1 Q2 Q3 2016 2017 2018 %SEKm EBIT EBIT margin EBIT margin - 12m -5 -4 -3 -2 -1 0 1 2 3 4 5 6 -200 -150 -100 -50 0 50 100 150 200 250 Q3 Q4 Q1 Q2 Q3 Q4 Q1 Q2 Q3 2016 2017 2018 %SEKm EBIT EBIT margin EBIT margin - 12m
- 6. 6 | AB ELECTROLUX INTERIM REPORT Q3 2018 Major Appliances Asia/Pacific During the third quarter, marketdemand inAustralia continued to decline year-over-year, partly related to price increases but also a slower property market.The market in SoutheastAsia remained favorable and increased. Electroluxorganic sales growth was 3.8%.This was a result of strong growth in SoutheastAsia, while sales inAustralia declined. InAustralia, the price increases implemented to mitigate increased costs related to currency headwinds had a negative impact on sales volumes. Operating income declined year-over-year.Accelerating currency headwinds and lowervolumes inAustralia togetherwith increased costs forraw materials were notfullycompensated by price increases and mix improvements. SEKm Q3 2018 Q3 2017 Nine months 2018 Nine months 2017 Full year2017 Net sales 2,238 2,081 6,610 6,322 8,759 Organic growth, % 3.8 -1.6 4.6 4.2 5.6 Acquisitions, % — 0.5 — 0.9 0.7 Operating income 174 214 489 535 750 Operating margin, % 7.8 10.3 7.4 8.5 8.6 Home Care Small Domestic Appliances In the third quarter, the overall marketforvacuum cleaners increased, driven bythe cordless category, while demand forthe corded category declined.The trend shift in marketdemand toward cordless products is accelerating. During the quarter, Electrolux launched a new premium cordless vacuum cleanerforthe global marketto strengthen its position in this important growth segment, see page 11. Organic sales declined by 6.4% in the quarter.This was mainly related to lowersales volumes ofcorded vacuum cleaners. In line with the business area’s strategyto focus on global brands and product catego- ries, the commercial and central vacuum-cleanerbusinesses in North America were divested, impacting sales by -9.0 %, see page 25. Operating income declined.The business area is still in a product transition phase with lowervolumes as a consequence, even though the mix improved.TheAnova business continued to report a negative result as launch delays was still a constraint. Continued investments in new product launches togetherwith theAnova development were offset by the net impactfrom the divestment. SEKm Q3 2018 Q3 2017 Nine months 2018 Nine months 2017 Full year2017 Net sales 1,733 1,922 5,236 5,538 7,808 Organic growth, % -6.4 -0.8 -6.8 -2.5 -4.2 Acquisitions, % — 5.6 0.9 3.4 4.7 Divestments, % -9.0 -5.9 -3.2 -6.7 -6.6 Operating income 69 89 193 218 431 Operating margin, % 4.0 4.6 3.7 3.9 5.5 OPERATING INCOMEAND MARGIN OPERATING INCOMEAND MARGIN 0 2 4 6 8 10 12 0 25 50 75 100 125 150 175 200 225 250 Q3 Q4 Q1 Q2 Q3 Q4 Q1 Q2 Q3 2016 2017 2018 %SEKm EBIT EBIT margin EBIT margin - 12m 0 2 4 6 8 10 0 50 100 150 200 250 Q3 Q4 Q1 Q2 Q3 Q4 Q1 Q2 Q3 2016 2017 2018 %SEKm EBIT EBIT margin EBIT margin - 12m
- 7. 7 | AB ELECTROLUX INTERIM REPORT Q3 2018 Professional Products Overall marketdemand forprofessional food-service and laundry equip- ment improved across most regions in the third quarter. Organic growth was 1.9%. Sales increased across all three segments food, laundryand beverage. The operating income and margin remained solid. Price increases and highersales volumes offset increased costs forraw materials and additional investments in customercare as well as in marketing and inno- vation.The previouslyacquired companySchneidereitGmbH is included in the consolidated accounts as ofSeptember, see page 24. The acquisition ofSPM DrinkSystems in Octoberfurtherexpands Professional Products’ current beverage offering and its role as a full- service solution providerand increases the presence in the hospitality industry, see pages 12 and 25. SEKm Q3 2018 Q3 2017 Nine months 2018 Nine months 2017 Full year2017 Net sales 2,135 1,897 6,261 5,638 7,723 Organic growth, % 1.9 6.4 3.1 6.7 5.6 Acquisitions, % 4.8 11.5 4.1 6.8 6.6 Operating income 280 272 841 779 1,054 Operating margin, % 13.1 14.3 13.4 13.8 13.7 OPERATING INCOMEAND MARGIN 0 2 4 6 8 10 12 14 16 0 40 80 120 160 200 240 280 320 360 Q3 Q4 Q1 Q2 Q3 Q4 Q1 Q2 Q3 2016 2017 2018 %SEKm EBIT EBIT margin EBIT margin - 12m
- 8. 8 | AB ELECTROLUX INTERIM REPORT Q3 2018 Operating cash flow afterinvestments amounted to SEK1,352m (2,287) in the quarter.The decline was due to lowerearnings, higherinvestments and lowercash flow from working capital, primarily relating to strong cash flow contribution from operating working capital last year. The divestment ofthe U.S.-based commercial and central vacuum cleanerbusinesses in NorthAmerica had a positive impact ofSEK285m on the cash flow in the quarter. Operating cash flow afterinvestments in the first nine month of2018 amounted to SEK486m (4,799).The deterioration is primarily related to lowercash flow from working capital, mainly lowercontribution from operating working capital related to lowervolumes in MajorAppliances NorthAmerica and MajorAppliances LatinAmerica. In addition, higher investments and lowerearnings impacted cash flow negatively. SEKm Q3 2018 Q3 2017 Nine months 2018 Nine months 2017 Full year2017 Operating income adjusted fornon-cash items1) 2,620 2,902 7,593 8,384 11,405 Change in operating assets and liabilities 331 584 -3,516 -889 267 Operating cash flow 2,952 3,486 4,077 7,495 11,672 Investments in tangible and intangible assets -1,384 -1,135 -3,207 -2,699 -4,857 Changes in otherinvestments -216 -64 -383 3 62 Operating cash flow after investments 1,352 2,287 486 4,799 6,877 Acquisitions and divestments ofoperations 284 -96 -146 -3,394 -3,405 Operating cash flow after structural changes 1,636 2,191 340 1,405 3,472 Financial items paid, net2) -124 -39 -193 -170 -227 Taxes paid -160 -421 -675 -976 -1,421 Cash flow from operations and investments 1,352 1,731 -528 259 1,824 Dividend — — -1,193 -1,078 -2,155 Share-based payments — — -218 -488 -483 Total cash flow, excluding changes in loans and short–term investments 1,352 1,731 -1,939 -1,307 -814 1) Operating income adjusted fordepreciation, amortization and othernon-cash items. 2) Forthe periodJanuary 1 to September30, 2018: interests and similaritems received SEK 97m (160), interests and similaritems paid SEK-302m (–254) and otherfinancial items paid/received SEK12m (–76). Cash flow OPERATING CASH FLOWAFTER INVESTMENTS -3,000 -2,400 -1,800 -1,200 -600 0 600 1,200 1,800 2,400 3,000 Q3 Q4 Q1 Q2 Q3 2017 2018 SEKm
- 9. 9 | AB ELECTROLUX INTERIM REPORT Q3 2018 Net debt As ofSeptember30, 2018, Electrolux had a financial net cash position ofSEK 992m compared to the net financial cash position ofSEK 2,437m as of December31, 2017. Net provisions forpost-employment benefits decreased to SEK 2,593m. In total, netdebt amounted to SEK 1,601m, an increase bySEK 1,404m compared to SEK 197m as of December31, 2017. Long-term borrowings and long-term borrowings with maturities within 12 months amounted to a total ofSEK 8,897m as ofSeptember30, 2018 with average maturityof 2.7 years, compared to SEK 8,088m and 2.4 years atthe end of2017. During the fourth quarterof2018, long-term borrowings amounting to approximatelySEK 350m will mature. Liquid funds as ofSeptember30, 2018, amounted to SEK 11,373m, a decrease ofSEK 601m compared to SEK 11,974m as of December 31, 2017. Working capital and net assets Working capital as ofSeptember30, 2018, amounted to SEK –14,714m (–14,436), corresponding to -12,2% (–12.6) ofannualized net sales. Oper- ating working capital amounted to SEK 5,881m (5,155), corresponding to 4.9% (4.5) ofannualized net sales, see page 21. Average net assets forthe first nine month of2018 amounted to SEK 23,333m (20,546), corresponding to 19.5% (17.5) ofannualized net sales. Net assets as ofSeptember30, 2018, amounted to SEK 23,480m (20,170). Return on net assets was 19.1% (34.7), and return on equity was 14.3% (28.7). Net debt SEKm Sep. 30, 2018 Sep. 30, 2017 Dec. 31, 2017 Short-term loans 1,031 1,066 990 Short-term part of long-term loans 1,596 1,653 1,501 Trade receivables with recourse 219 95 204 Short-term borrowings 2,846 2,814 2,695 Financial derivative liabilities 166 52 228 Accrued interest expenses and prepaid interest income 68 40 27 Total short-term borrowings 3,080 2,906 2,950 Long-term borrowings 7,301 6,914 6,587 Total borrowings1) 10,381 9,820 9,537 Cash and cash equivalents 10,874 11,084 11,289 Short-term investments 178 160 358 Financial derivative assets 73 188 85 Prepaid interest expenses and accrued interest income 248 239 242 Liquid funds2) 11,373 11,671 11,974 Financial net debt -992 -1,851 -2,437 Net provisions forpost-employment benefits 2,593 2,764 2,634 Net debt 1,601 913 197 Netdebt/equity ratio 0.08 0.05 0.01 Total equity 20,686 18,179 20,480 Equity pershare, SEK 71.98 63.26 71.26 Return on equity, % 14.3 28.7 31.9 Equity/assets ratio, % 25.3 23.6 26.4 1) Whereof interest-bearing liabilities amounting to SEK9,928m as ofSeptember30, 2018 and SEK9,633m as ofSeptember30, 2017 and SEK 9,078m as of December31, 2017. 2) Electrolux has one unused committed back-up multicurrency revolving creditfacilityof EUR 1,000m, approximatelySEK 10,300m, expiring in 2023. Financial position
- 10. 10 | AB ELECTROLUX INTERIM REPORT Q3 2018 Asbestos litigation in the U.S. Litigation and claims related to asbestos are pending againstthe Group in the US.Almost all ofthe cases referto externally supplied components used in industrial products manufactured bydiscontinued operations priorto the early 1970s.The cases involve plaintiffs who have made substantially identical allegations against otherdefendants who are not part ofthe ElectroluxGroup. As ofSeptember30, 2018, the Group had a total of 3,389 (3,411) cases pending, representing approximately 3,431 (approximately 3,474) plain- tiffs. During the third quarterof2018, 300 new cases with 300 plaintiffs were filed and 270 pending cases with approximately270 plaintiffs were resolved. It is expected that additional lawsuits will be filed against Electrolux. It is not possible to predictthe numberoffuture lawsuits. In addition, the outcome ofasbestos lawsuits is difficultto predict and Electroluxcannot provide anyassurances thatthe resolution ofthese types of lawsuits will not have a material adverse effect on its business oron results ofopera- tions in the future. As an international group with a wide geographic spread, Electrolux is exposed to a numberof business and financial risks.The business risks can be divided into strategic, operational and legal risks.The financial risks are related to such factors as exchange rates, interest rates, liquidity, the giving ofcredit and financial instruments. Risk management in Electroluxaims to identify, control and reduce risks. Risks, risk management and risk exposure are described in more detail in the 2017Annual Report, www.electrolux.com/annualreport2017 Other items Risks and uncertainty factors
- 11. 11 | AB ELECTROLUX INTERIM REPORT Q3 2018 Innovation targeting best-in-class consumer experiences Electroluxfocuses on bringing innovations to consumers that enhance experiences in the areas ofgreattasting food, perfect care forclothes, and healthy wellbeing in theirhomes.This is done with a strong focus on environmental sustainability. Innovation is the keydriverforlong term profitable growth and margin improvement. January 11 New appliances to be launched in NorthAmerica as Frigidaire celebrates 100 years of innovation March 5 Electroluxconnected steam oven with built-in camera makes its marketdebut March 26 Electrolux launches Pure i9 robotic vacuum in the United States April 10 Electrolux launches its first open innovation factory August 21 Electrolux launches groundbreaking cordless vacuum cleaner August 29 Electrolux showcases innovative solutions at IFAin Berlin Examples of innovations during 2018 Creating a new segment to strengthen position in cordless vacuum cleaners Electrolux has been atthe forefront ofvacuum cleaning innovation for 100 years and continues to drive innovation where consumerexperience is the key leverto drive competitive advantage. Cordless vacuum clean- ers is the most important strategic growth categoryforthe Home Care Small DomesticAppliances business area.The new Pure F9 is based on in-depth consumerinsights in cleaning behaviors and pain points in key European andAsian markets.With the Pure F9 innovation targeting the premium market, Electrolux is creating a new segment in cordless vacuum cleaners as Pure F9 can fully replace the corded vacuum cleaner in orderto provide ultimate surface cleaning freedom. Powerful battery technologyand innovative design solutions provide consumers with a productthat combines the performance ofa traditional vacuum cleaner with the freedom ofa stickvacuum and allows consumers to clean their homes on a single charge. The Pure F9, was introduced atthe IFAconsumerelectronics fairin Berlin inAugust and launched in Septemberunderthe Electroluxand AEG brands, starting with Europe andAsia Pacific.The product has been well received bythe market and was named “best-in-test” in the German Magazine ETMTESTMAGAZIN, in comparison with both corded and cordless vacuum cleaners. Induction hobs a strategic profitable growth area Forseveral years, Electrolux MajorAppliances EMEAhas consistently focused on induction hob innovation as an important profitable growth area. Based on consumerinsights and in-house developed technology, Electrolux has been able to outpace the high market growth in this built-in kitchen segment and has increased its European market share by more than 5 percentage points overthe lastten years.The focus on induction hobs has generated strong profitable growth due to clearconsumer experience benefits. Electrolux has a strong range offering across the induction segmentfrom basic induction to prepare food fasterand with higherprecision to more premium induction hobs with flexible surfaces and great usability, in addition to the newly introduced induction hobs featuring functions forassisted cooking to furtherimprove cooking results. Atthe IFAfairin Berlin, a new range of induction hobs that provides precise and automated assistance was demonstrated.The new SenseCook induction hob range includes the SenseProbe induction hob with a world first wireless and battery-less food probe, that automatically controls the hob in orderto achieve perfect results foreverything from sauces to steaks, and even enables sous-vide precision cooking. Formore information, see www.electroluxgroup.com
- 12. 12 | AB ELECTROLUX INTERIM REPORT Q3 2018 Events during and afterthe quarter Events during the third quarter of 2018 July 17. Electrolux sets provision of MEUR 25 related to unfavorable court ruling in France InJuly, a court in France ruled that a reorganization procedure of a former subsidiary was extended to Electrolux Home Products France SAS (“EHP France”), Electrolux sales company for majorappliances in France.The decision relates to a dispute overthe 2014 divestment of the subsidiary, which has subsequently failed to develop a viable business. In September 2018, the court approved a joint continuation plan for EHP France and the subsidiary and allowed the entities to exit from the reorganization pro- ceedings.The exit means that EHP France can operate without involve- ment of the court appointed officials but that it will be undera certain supervision bythe local court during the term of the implementation of the continuation plan. Electrolux has set a provision of MEUR 25 (MSEK254) to cover poten- tial costs.The provision was reported as a non-recurring item in the results forthe second quarterof 2018, affecting the business area Major Appliances EMEA. August 8. Electrolux divests BEAM and Sanitaire in North America Electrolux has divested its U.S.-based commercial and central vacuum cleaner businesses in NorthAmerica, including the brands Sanitaire and BEAM.The decision is in line with the strategy of the business area Home Care SDAto focus on global brands and product categories, see page 25. August 16. Management changes in AB Electrolux Electrolux has announced changes in the Group Management team and a revision of part of the business area organizational structure:The man- agement changes are effective as from October 1, 2018 and the change in the business area organizational structure fromJanuary 1, 2019. Kenneth L. Ng, previous Head of MajorAppliancesAsia Pacific, has retired from the company. The majorappliances organization in Middle East andAfrica (MEA), which is currently part of MajorAppliances Europe, Middle East andAfrica (EMEA), will be included in MajorAppliancesAsia Pacific. DanArler, previous Head of MajorAppliances EMEA, is new Head of MajorAppliancesAsia Pacific MEA. Anna Ohlsson-Leijon, previous Chief Financial Officer (CFO) ofAB Electrolux, is new Head of MajorAppliances Europe. Therese Friberg, previous CFO of MajorAppliances EMEA, has been appointed new CFO ofAB Electrolux. September 13. Electrolux retains position as industry leader in Dow Jones Sustainability Indices Electrolux has been named Industry Leader in the Household Durables category in the DowJones SustainabilityWorld Index (DJSI World). It is the twelfth consecutive yearthat Electrolux receives this recognition in the assessment, which is published by RobecoSAM. In all dimensions – eco- nomic, environmental and social, Electrolux obtains a leadership position in the industry. September 26. Nomination Committee appointed for ElectroluxAnnual General Meeting 2019 The members of the Nomination Committee have been appointed based on the ownership structure as ofAugust 31, 2018.Johan Forssell, Investor AB, is the Chairman of the committee.The other members are KajThorén, Alecta, Marianne Nilsson, Swedbank Robur Funds, and Carine Smith Ihenacho, Norges Bank Investment Management.The committee will also include Staffan Bohman and Fredrik Persson, Chairman and Director, respectively, of Electrolux. Events after the third quarter of 2018 October 2. Electrolux strengthens its professional beverage offering by acquiring SPM Drink Systems Electrolux has acquired SPM Drink Systems, an Italian leading manu- facturerof professional dispensers of frozen and hot beverages and soft ice-cream, as part of the strategyto increase its presence in the hospitality industry. The acquisition supports Electrolux strategy for profitable growth. Togetherwith the 2017 acquisition of Grindmaster-Cecilware in North America, it strengthens Electrolux presence in the fast-growing beverage segment.The acquired operations had combined net sales of approxi- mately EUR 30 million in 2017, and 110 employees.The company’s headquarters and main manufacturing facilities are based in Spilamberto, Modena, Italy. October 15. Electrolux comments on impact from development in Sears Electrolux commented the announcement by Sears Holdings Corpora- tion, a major U.S. customer, that it has filed voluntary petitions for relief underChapter 11 of the U.S. BankruptcyCode. Following the announcement, Electrolux intends to work with Sears’ restructuring officerto explore the prospects of continuing its business with Sears, while continuing to manage the financial and operational exposure. To ensure business continuity and to mitigate the financial exposure, Electrolux has been actively planning forvarious Sears’ contingencies while also growing the business with othercustomers.Therefore, the Group does not currently assess a need for material one-time costs as an imme- diate consequence of Sears’ restructuring underChapter 11. However, while it is difficult to predict the outcome of Sears’ attempt to restructure its business and the various scenarios it may entail, it cannot be ruled out that there may be a material impact on the future sales and earnings of Electrolux business area MajorAppliances NorthAmerica. MajorAppliances NorthAmerica’s exposure to Sears is currently about 10 percent of the business area’s total revenues. For more information, visit www.electroluxgroup.com
- 13. 13 | AB ELECTROLUX INTERIM REPORT Q3 2018 Parent CompanyAB Electrolux The ParentCompanycomprises the functions ofthe Group’s head office, as well as five companies operating on a commission basis forAB Electrolux. Net sales forthe ParentCompany,AB Electrolux, forthe first nine months 2018 amounted to SEK 27,843m (25,270) of which SEK22,661m (20,611) referred to sales toGroup companies and SEK 5,182m (4,659) to external customers. Income afterfinancial items was SEK2,270m (4,640), including dividends from subsidiaries in the amount ofSEK2,435m (4,685). Income forthe period amounted to SEK638m (4,671). Capital expenditure in tangible and intangible assets was SEK435m (278). Liquid funds atthe end ofthe period amounted to SEK4,531m, as againstSEK6,066m atthe start ofthe year. Undistributed earnings in the ParentCompanyatthe end ofthe period amounted to SEK 17,205m, as againstSEK19,364m atthe start ofthe year. Dividend to shareholders for2017 amounted to SEK2,385m, whereof SEK1,193m has been paid during the second quarterand SEK 1,193m has been reported as current liability. The income statement and balance sheetforthe ParentCompanyare presented on page 22. The report has not been audited or reviewed by external auditors. Stockholm, October 26, 2018 AB Electrolux (publ) 556009-4178 Jonas Samuelson President and CEO
- 14. 14 | AB ELECTROLUX INTERIM REPORT Q3 2018 Consolidated statement of comprehensive income SEKm Q3 2018 Q3 2017 Nine months 2018 Nine months 2017 Full year2017 Net sales 30,444 29,042 89,703 88,191 120,771 Cost ofgoods sold -24,633 -22,911 -73,072 -69,393 -95,222 Gross operating income 5,811 6,130 16,632 18,797 25,549 Selling expenses -3,159 -2,926 -9,357 -9,491 -12,897 Administrative expenses -1,180 -1,285 -3,812 -4,104 -5,550 Otheroperating income/expenses 283 61 -116 139 305 Operating income 1,756 1,981 3,347 5,342 7,407 Financial items, net -121 -86 -292 -377 -441 Income after financial items 1,634 1,895 3,055 4,965 6,966 Taxes -472 -455 -824 -1,222 -1,221 Income forthe period 1,162 1,440 2,230 3,743 5,745 Items that will not be reclassified to income forthe period: Remeasurement of provisions forpost-employment benefits 101 178 401 981 1,229 Income tax relating to items that will not be reclassified -24 -29 -95 -270 -440 77 149 305 711 789 Items that may be reclassified subsequentlyto income forthe period: Available-for-sale instruments — — — — 1 Cash flow hedges -18 3 -34 85 95 Exchange-rate differences on translation offoreign operations -670 -590 197 -1,420 -1,224 Income tax relating to items that may be reclassified 8 -4 3 -4 -17 -680 -591 166 -1,339 -1,145 Othercomprehensive income, net of tax -603 -442 471 -628 -356 Total comprehensive income forthe period 560 998 2,702 3,115 5,389 Income forthe period attributable to: Equity holders ofthe ParentCompany 1,162 1,441 2,230 3,743 5,745 Non-controlling interests 0 0 0 0 0 Total 1,162 1,440 2,230 3,743 5,745 Total comprehensive income forthe period attributable to: Equity holders ofthe ParentCompany 560 998 2,701 3,117 5,390 Non-controlling interests 0 0 0 -2 -1 Total 560 998 2,702 3,115 5,389 Earnings per share Basic, SEK 4.04 5.01 7.76 13.02 19.99 Diluted, SEK 4.01 4.99 7.70 12.96 19.88 Average numberof shares1) Basic, million 287.4 287.4 287.4 287.4 287.4 Diluted, million 289.7 289.1 289.6 288.9 289.0 1) Average numbers of shares excluding shares held by Electrolux.
- 15. 15 | AB ELECTROLUX INTERIM REPORT Q3 2018 Consolidated balance sheet SEKm Sep. 30, 2018 Sep. 30, 2017 Dec. 31, 2017 Assets Property, plant and equipment 19,820 18,152 19,192 Goodwill 7,949 7,447 7,628 Otherintangible assets 3,779 3,500 3,741 Investments in associates 382 219 337 Deferred taxassets 5,917 5,433 5,712 Financial assets 243 188 212 Pension plan assets 394 332 455 Othernon-current assets 922 503 459 Total non-current assets 39,406 35,774 37,736 Inventories 18,395 16,399 14,655 Trade receivables 19,702 18,955 20,747 Taxassets 515 623 830 Derivatives 95 187 87 Othercurrent assets 4,097 5,414 3,839 Short-term investments 178 160 358 Cash and cash equivalents 10,874 11,084 11,289 Total current assets 53,856 52,822 51,806 Total assets 93,262 88,596 89,542 Equity and liabilities Equity attributable to equity holders of the Parent Company Share capital 1,545 1,545 1,545 Otherpaid-in capital 2,905 2,905 2,905 Otherreserves -2,449 -2,807 -2,615 Retained earnings 18,674 16,514 18,630 Equity attributable to equity holders of the Parent Company 20,674 18,157 20,465 Non-controlling interests 12 22 14 Total equity 20,686 18,179 20,480 Long-term borrowings 7,301 6,914 6,587 Deferred tax liabilities 818 836 730 Provisions forpost-employment benefits 2,987 3,096 3,089 Otherprovisions 5,451 6,028 5,753 Total non-current liabilities 16,557 16,873 16,159 Accounts payable 32,216 30,200 31,114 Tax liabilities 690 586 924 Dividend payable 1,193 1,078 — Otherliabilities 15,848 16,649 15,849 Short-term borrowings 2,846 2,814 2,695 Derivatives 189 63 251 Otherprovisions 3,038 2,153 2,070 Total current liabilities 56,019 53,543 52,903 Total equity and liabilities 93,262 88,596 89,542 Change in consolidated equity SEKm Sep. 30, 2018 Sep. 30, 2017 Full year2017 Opening balance 20,480 17,738 17,738 Change in accounting principles -18 -126 -126 Total comprehensive income forthe period 2,702 3,115 5,389 Share-based payments -90 -389 -356 Dividend to equity holders ofthe ParentCompany -2,385 -2,155 -2,155 Dividend to non-controlling interests 0 0 0 Acquisition of non-controlling interests -3 -4 -11 Total transactions with equity holders -2,478 -2,548 -2,522 Closing balance 20,686 18,179 20,480
- 16. 16 | AB ELECTROLUX INTERIM REPORT Q3 2018 Consolidated cash flow statement SEKm Q3 2018 Q3 2017 Nine months 2018 Nine months 2017 Full year2017 Operations Operating income 1,756 1,981 3,347 5,342 7,407 Depreciation and amortization 1,009 974 3,067 2,964 3,977 Othernon-cash items -144 -53 1,180 78 21 Financial items paid, net1) -124 -39 -193 -170 -227 Taxes paid -160 -421 -675 -976 -1,421 Cash flow from operations, excluding change in operating assets and liabilities 2,337 2,442 6,725 7,238 9,757 Change in operating assets and liabilities Change in inventories -1,197 -1,317 -3,462 -3,081 -1,377 Change in trade receivables 1 -431 1,076 -797 -1,992 Change in accounts payable 298 998 263 3,068 3,418 Change in otheroperating assets, liabilities and provisions 1,230 1,334 -1,393 -79 218 Cash flow from change in operating assets and liabilities 331 584 -3,516 -889 267 Cash flow from operations 2,668 3,026 3,208 6,349 10,024 Investments Acquisitions ofoperations -1 -96 -431 -3,394 -3,405 Divestments ofoperations 285 — 285 — — Capital expenditure in property, plant and equipment -1,135 -952 -2,544 -2,201 -3,892 Capital expenditure in productdevelopment -112 -101 -297 -270 -418 Capital expenditure in software -137 -82 -366 -228 -369 Other -216 -64 -383 3 -116 Cash flow from investments -1,316 -1,295 -3,737 -6,090 -8,200 Cash flow from operations and investments 1,352 1,731 -528 259 1,824 Financing Change in short-term investments -58 -7 189 745 539 Change in short-term borrowings 506 -372 622 -771 -386 New long-term borrowings 75 350 1,735 1,002 1,002 Amortization of long-term borrowings -81 -752 -1,154 -1,192 -1,695 Dividend — — -1,193 -1,078 -2,155 Share-based payments — — -218 -488 -483 Cash flow from financing 442 -781 -18 -1,782 -3,178 Total cash flow 1,794 950 -547 -1,523 -1,354 Cash and cash equivalents at beginning of period 9,207 10,079 11,289 12,756 12,756 Exchange-rate differences referring to cash and cash equivalents -127 55 132 -149 -113 Cash and cash equivalents at end of period 10,874 11,084 10,874 11,084 11,289 1) Forthe periodJanuary1 to September30, 2018: interests and similaritems received SEK 97m (160), interests and similaritems paid SEK-302m (–254) and otherfinancial items paid/received SEK12m (–76).
- 17. 17 | AB ELECTROLUX INTERIM REPORT Q3 2018 Key ratios SEKm unless otherwise stated Q3 2018 Q3 2017 Nine months 2018 Nine months 2017 Full year2017 Net sales 30,444 29,042 89,703 88,191 120,771 Organic growth, % 0.8 -3.2 0.9 -2.0 -0.4 EBITA 1,991 2,219 4,077 6,037 8,327 EBITAmargin, % 6.5 7.6 4.5 6.8 6.9 Operating income 1,756 1,981 3,347 5,342 7,407 Operating margin, % 5.8 6.8 3.7 6.1 6.1 Operating margin excl. non-recurring items, %1) 5.8 6.8 5.3 6.1 6.1 Income afterfinancial items 1,634 1,895 3,055 4,965 6,966 Income forthe period 1,162 1,440 2,230 3,743 5,745 Capital expenditure, property, plant and equipment -1,135 -952 -2,544 -2,201 -3,892 Operating cash flow afterinvestments 1,352 2,287 486 4,799 6,877 Earnings pershare, SEK2) 4.04 5.01 7.76 13.02 19.99 Equity pershare, SEK 71.98 63.26 71.98 63.26 71.26 Capital-turnoverrate, times/year — — 5.1 5.7 5.9 Return on net assets, % — — 19.1 34.7 36.0 Return on equity, % — — 14.3 28.7 31.9 Netdebt 1,601 913 1,601 913 197 Netdebt/equity ratio 0.08 0.05 0.08 0.05 0.01 Average numberof shares excluding shares owned by Electrolux, million 287.4 287.4 287.4 287.4 287.4 Average numberof employees 54,274 56,186 54,810 55,097 55,692 1) Non-recurring items ofSEK-1,414m in the first nine months of2018 include SEK-596m in MajorAppliances NorthAmerica in the firstquarterand SEK-818m in MajorAppli- ances EMEA in the second quarter. Forinformation on non-recurring items, see page 19. 2) Basic. Fordefinitions, see pages 27-28. Shares Numberof shares A–shares B–shares Shares, total Shares held by Electrolux Shares held byother shareholders Numberof shares as ofJanuary 1, 2018 8,192,539 300,727,769 308,920,308 21,522,858 287,397,450 Numberof shares as of September 30, 2018 8,192,539 300,727,769 308,920,308 21,522,858 287,397,450 As % oftotal numberof shares 7.0% Exchange rates SEK Sep. 30, 2018 Sep. 30, 2017 Dec. 31, 2017 Exchange rate Average End of period Average End of period Average End of period ARS 0.3305 0.2178 0.5301 0.4719 0.5176 0.4729 AUD 6.50 6.42 6.57 6.40 6.53 6.41 BRL 2.39 2.22 2.70 2.58 2.66 2.48 CAD 6.68 6.84 6.58 6.57 6.57 6.55 CHF 8.84 9.11 8.74 8.42 8.67 8.41 CLP 0.0137 0.0135 0.0131 0.0128 0.0131 0.0134 CNY 1.31 1.29 1.26 1.23 1.26 1.26 EUR 10.24 10.31 9.58 9.65 9.64 9.84 GBP 11.58 11.62 10.99 10.94 11.03 11.09 HUF 0.0322 0.0318 0.0310 0.0311 0.0312 0.0317 MXN 0.4515 0.4733 0.4545 0.4496 0.4499 0.4160 RUB 0.1405 0.1354 0.1473 0.1414 0.1463 0.1419 THB 0.2669 0.2753 0.2512 0.2453 0.2517 0.2516 USD 8.59 8.91 8.61 8.17 8.54 8.21
- 18. 18 | AB ELECTROLUX INTERIM REPORT Q3 2018 Net sales and operating income by business area SEKm Q1 2018 Q2 2018 Q3 2018 Q4 2018 Full year 2018 Q1 2017 Q2 2017 Q3 2017 Q4 2017 Full year 2017 MajorAppliances Europe, Middle East andAfrica Net sales 9,640 10,167 10,749 8,539 9,304 9,465 11,214 38,524 Sales growth, % 10.1 4.4 6.3 -1.8 4.3 1.4 6.6 2.7 EBITA 678 -143 851 551 636 830 1,048 3,065 EBITAmargin, % 7.0 -1.4 7.9 6.5 6.8 8.8 9.3 8.0 Operating income 602 -214 792 474 561 761 969 2,764 Operating margin, % 6.2 -2.1 7.4 5.6 6.0 8.0 8.6 7.2 MajorAppliances NorthAmerica Net sales 8,564 10,549 9,949 9,850 11,699 9,544 9,563 40,656 Sales growth, % -5.1 -9.7 -3.9 -7.0 -2.4 -10.8 -4.2 -6.1 EBITA -147 634 368 628 1,009 742 467 2,847 EBITAmargin, % -1.7 6.0 3.7 6.4 8.6 7.8 4.9 7.0 Operating income -167 612 347 605 987 719 447 2,757 Operating margin, % -1.9 5.8 3.5 6.1 8.4 7.5 4.7 6.8 MajorAppliances LatinAmerica Net sales 4,064 4,274 3,640 4,301 3,857 4,132 5,012 17,302 Sales growth, % 6.4 20.7 0.5 -2.5 -2.5 7.4 29.9 7.9 EBITA 92 0 252 155 74 125 272 626 EBITAmargin, % 2.3 0.0 6.9 3.6 1.9 3.0 5.4 3.6 Operating income 34 -56 200 101 29 77 218 425 Operating margin, % 0.8 -1.3 5.5 2.4 0.8 1.9 4.3 2.5 MajorAppliancesAsia/Pacific Net sales 2,055 2,317 2,238 2,010 2,232 2,081 2,437 8,759 Sales growth, % 7.6 2.8 3.8 9.4 7.8 -1.1 9.9 6.3 EBITA 141 204 191 123 220 226 227 796 EBITAmargin, % 6.9 8.8 8.6 6.1 9.9 10.9 9.3 9.1 Operating income 127 187 174 112 209 214 215 750 Operating margin, % 6.2 8.1 7.8 5.6 9.4 10.3 8.8 8.6 Home Care SDA Net sales 1,665 1,838 1,733 1,759 1,857 1,922 2,269 7,808 Sales growth, % -3.8 -2.6 -13.6 -12.5 -3.3 -1.1 -6.0 -5.8 EBITA 92 89 97 70 94 114 240 518 EBITAmargin, % 5.5 4.8 5.6 4.0 5.1 5.9 10.6 6.6 Operating income 64 60 69 60 69 89 214 431 Operating margin, % 3.8 3.3 4.0 3.4 3.7 4.6 9.4 5.5 Professional Products Net sales 1,917 2,209 2,135 1,742 1,999 1,897 2,085 7,723 Sales growth, % 8.5 6.7 6.7 8.0 14.6 17.9 9.1 12.2 EBITA 245 331 293 250 268 286 288 1,092 EBITAmargin,% 12.8 15.0 13.7 14.3 13.4 15.1 13.8 14.1 Operating income 237 324 280 249 258 272 276 1,054 Operating margin, % 12.4 14.7 13.1 14.3 12.9 14.3 13.2 13.7 Common Group costs, etc. -133 -86 -107 -159 -194 -150 -273 -775 Total Group Net sales 27,906 31,354 30,444 28,201 30,948 29,042 32,580 120,771 Sales growth, % 3.3 0.7 0.7 -3.2 1.2 -1.7 5.4 0.5 EBITA 1,011 1,075 1,991 1,666 2,152 2,219 2,290 8,327 EBITAmargin, % 3.6 3.4 6.5 5.9 7.0 7.6 7.0 6.9 Operating income 764 827 1,756 1,442 1,919 1,981 2,065 7,407 Operating margin, % 2.7 2.6 5.8 5.1 6.2 6.8 6.3 6.1 Income afterfinancial items 672 748 1,634 1,340 1,730 1,895 2,001 6,966 Income forthe period 551 517 1,162 1,012 1,291 1,440 2,002 5,745 Earnings pershare, SEK1) 1.92 1.80 4.04 3.52 4.49 5.01 6.97 19.99 1) Basic, based on average numberof shares excluding shares held by Electrolux.
- 19. 19 | AB ELECTROLUX INTERIM REPORT Q3 2018 SEKm Q1 20181) Q2 20182) Q3 2018 Q4 2018 Full year 2018 Q1 2017 Q2 2017 Q3 2017 Q4 2017 Full year 2017 MajorAppliances Europe, Middle East andAfrica — -818 — — — — — — MajorAppliances NorthAmerica -596 — — — — — — — MajorAppliances LatinAmerica — — — — — — — — MajorAppliancesAsia/Pacific — — — — — — — — Home Care SDA — — — — — — — — Professional Products — — — — — — — — Common Group costs, etc. — — — — — — — — Total Group -596 -818 — — — — — — 1) The non-recurring item ofSEK-596m in the firstquarterof2018 refers to the consolidation offreezerproduction in NorthAmerica.The cost is included in Cost ofgoods sold and consists of write down of fixed assets and provision forseverance cost and othercost related to the project. 2) The non-recurring items ofSEK-818m in the second quarterof2018 referto MajorAppliances EMEA.These include a provision ofSEK564m fora fine relating to an inves- tigation bythe French CompetitionAuthority and a provision ofSEK254m relating to an unfavourable court ruling in France.These costs are included in otheroperating income/expenses. Non-recurring items by business area SEKm Q1 2018 Q2 2018 Q3 2018 Q4 2018 Full year 2018 Q1 2017 Q2 2017 Q3 2017 Q4 2017 Full year 2017 MajorAppliances Europe, Middle East andAfrica Operating income excl. non-recurring items 602 604 792 474 561 761 969 2,764 Operating margin excl. non-recurring items, % 6.2 5.9 7.4 5.6 6.0 8.0 8.6 7.2 MajorAppliances NorthAmerica Operating income excl. non-recurring items 429 612 347 605 987 719 447 2,757 Operating margin excl. non-recurring items, % 5.0 5.8 3.5 6.1 8.4 7.5 4.7 6.8 Total Group Operating income excl. non-recurring items 1,360 1,645 1,756 1,442 1,919 1,981 2,065 7,407 Operating margin excl. non-recurring items, % 4.9 5.2 5.8 5.1 6.2 6.8 6.3 6.1 Operating income excl. non-recurring items
- 20. 20 | AB ELECTROLUX INTERIM REPORT Q3 2018 Net sales by business area SEKm Q3 2018 Q3 2017 Nine months 2018 Nine months 2017 Full year2017 MajorAppliances Europe, Middle East andAfrica 10,749 9,465 30,556 27,310 38,524 MajorAppliances NorthAmerica 9,949 9,544 29,062 31,093 40,656 MajorAppliances LatinAmerica 3,640 4,132 11,978 12,290 17,302 MajorAppliancesAsia/Pacific 2,238 2,081 6,610 6,322 8,759 Home Care SDA 1,733 1,922 5,236 5,538 7,808 Professional Products 2,135 1,897 6,261 5,638 7,723 Total 30,444 29,042 89,703 88,191 120,771 Change in net sales by business area Year–over–year, % Q3 2018 Q3 2018 In local currencies Nine months 2018 Nine months 2018 In local currencies MajorAppliances Europe, Middle East andAfrica 14 6 12 7 MajorAppliances NorthAmerica 4 -4 -7 -6 MajorAppliances LatinAmerica -12 1 -3 9 MajorAppliancesAsia/Pacific 8 4 5 5 Home Care SDA -10 -14 -5 -7 Professional Products 13 7 11 7 Total change 5 1 2 1 Operating income by business area SEKm Q3 2018 Q3 2017 Nine months 2018 Nine months 2017 Full year2017 MajorAppliances Europe, Middle East andAfrica 792 761 1,181 1,795 2,764 Margin, % 7.4 8.0 3.9 6.6 7.2 MajorAppliances NorthAmerica 347 719 792 2,310 2,757 Margin, % 3.5 7.5 2.7 7.4 6.8 MajorAppliances LatinAmerica 200 77 178 207 425 Margin, % 5.5 1.9 1.5 1.7 2.5 MajorAppliancesAsia/Pacific 174 214 489 535 750 Margin, % 7.8 10.3 7.4 8.5 8.6 Home Care SDA 69 89 193 218 431 Margin, % 4.0 4.6 3.7 3.9 5.5 Professional Products 280 272 841 779 1,054 Margin, % 13.1 14.3 13.4 13.8 13.7 Common Group costs, etc. -107 -150 -326 -503 -775 Operating income 1,756 1,981 3,347 5,342 7,407 Margin, % 5.8 6.8 3.7 6.1 6.1 Change in operating income by business area Year–over–year, % Q3 2018 Q3 2018 In local currencies Nine months 2018 Nine months 2018 In local currencies MajorAppliances Europe, Middle East andAfrica 4 -2 -34 -37 MajorAppliances NorthAmerica -52 -55 -66 -66 MajorAppliances LatinAmerica 163 252 -14 22 MajorAppliancesAsia/Pacific -19 -22 -9 -10 Home Care SDA -22 -17 -12 -6 Professional Products 3 -3 8 3 Total change -11 -15 -37 -38
- 21. 21 | AB ELECTROLUX INTERIM REPORT Q3 2018 Net assets by business area Assets Equityand liabilities Net assets SEKm Sep. 30, 2018 Sep. 30, 2017 Dec. 31, 2017 Sep. 30, 2018 Sep. 30, 2017 Dec. 31, 2017 Sep. 30, 2018 Sep. 30, 2017 Dec. 31, 2017 MajorAppliances Europe, Middle East andAfrica 26,834 24,362 25,575 22,884 20,505 22,037 3,950 3,857 3,538 MajorAppliances NorthAmerica 17,537 15,469 14,840 14,689 13,761 12,723 2,848 1,708 2,117 MajorAppliances LatinAmerica 11,479 13,439 12,602 5,791 7,958 6,752 5,688 5,481 5,850 MajorAppliancesAsia/Pacific 6,042 5,662 5,788 4,146 3,896 4,163 1,896 1,766 1,625 Home Care SDA 5,586 5,335 5,341 3,482 3,478 3,519 2,105 1,857 1,822 Professional Products 5,670 4,353 4,434 3,042 2,594 2,706 2,628 1,759 1,728 Other1) 8,347 7,973 8,533 3,981 4,231 4,535 4,366 3,742 3,998 Total operating assets and liabilities 81,495 76,594 77,113 58,015 56,424 56,436 23,480 20,170 20,678 Liquid funds 11,373 11,672 11,974 — — — — — — Total borrowings — — — 10,381 9,821 9,537 — — — Pension assets and liabilities 394 332 455 2,987 3,096 3,089 — — — Dividend payable — — — 1,193 1,078 — — — — Equity — — — 20,686 18,179 20,480 — — — Total 93,262 88,596 89,542 93,262 88,596 89,542 — — — 1) Includes common functions and tax items. Working capital and net assets SEKm Sep. 30, 2018 % of annualized net sales Sep. 30, 2017 % of annualized net sales Dec. 31, 2017 % of annualized net sales Inventories 18,395 15.3 16,399 14.4 14,655 12.4 Trade receivables 19,702 16.4 18,956 16.6 20,747 17.5 Accounts payable -32,216 -26.8 -30,200 -26.4 -31,114 -26,3 Operating working capital 5,881 4.9 5,155 4.5 4,288 3.6 Provisions -8,489 -8,181 -7,823 Prepaid and accrued income and expenses -11,441 -10,716 -11,038 Taxes and otherassets and liabilities -665 -694 -1,300 Working capital -14,714 -12.2 -14,436 -12.6 -15,873 -13.4 Property, plant and equipment 19,820 18,152 19,192 Goodwill 7,949 7,447 7,628 Othernon-current assets 5,326 4,410 4,749 Deferred taxassets and liabilities 5,099 4,597 4,981 Net assets 23,480 19.5 20,170 17.7 20,678 17.5 Annualized net sales, calculated at end of period exchange rates 120,139 114,182 118,464 Average net assets 23,333 19.5 20,546 17.5 20,572 17.0 Annualized net sales, calculated at average exchange rates 119,602 117,585 120,771
- 22. 22 | AB ELECTROLUX INTERIM REPORT Q3 2018 Parent Company income statement SEKm Q3 2018 Q3 2017 Nine months 2018 Nine months 2017 Full year2017 Net sales 9,675 8,575 27,843 25,270 35,168 Cost ofgoods sold -8,505 -7,283 -23,963 -21,449 -30,034 Gross operating income 1,170 1,292 3,880 3,821 5,134 Selling expenses -828 -705 -2,307 -2,138 -2,967 Administrative expenses -299 -531 -1,244 -1,526 -1,795 Otheroperating income 0 0 0 0 1 Otheroperating expenses 0 0 -565 0 -105 Operating income 43 56 -236 157 268 Financial income 1,757 2,925 2,999 5,218 7,142 Financial expenses -162 -192 -493 -735 -855 Financial items, net 1,595 2,733 2,506 4,483 6,287 Income after financial items 1,638 2,789 2,270 4,640 6,555 Appropriations 81 62 -1,802 171 182 Income before taxes 1,719 2,851 468 4,811 6,737 Taxes -84 -60 170 -140 -201 Income forthe period 1,635 2,791 638 4,671 6,536 Parent Company balance sheet SEKm Sep. 30, 2018 Sep. 30, 2017 Dec. 31, 2017 Assets Non–current assets 36,846 35,221 35,596 Current assets 29,373 26,632 28,267 Total assets 66,219 61,853 63,863 Equity and liabilities Restricted equity 5,401 4,940 5,068 Non–restricted equity 17,205 17,539 19,364 Total equity 22,606 22,479 24,432 Untaxed reserves 447 379 444 Provisions 1,746 1,373 1,229 Non–current liabilities 6,824 6,499 6,181 Current liabilities 34,596 31,123 31,577 Total equity and liabilities 66,219 61,853 63,863
- 23. 23 | AB ELECTROLUX INTERIM REPORT Q3 2018 Notes Note 1 Accounting principles Electroluxapplies International Financial Reporting Standards (IFRS) as adopted bythe European Union.This report has been prepared in accordance with IAS 34, Interim Financial Reporting,ÅRL(the SwedishAnnualAccountsAct) and RFR 2 ‘Accounting forlegal entities’ issued bythe Swedish Financial Reporting Board. Electrolux interim reports contain a condensed set of financial statements. Forthe Group this chiefly means thatthe disclosures are limited compared to the consolidated financial statements presented in the annual report. Forthe ParentCompanythis means thatthe financial statements in general are presented in condensed versions and with limited disclosures compared to the annual report. The Group’s accounting principles are described in Note 1 in theAnnual Report 2017, including transition effects and accounting principles related to IFRS 15 Revenue from Contracts with Customers and IFRS 9 Financial Instruments, which are applied by ElectroluxfromJanuary 1, 2018. Changes have been made to the 2017 restatementforIFRS 15 presented in theAnnual Report 2017. The changes only impacttrade receivables, accounts payable and othercurrent liabilities in the balance sheet. Preparations for new accounting standards During 2018, Electrolux preparatory work related to new accounting standards to be applied after2018 concerns IFRS 16 Leases. Work is ongoing in assessing the full impact of IFRS 16 as well as designing processes and implementing a system solution to fulfill the reporting requirements. Note 2 Disaggregation of revenue Electrolux manufactures and sells appliances mainly in the wholesale marketto customers being retailers. Electrolux products include refrigerators, dishwashers, washing machines, cookers, vacuum cleaners, airconditioners and small domestic appliances. MajorAppliances and Home Care SDAfocus on the consumermarket and Professional Products on professional users. Sales of products are revenue recognized at a point in time, when control ofthe products has transferred. Revenue from services related to installation of products, repairs ormaintenance service is recognized when control is transferred being overthe time the service is provided. Sales of services are not material in relation to Electroluxtotal net sales. Product and geographyare considered important attributes when disaggregating Electrolux revenue.Therefore, the table below presents net sales related to MajorAppliances, Home Care SDAand Professional Products pergeographical region. Nine months 2018 Nine months 2017 SEKM Major Appliances Home Care SDA Professional Products Total Major Appliances Home Care SDA Professional Products Total Geographical region Europe, Middle East andAfrica 30 556 2 643 5 021 38 221 27 310 2 529 4 454 34 293 NorthAmerica 29 062 599 619 30 281 31 093 999 584 32 676 LatinAmerica 11 978 632 — 12 610 12 290 702 — 12 992 Asia Pacific 6 610 1 362 621 8 592 6 322 1 309 600 8 230 Total 78 206 5 236 6 261 89 703 77 014 5 538 5 638 88 191 Note 3 Fair values and carrying amounts of financial assets and liabilities Sep. 30, 2018 Sep. 30, 2017 Dec. 31, 2017 SEKm Fairvalue Carrying amount Fairvalue Carrying amount Fairvalue Carrying amount Percategory Financial assets atfairvalue through profit and loss 73 73 — — — — Financial assets atfairvalue through OCI — — — — — — Financial assets measured at amortized cost, Hold to collect 31,014 31,014 — — — — Financial assets atfairvalue through profit and loss (IAS 39) — — 4,727 4,727 3,305 3,305 Available forsale (IAS 39)1) — — 19 19 20 20 Loans and receivables (IAS 39) — — 22,261 22,261 23,858 23,858 Cash — — 4,290 4,290 5,707 5,707 Total financial assets 31,087 31,087 31,297 31,297 32,890 32,890 Financial liabilities atfairvalue through profit and loss 166 166 63 63 251 251 Financial liabilities measured at amortized cost 42,214 42,144 40,230 40,127 40,432 40,350 Total financial liabilities 42,380 42,310 40,293 40,190 40,683 40,601 1) Atthe transition to IFRS 9 the financial instrument classified asAvailable forsale was reclassified to Financial assets atfairvalue through profit and loss. The Group strives forarranging master-netting agreements (ISDA) with the counterparts forderivative transactions and has established such agreements with the majorityof the counterparties, i.e., ifa counterparty will default, assets and liabilities will be netted. Derivatives are presented gross in the balance sheet.
- 24. 24 | AB ELECTROLUX INTERIM REPORT Q3 2018 Note 3 Fair values and carrying amounts of financial assets and liabilities (continued) Fairvalue estimation Valuation of financial instruments atfairvalue is done atthe most accurate market prices available. Instruments which are quoted on the market, e.g., the majorbond and interest-rate future markets, are all marked-to-market with the current price.The foreign-exchange spot rate is used to convert the value into SEK. Forinstruments where no reliable price is available on the market, cash-flows are discounted using the deposit/swap curve ofthe cash flow currency. If no propercash-flow schedule is available, e.g., as in the case with forward-rate agreements, the underlying schedule is used for valuation purposes. To the extent option instruments are used, the valuation is based on the BlackScholes’ formula.The carrying value less impairment provision of trade receivables and payables are assumed to approximate theirfairvalues.The fairvalue of financial liabilities is estimated bydiscounting the future contractual cash flows atthe current market-interest rate forsimilarfinancial instruments.The Group’s financial assets and liabilities are measured according to the following hierarchy: Level 1: Quoted prices in active markets foridentical assets orliabilities.AtSeptember30, 2018, the fairvalue forLevel 1 financial assets was SEK 1,964m (4,559) and forfinancial liabilities SEK 0m (0). Level 2: Inputs otherthan quoted prices included in Level 1 that are observable forassets orliabilities eitherdirectlyorindirectly.AtSeptember30, 2018, the fairvalue of Level 2 financial assets was SEK 73m (187) and financial liabilities SEK 166m (63). Level 3: Inputs forthe assets orliabilities that are not entirely based on observable marketdata. Electrolux has no financial assets orliabilities qualify- ing forLevel 3. Note 4 Pledged assets and contingent liabilities SEKm Sep. 30, 2018 Sep. 30, 2017 Dec. 31, 2017 Group Pledged assets 6 6 6 Contingent liabilities 1,162 1,283 1,187 Parent Company Pledged assets — — — Contingent liabilities 1,544 1,608 1,497 Formore information on contingent liabilities, see Note 25 in theAnnual Report 2017. Note 5 Acquisitions and divestments of operations Acquisitions in the first nine months of 2018 Acquisition of Schneidereit GmbH On February22, 2018 Electroluxcompleted the acquisition ofSchneidereitGmbH, a supplierof laundry rental solutions forprofessional customers in GermanyandAustria.The agreementto acquire the company was announced onJanuary22, 2018. The acquisition enables Electroluxto develop its offering within the professional laundry business and supports the long-term profitable growth in Europe. Schneidereit adds a complementary business model, enabling Electroluxto help provide great experiences to an even widercustomerbase while exploring functional sales which is an interesting growth area in the industryforprofessional products. Net sales forthe acquired business SchneidereitGmbH in 2016 amounted to around EUR 18 million (around SEK175 million) and the company has approximately 110 employees throughoutGermany. The consideration consists ofa cash payment of EUR 32.8m and a deferred part of EUR 3.6m.The cash payment is equivalentto SEK331m and a cash flow effect ofSEK-303m excluding acquired cash and cash equivalents. The acquired business is included in Electroluxconsolidated accounts perSeptember30 with financial statements forthe periodJanuary-June 2018, contributing to net sales and operating income (including amortization of surplus values) by EUR 9.3m and EUR 54k respectively, approximatelySEK 96m and SEK0,5m respectively. The operations are included in business area Professional Products. Transaction costs Transaction costs related to the acquisition described above amountto SEK6m and have been expensed as incurred during the acquisition process in 2017 (SEK4m) and 2018 (SEK2m).The costs have been reported in the business area’s operating income. Cash flow related to acquisitions of operations In addition to the consideration paid forSchneidereitGmbH ofSEK303m, the cash flow related to acquisitions includes a payment ofa deferred consideration ofSEK125m related to the Kwikot acquisition in 2017 and acquisition of minority shares ofSEK3m.Total cash flow related to acquisitions of operations amounts to SEK-431m.
- 25. 25 | AB ELECTROLUX INTERIM REPORT Q3 2018 Divestments in the first nine months of 2018 Divestments of Beam and Sanitaire in North America OnAugust 8, 2018 Electroluxannounced the divestments of its U.S.-based commercial and central vacuum cleanerbusinesses in NorthAmerica, including the brands Sanitaire and BEAM.Total gross consideration was USD 37m (SEK316m) resulting in a capital gain of USD23m (SEK196m) and a cash flow effect of USD 33m (SEK285).Transaction costs incurred amountto SEK17m. Furthermore, rationalization activities and additional asset write- downs triggered bythe divestments amountto USD 14m (SEK115m) and have been recognized in the income statement.The divested operations had combined revenues in 2017 ofaround USD 70 m. The divestments and the related effects are included in business area Home Care Small DomesticAppliances. Acquisition after the third quarter 2018 Acquisition of SPM Drink Systems On October2, 2018 Electroluxannounced the acquisition ofSPM DrinkSystems, an Italian leading manufacturerof professional dispensers offrozen and hot beverages and soft ice-cream.The acquired operations had combined net sales in 2017 ofapproximately EUR 30 million, and 110 employees. The company’s headquarters and main manufacturing facilities are based in Spilamberto, Modena, Italy. The consideration consists ofa cash payment of EUR 45.8m, appoximatelySEK472m.Transaction costs incurred amountto SEK3m. The operations will be included in business area Professional Products.
- 26. 26 | AB ELECTROLUX INTERIM REPORT Q3 2018 Operations by business area yearly SEKm 2013 2014 2015 2016 20171) MajorAppliances Europe, Middle East andAfrica Net sales 33,436 34,438 37,179 37,844 38,524 Operating income –481 232 2,167 2,546 2,764 Margin, % –1.4 0.7 5.8 6.7 7.2 MajorAppliances NorthAmerica Net sales 31,864 34,141 43,053 43,402 40,656 Operating income 2,136 1,714 1,580 2,671 2,757 Margin, % 6.7 5.0 3.7 6.2 6.8 MajorAppliances LatinAmerica Net sales 20,695 20,041 18,546 15,419 17,302 Operating income 979 1,069 463 -68 425 Margin, % 4.7 5.3 2.5 -0.4 2.5 MajorAppliancesAsia/Pacific Net sales 8,653 8,803 9,229 9,380 8,759 Operating income 116 438 364 626 750 Margin, % 1.3 5.0 3.9 6.7 8.6 Home Care SDA Net sales 8,952 8,678 8,958 8,183 7,808 Operating income 309 200 –63 238 431 Margin, % 3.5 2.3 –0.7 2.9 5.5 Professional Products Net sales 5,550 6,041 6,546 6,865 7,723 Operating income 510 671 862 954 1,054 Margin, % 9.2 11.1 13.2 13.9 13.7 Other Net sales 1 1 — — — Common Group cost, etc. –1,989 –743 –2,632 -693 -775 Total Group Net sales 109,151 112,143 123,511 121,093 120,771 Operating income 1,580 3,581 2,741 6,274 7,407 Margin, % 1.4 3.2 2.2 5.2 6.1 1) 2017 is restated due to IFRS15. Non-recurring items in operating income1) 2013 2014 2015 2016 2017 MajorAppliances Europe, Middle East andAfrica –828 –1,212 — — — MajorAppliances NorthAmerica — –392) –1582) — — MajorAppliances LatinAmerica — –10 — — — MajorAppliancesAsia/Pacific –351 –10 — — — Home Care SDA –82 — –190 — — Professional Products — — — — — Common Group cost –1,214 –772) –1,9012) — — Total Group –2,475 –1,348 –2,249 — — 1) Formore information, see Note 7 in the annual reports. 2) Refers to costs related to the not completed acquisition ofGEAppliances. Costs forpreparatory integration workofSEK 39m for2014 and SEK 158m for2015 have been charged to operating income forMajorAppliances NorthAmerica. Common Group cost includes transaction costs ofSEK 110m for2014 and SEK 408m for2015 and a termination fee paid toGeneral Electric in December2015 of USD 175m, corresponding to SEK 1,493m. In total, costs ofSEK 2,059m related toGEAppliances were charged to operating income in 2015 of which SEK 63m in the firstquarter, SEK 195m in the second quarter, SEK 142m in the third quarterand SEK 1,659m in the fourth quarter.
- 27. 27 | AB ELECTROLUX INTERIM REPORT Q3 2018 Five-year review SEKm unless otherwise stated 2013 2014 2015 2016 20171) Net sales 109,151 112,143 123,511 121,093 120,771 Organic growth, % 4.5 1.1 2.2 -1.1 -0.4 Operating income 1.580 3,581 2,741 6,274 7,407 Operating margin, % 1.4 3.2 2.2 5.2 6.1 Income afterfinancial items 904 2,997 2,101 5,581 6,966 Income forthe period 672 2,242 1,568 4,493 5,745 Non-recurring items2) –2,475 –1,348 -2,249 — — Capital expenditure, property, plant and equipment –3,535 –3,006 –3,027 -2,830 -3,892 Operating cash flow afterinvestments 2,412 6,631 6,745 9,140 6,877 Earnings pershare, SEK 2.35 7.83 5.45 15.64 19.99 Equity pershare, SEK 49.99 57.52 52.21 61.72 71.26 Dividend pershare, SEK 6.50 6.50 6.50 7.50 8.30 Capital-turnoverrate, times/year 4.0 4.5 5.0 5.8 5.9 Return on net assets, % 5.8 14.2 11.0 29.9 36.0 Return on equity, % 4.4 15.7 9.9 29.4 31.9 Netdebt 10,653 9,631 6,407 360 197 Netdebt/equity ratio 0.74 0.58 0.43 0.02 0.01 Average numberof shares excluding shares owned by Electrolux, million 286.2 286.3 287.1 287.4 287.4 Average numberof employees 60,754 60,038 58,265 55,400 55,692 1) 2017 is restaed due to IFRS15. 2) Formore information, see table on page 26 and Note 7 in the annual reports. Financial goals over a business cycle The financial goals set by Electrolux aim to strengthen the Group’s leading, global position in the industry and to assist in generating a healthytotal yield for Electrolux shareholders.The objective is growth with consistent profitability. Financial goals • Operating margin of at least 6% • Capital turnover-rate of at least 4 times • Return on net assets 20% • Average annual growth of at least 4% Definitions This report includes financial measures as required bythe financial reporting frameworkapplicable to Electrolux, which is based on IFRS. In addition, there are othermeasures and indicators that are used to follow-up, analyze and manage the business and to provide Electrolux stakeholders with useful financial information on the Group’s financial position, performance and development in a consistent way. On the following page is a list ofdefinitions ofall measures and indicators used, referred to and presented in this report. Computation of average amounts and annualized income statement measures In computation of key ratios where averages ofcapital balances are related to income statement measures, the average capital balances are based on the opening balance and all quarter-end closing balances included in the reporting period, and the income statement measures are annualized, translated at average rates forthe period. In computa- tion of key ratios where end-of-period capital balances are related to income statement measures, the latterare annualized, translated at end of-period exchange rates.Adjustments are made foracquired and divested operations.
- 28. 28 | AB ELECTROLUX INTERIM REPORT Q3 2018 Growth measures Change in net sales Current yearnet sales forthe period less previous yearnet sales forthe period as a percentage of previous yearnet sales forthe period. Sales growth Change in net sales adjusted forcurrencytranslation effects. Organic growth Change in net sales, adjusted forchanges in exchange rates, acquisitions and divestments. Acquisitions Change in net sales, adjusted fororganic growth, changes in exchange rates and divestments.The impactfrom acquisitions relates to net sales reported byacquired operations within 12 months afterthe acquisition date. Divestments Change in net sales, adjusted fororganic growth, changes in exchange rates and acquisitions.The impactfrom divestments relates to net sales reported bythe divested operations within 12 months before the divest- mentdate. Profitability measures EBITA Operating income excluding amortization of intangible assets. EBITA margin EBITAexpressed as a percentage of net sales. Operating margin (EBITmargin) Operating income (EBIT) expressed as a percentage of net sales. Operating margin (EBITmargin) excluding non-recurring items Operating income (EBIT) excluding non-recurring items, expressed as a percentage of net sales. Return on net assets Operating income (annualized) expressed as a percentage of average net assets. Return on equity Income forthe period (annualized) expressed as a percentage of average total equity. Capital measures Net debt/equity ratio Netdebt in relation to total equity. Equity/assets ratio Total equityas a percentage oftotal assets less liquid funds. Capital turnover-rate Net sales (annualized) divided byaverage net assets. Share-based measures Earnings per share, Basic Income forthe period attributable to equity holders ofthe Parent Companydivided bythe average numberof shares excluding shares held by Electrolux. Earnings pershare, Diluted Income forthe period attributable to equity holders ofthe ParentCom- panydivided bythe average numberof shares afterdilution, excluding shares held by Electrolux. Equity per share Total equitydivided bytotal numberof shares excluding shares held by Electrolux. Capital indicators Liquid funds Cash and cash equivalents, short-term investments, financial derivative assets1) and prepaid interest expenses and accrued interest income1). Operating working capital Inventories and trade receivables less accounts payable. Working capital Total current assets exclusive of liquid funds, less non-current otherprovi- sions and total current liabilities exclusive oftotal short-term borrowings. Net assets Total assets exclusive of liquid funds and pension plan assets, less deferred tax liabilities, non-current otherprovisions and total current liabilities exclusive oftotal short-term borrowings. Total borrowings Long-term borrowings and short-term borrowings, financial derivative liabilities1), accrued interest expenses and prepaid interest income1). Total short-term borrowings Short-term borrowings, financial derivative liabilities1), accrued interest expenses and prepaid interest income1). Interest-bearing liabilities Long-term borrowings and short-term borrowings exclusive of liabilities related to trade receivables with recourse1). Financial net debt Total borrowings less liquid funds. Net provision for post-employment benefits Provisions forpost-employment benefits less pension plan assets. Net debt Financial netdebt and net provision forpost-employment benefits. Other measures Operating cash flow after investments Cash flow from operations and investments adjusted forfinancial items paid, taxes paid and acquisitions/divestments ofoperations. Non-recurring items Material profit orloss items in operating income2) which are relevantfor understanding the financial performance when comparing income for the current period with previous periods. 1) See table Netdebt on page 9. 2) Formore information, see note 7 in theAnnual Report 2017. Definitions (continued)
- 29. 29 | AB ELECTROLUX INTERIM REPORT Q3 2018 Shareholders’ information President and CEOJonas Samuelson’s comments on the third quarter results 2018 Today’s press release is available on the Electrolux website www.electroluxgroup.com/ir Telephone conference 09.00 CET Atelephone conference is held at 09.00 CETtoday, October26.The conference will be chaired byJonas Samuelson, President and CEOof Electrolux. Mr. Samuelson will be accompanied by Therese Friberg, CFO. Details forparticipation bytelephone are as follows: Participants in Sweden should call +46 8 566 426 91 Participants in UK/Europe should call +44 203 008 9811 Participants in US should call +1 855 831 5945 Slide presentation fordownload: www.electroluxgroup.com/ir Linkto webcast: www.electroluxgroup.com/q3-2018 For further information, please contact: SophieArnius, Head of InvestorRelations +46 70 590 80 72 Merton Kaplan, IR manager +46 73 885 78 03 Calendar 2019 Consolidated results 2018 February 1 Capital Markets Day March 27 AGM April 10 Interim reportJanuary - March April 26 Interim reportJanuary -June July 18 Interim reportJanuary - September October25 AB Electrolux (publ), 556009-4178 Postal address: SE-105 45 Stockholm, Sweden Visiting address: S:tGöransgatan 143, Stockholm Telephone: +46 (0)8 738 60 00 Website: www.electroluxgroup.com This report contains “forward-looking” statements that reflect the company’s current expectations.Although the company believes that the expectations reflected in such forward-looking statements are reasonable, no assurance can be given that such expectations prove to have been correct as they are subject to risks and uncer- tainties that could cause actual results to differ materiallydue to a variety of factors.These factors include, but are not limited to, changes in consumerdemand, changes in economic, market and competitive conditions, currency fluctuations, developments in product liability litigation, changes in the regulatory environment and other government actions. Forward-looking statements speak only as of the date they were made, and, otherthan as required by applicable law, the company undertakes no obligation to update any of them in light of new information orfuture events.
- 30. Electrolux shapes living forthe betterby reinventing taste, care and wellbeing experiences, making life more enjoyable and sustainable formillions of people. As a leading global appliance company, we place the consumeratthe heart of everything we do.Through ourbrands, including Electrolux,AEG,Anova, Frigidaire,Westinghouse andZanussi, we sell more than 60 million household and professional products in more than 150 markets every year. In 2017, Electrolux had sales ofSEK 122 billion and employed 56,000 people around the world. For more information, go to www.electroluxgroup.com. Shape living forthe better