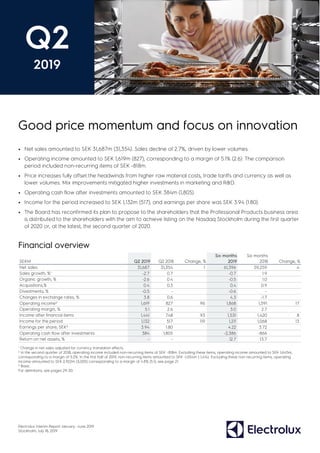
Electrolux Q2 interim report 2019: Good price momentum and focus on innovation

Highlights of the second quarter of 2019 Net sales amounted to SEK 31,687m (31,354). Sales decline of 2.7%, driven by lower volumes. Operating income amounted to SEK 1,619m (827), corresponding to a margin of 5.1% (2.6). The comparison period included non-recurring items of SEK -818m. Price increases fully offset the headwinds from higher raw material costs, trade tariffs and currency as well as lower volumes. Mix improvements mitigated higher investments in marketing and R&D. Operating cash flow after investments amounted to SEK 384m (1,805). Income for the period increased to SEK 1,132m (517), and earnings per share was SEK 3.94 (1.80). The Board has reconfirmed its plan to propose to the shareholders that the Professional Products business area is distributed to the shareholders with the aim to achieve listing on the Nasdaq Stockholm during the first quarter of 2020 or, at the latest, the second quarter of 2020.

Recommended
Recommended
More Related Content
What's hot
What's hot (20)
Similar to Electrolux Q2 interim report 2019: Good price momentum and focus on innovation
Similar to Electrolux Q2 interim report 2019: Good price momentum and focus on innovation (20)
More from Electrolux Group
More from Electrolux Group (11)
Recently uploaded
Recently uploaded (20)
Electrolux Q2 interim report 2019: Good price momentum and focus on innovation
- 1. Electrolux Interim Report January –June 2019 Stockholm, July 18, 2019 Good price momentum and focus on innovation • Net sales amounted to SEK 31,687m (31,354). Sales decline of 2.7%, driven by lower volumes. • Operating income amounted to SEK 1,619m (827), corresponding to a margin of 5.1% (2.6). The comparison period included non-recurring items of SEK -818m. • Price increases fully offset the headwinds from higher raw material costs, trade tariffs and currency as well as lower volumes. Mix improvements mitigated higher investments in marketing and R&D. • Operating cash flow after investments amounted to SEK 384m (1,805). • Income for the period increased to SEK 1,132m (517), and earnings per share was SEK 3.94 (1.80). • The Board has reconfirmed its plan to propose to the shareholders that the Professional Products business area is distributed to the shareholders with the aim to achieve listing on the Nasdaq Stockholm during the first quarter of 2020 or, at the latest, the second quarter of 2020. Financial overview ¹ Change in net sales adjusted for currency translation effects. ² In the second quarter of 2018, operating income included non-recurring items of SEK –818m. Excluding these items, operating income amounted to SEK 1,645m, corresponding to a margin of 5.2%. In the first half of 2019, non-recurring items amounted to SEK -1,054m (-1,414). Excluding these non-recurring items, operating income amounted to SEK 2,922m (3,005) corresponding to a margin of 4.8% (5.1), see page 21. ³ Basic. For definitions, see pages 29-30. SEKM Q2 2019 Q2 2018 Change, % Six months 2019 Six months 2018 Change, % Net sales 31,687 31,354 1 61,396 59,259 4 Sales growth, %¹ -2.7 0.7 -0.7 1.9 Organic growth, % -2.6 0.4 -0.5 1.0 Acquisitions,% 0.4 0.3 0.4 0.9 Divestments, % -0.5 - -0.6 - Changes in exchange rates, % 3.8 0.6 4.3 -1.7 Operating income² 1,619 827 96 1,868 1,591 17 Operating margin, % 5.1 2.6 3.0 2.7 Income after financial items 1,441 748 93 1,531 1,420 8 Income for the period 1,132 517 119 1,211 1,068 13 Earnings per share, SEK³ 3.94 1.80 4.22 3.72 Operating cash flow after investments 384 1,805 -2,386 -866 Return on net assets, % - - 12.7 13.7 Q2 2019
- 2. 2 | AB ELECTROLUX INTERIM REPORT Q2 2019 President and CEO Jonas Samuelson’s comment A strong focus on innovation to improve consumer experiences is our guiding compass and a key driver for profitable growth. It is therefore encouraging to see that we once again have a favorable earnings impact from improved mix by selling more high-margin products and we continue to invest in marketing to support the major launches we have this year. Concurrently, price increases continued to offset strong headwinds from higher raw material costs, trade tariffs and currency, and in this quarter also from volume decline. The lower volume was mainly caused by the U.S. private label sales drop. Underlying operating income was in line with last year. The earnings for our operations in Europe and Professional Products were once again solid and operating income in Latin America increased significantly. In North America, positive price and mix offset higher costs from raw materials and trade tariffs but not fully the volume decline. The business area Asia-Pacific, Middle East and Africa was impacted by currency headwind and weak sales in Australia. We re-confirm our market view for 2019 with the exception of Southeast Asia where we now estimate the demand in the region to be slightly positive. Based on current trade tariff levels, we estimate the negative year-over-year impact from raw materials, trade tariffs and currency to be approximately SEK 1.4-1.6bn in 2019, compared to the previous estimate of approximately SEK 1.7-1.9bn. In the first half of 2019, price has fully offset this headwind and we expect that to be the case also for 2019 as a whole. The uncertainty on trade tariffs continues to impact our visibility. The preparations for the intended separation and subsequent listing of the Professional Products business area are proceeding according to plan. As the previously announced reasons for the separation are still considered valid the Board has reconfirmed its plan to propose to the shareholders that the Professional Products business area is distributed to the shareholders with the aim to achieve listing on the Nasdaq Stockholm during the first quarter of 2020 or, at the latest, the second quarter of 2020. Electrolux 100th year is a product launch intensive year and I believe our innovation power will continue to strengthen our competiveness. In addition to significant kitchen range launches in Europe and Asia-Pacific, we have sharpened our offering by being the first to bring Air Fry technology built in to the cooker to the North American market. Looking ahead, I am confident that we are well positioned to create value through our profitable growth strategy. Outlook 2019 ¹ Electrolux estimates for industry shipments of core appliances. ² Business outlook range: Favorable - Neutral – Unfavorable. ³ Efficiencies in variable costs (excl. raw materials and trade tariffs) and structural costs. ⁴ Impact on operating income for the full year 2019, whereof currency transaction effects of SEK -400m and currency translation effects of SEK 200m. The calculation is based on currency rates as per July 11, 2019. ⁵ Published on April 26, 2019. Note: Business outlook in the above table excludes non-recurring items. Market outlook, units year-over-year¹ FY 2019 Previous outlook for FY 2019⁵ Market outlook, units year-over-year¹ FY 2019 Previous outlook for FY 2019⁵ Europe Slightly positive Slightly positive Southeast Asia Slightly positive Positive North America Slightly negative Slightly negative Australia Slightly negative Slightly negative Latin America Slightly positive Slightly positive Business outlook², year-over-year Q3 2019 FY 2019 Previous outlook for the FY 2019⁵ Volume/price/mix Favorable Favorable Favorable Raw material costs and trade tariffs Increase of SEK ~0.3bn Increase of SEK 1.2-1.4bn Increase of SEK 1.4-1.6bn Net cost efficiency³ Unfavorable Unfavorable Unfavorable Currency effect⁴ SEK 100m SEK -200m SEK -300m Capital expenditure Increase SEK ~7bn SEK ~7bn
- 3. 3 | AB ELECTROLUX INTERIM REPORT Q2 2019 Summary of the second quarter ¹ For information on non-recurring items, see page 21. Note: n.m (not meaningful) is used when the calculated number is considered not relevant. Net sales Sales for the Electrolux Group decreased by 2.7% in the quarter, excluding currency translation effects. The organic decline was 2.6%, driven by lower volumes, partly offset by positive price/mix. Acquisitions and divestments had an impact of 0.4% and –0.5%, respectively. Sales in Europe and Latin America increased due to price increases and mix improvements, while strong sales growth in the beverage area was the key driver for Professional Products. In North America as well as in Asia-Pacific, Middle East and Africa sales declined due to lower sales volumes. Operating income Operating income improved to SEK 1,619m (827), corresponding to a margin of 5.1 % (2.6). The comparison period included non-recurring items of SEK -818m in Europe. Price increases fully offset headwinds from higher raw material costs, trade tariffs and currency as well as lower volumes. Mix improvements contributed positively, while higher marketing and R&D investments as well as costs related to the preparation of the separation of Professional Products impacted earnings negatively. Operating income for Europe, excluding non-recurring items, improved mainly as a result of good price/mix contribution. The significant earnings increase in Latin America was partly related to last year’s truck-driver strike. The performance of Professional Products remained solid. However, earnings were positively impacted by a pension plan settlement relating to the preparation of the separation. Operating income declined for North America due to lower volumes of private label products and a positive earnings impact last year from a release of a deferred consideration. Asia-Pacific, Middle East and Africa’s earnings also declined, primarily due to currency headwind and weak sales in Australia. Effects of changes in exchange rates Changes in exchange rates had a year-over-year impact of SEK -33m. The impact of transaction effects was SEK -138m, relating to Latin America and to operations in Australia. Translation effects amounted to SEK 105m. Financial net Net financial items amounted to SEK –179m (–79). The change was mainly due to interest expense on lease liabilities following the implementation of IFRS 16 as well as a general increase in interest net. Income for the period Income for the period amounted to SEK 1,132m (517), corresponding to SEK 3.94 (1.80) in earnings per share. SHARE OF SALES BY BUSINESS AREA IN THE SECOND QUARTER OF 2019 OPERATING INCOME AND MARGIN EBIT margin – 12 months is excluding non-recurring items, see pages 21 and 28. SEKM Q2 2019 Q2 2018 Change, % Six months 2019 Six months 2018 Change, % Full year 2018 Net sales 31,687 31,354 1 61,396 59,259 4 124,129 Operating income Europe 576 -286 n.m. 1,262 324 289 2,128 North America 504 670 -25 22 522 -96 1,104 Latin America 164 -38 n.m. -59 -3 n.m. 492 Asia-Pacific, Middle East and Africa 171 243 -29 282 406 -31 979 Professional Products 401 324 24 702 561 25 1,134 Other, Group common costs, etc. -197 -86 -130 -341 -219 -55 -527 Total Group 1,619 827 96 1,868 1,591 17 5,310 Operating margin, % 5.1 2.6 3.0 2.7 4.3 Operating margin excl. non-recurring items, %¹ 5.1 5.2 4.8 5.1 5.4 33% 32% 15% 12% 8% Europe North America Latin America Asia-Pacific, Middle East and Africa Professional Products 0% 1% 2% 3% 4% 5% 6% 7% 8% 0 300 600 900 1,200 1,500 1,800 2,100 2,400 Q2 Q3 Q4 Q1 Q2 Q3 Q4 Q1 Q2 2017 2018 2019 SEKm EBIT EBIT margin EBIT margin - 12 months
- 4. 4 | AB ELECTROLUX INTERIM REPORT Q2 2019 First half of 2019 Sales growth for the Electrolux Group was -0.7% in the first half, excluding currency translation effects. Organic growth was -0.5%. Acquisitions and divestments had an impact of 0.4% and –0.6%, respectively. Operating income amounted to SEK 1,868m (1,591), corresponding to a margin of 3.0% (2.7). In the first half non-recurring items amounted to SEK -1,054m (-1,414), see page 21. Excluding these non-recurring items, operating income amounted to SEK 2,922m (3,005) corresponding to a margin of 4.8% (5.1). Income for the period amounted to SEK 1,211m (1,068), corresponding to SEK 4.22 (3.72) in earnings per share. Market overview In the second quarter, the market in Europe increased year-over-year, driven by Eastern Europe. In the U.S., the market demand for core appliances was stable. For more information about the markets, please see the Business areas section. INDUSTRY SHIPMENTS OF CORE APPLIANCES IN EUROPE* INDUSTRY SHIPMENTS OF CORE APPLIANCES IN THE U.S.* *Units year-over-year, % Sources: Europe: Electrolux estimate, US: AHAM. For definitions see below. For other markets, there are no comprehensive market statistics. Industry shipment of appliances *Source: Electrolux estimates for core appliances. Core appliances include: Refrigerators, Freezers, Washing machines, Tumble dryers, Free-standing Cookers, Built-in Ovens, Built-in Hobs, Hoods and Dishwashers. *Source: AHAM. Core appliances includes AHAM 6 (Washers, Dryers, Dishwashers, Refrigerators, Freezers, Ranges and Ovens) and Cooktops. -2 -1 0 1 2 3 4 5 6 7 8 9 Q2 Q3 Q4 Q1 Q2 Q3 Q4 Q1 Q2 2017 2018 2019 Western Europe Eastern Europe % -8 -6 -4 -2 0 2 4 6 8 10 12 Q2 Q3 Q4 Q1 Q2 Q3 Q4 Q1 Q2 2017 2018 2019 % Europe, units, year-over-year,%* Q2 2019 Q2 2018 Six months 2019 Six months 2018 Full year 2018 Western Europe 0 -1 1 -1 -1 Eastern Europe (excluding Turkey) 4 8 4 8 7 Total Europe 1 1 2 1 1 U.S., units, year-over-year, %* Q2 2019 Q2 2018 Six months 2019 Six months 2018 Full year 2018 Core appliances 0 -4 -3 0 -1 Microwave ovens and home-comfort products -20 4 -10 -3 2 Total major appliances -8 -1 -6 -1 0
- 5. 5 | AB ELECTROLUX INTERIM REPORT Q2 2019 Business areas Europe In the second quarter, overall market demand in Europe increased by 1% year-over-year. This was driven by strong growth of 4% in Eastern Europe, while demand in Western Europe was stable. Electrolux operations in Europe reported organic sales growth of 0.8% for the quarter. This was a result of improvements in product and brand mix as well as price increases. Growth in the cordless vacuum cleaner area continued. Operating income excluding non-recurring items improved, year-over-year, mainly as a result of good price/mix contribution with strong performance in built-in kitchen products and laundry products. Currency contributed positively, while increased marketing investments for ongoing product launches and higher raw material costs impacted earnings negatively. OPERATING INCOME AND MARGIN EBIT margin – 12 months is excluding non-recurring items, see pages 21 and 28. ¹ For information on non-recurring items, see page 21. North America During the quarter, market demand for core appliances in the U.S. was stable year-over-year. Market demand for all major appliances, including microwave ovens and home-comfort products, declined by 8%. Electrolux operations in North America reported an organic sales decline of 10.8% for the quarter. This was primarily explained by lower sales of products under private label but also by an ERP system go-live that negatively impacted volumes. Cost-based price increases and mix improvements contributed positively to sales. Operating income declined year-over-year. Price increases and mix improvements offset higher costs from raw materials and tariffs but not fully the volume decline. Last year’s earnings were positively impacted by a release of a deferred consideration of approximately SEK 100m related to an acquisition. OPERATING INCOME AND MARGIN EBIT margin – 12 months is excluding non-recurring items, see pages 21 and 28. ¹ For information on non-recurring items, see page 21. -6% -1% 4% 9% 14% -300 -150 0 150 300 450 600 750 900 1,050 Q2 Q3 Q4 Q1 Q2 Q3 Q4 Q1 Q2 2017 2018 2019 SEKm EBIT EBIT margin EBIT margin - 12 months SEKM Q2 2019 Q2 2018 Six months 2019 Six months 2018 Full year 2018 Net sales 10,479 10,138 21,032 19,898 43,321 Organic growth, % 0.8 4.1 2.6 5.4 3.7 Acquisitions,% 0.2 1.0 0.3 1.1 0.7 Operating income 576 -286 1,262 324 2,128 Operating margin,% 5.5 -2.8 6.0 1.6 4.9 Operating margin excl. non-recurring items, %¹ 5.5 5.3 6.0 5.7 6.6 -6% -4% -2% 0% 2% 4% 6% 8% 10% -600 -400 -200 0 200 400 600 800 1,000 Q2 Q3 Q4 Q1 Q2 Q3 Q4 Q1 Q2 2017 2018 2019 SEKm EBIT EBIT margin EBIT margin - 12 months SEKM Q2 2019 Q2 2018 Six months 2019 Six months 2018 Full year 2018 Net sales 10,255 10,804 19,354 19,589 39,804 Organic growth, % -10.8 -10.2 -8.1 -8.3 -6.3 Divestments, % -1.5 - -1.7 - -1.0 Operating income 504 670 22 522 1,104 Operating margin,% 4.9 6.2 0.1 2.7 2.8 Operating margin excl. non-recurring items, %¹ 4.9 6.2 4.4 5.7 4.3
- 6. 6 | AB ELECTROLUX INTERIM REPORT Q2 2019 Latin America In the second quarter, consumer demand for core appliances in Brazil is estimated to have shown strong growth year-over- year, while demand in Argentina declined significantly after currency devaluation. Consumer demand in Chile declined slightly. Electrolux operations in Latin America had organic sales growth of 8.3% as a result of mix improvements and price increases. Operating income increased significantly year-over-year, partly explained by the nation-wide truck driver strike in Brazil that impacted last year’s earnings negatively. Good execution on cost-efficiency measures and improved mix also impacted earnings positively. Price increases compensated for currency headwinds and increased raw material costs. OPERATING INCOME AND MARGIN EBIT margin – 12 months is excluding non-recurring items, see pages 21 and 28. ¹ For information on non-recurring items see page 21. Asia-Pacific, Middle East and Africa During the second quarter, the markets in Southeast Asia as well as in Middle East and Africa are estimated to have grown year-over-year. In Australia, market demand declined, mainly related to a slower property market and a weaker Australian dollar. Electrolux reported an organic sales decline of 4.0%. Sales volumes in Australia continued to decline, partly as a result of the price increases implemented to mitigate increased costs related to currency headwinds. Mix contributed positively, primarily driven by growth in refrigeration and cooking, as well as in the cordless vacuum cleaner area. Operating income declined year-over-year, mainly as a result of currency headwind. Mix improvements contributed positively, while lower volumes and investments in major product launches impacted negatively. OPERATING INCOME AND MARGIN -6% -4% -2% 0% 2% 4% 6% -300 -200 -100 0 100 200 300 Q2 Q3 Q4 Q1 Q2 Q3 Q4 Q1 Q2 2017 2018 2019 SEKm EBIT EBIT margin EBIT margin - 12 months SEKM Q2 2019 Q2 2018 Six months 2019 Six months 2018 Full year 2018 Net sales 4,816 4,518 9,127 8,765 17,963 Organic growth, % 8.3 19.5 7.6 12.5 9.3 Operating income 164 -38 -59 -3 492 Operating margin, % 3.4 -0.8 -0.6 -0.0 2.7 Operating margin excl. non-recurring items, %¹ 3.4 -0.8 1.8 -0.0 2.7 0% 2% 4% 6% 8% 10% 0 80 160 240 320 400 Q2 Q3 Q4 Q1 Q2 Q3 Q4 Q1 Q2 2017 2018 2019 SEKm EBIT EBIT margin EBIT margin - 12 months SEKM Q2 2019 Q2 2018 Six months 2019 Six months 2018 Full year 2018 Net sales 3,682 3,685 7,126 6,882 14,375 Organic growth, % -4.0 1.0 -1.0 3.2 7.5 Acquisitions,% 0.1 - 0.1 1.9 0.9 Operating income 171 243 282 406 979 Operating margin, % 4.7 6.6 4.0 5.9 6.8
- 7. 7 | AB ELECTROLUX INTERIM REPORT Q2 2019 Professional Products In the second quarter, overall market demand for professional food-service and laundry equipment was slightly down across most regions, year-over-year. Organic growth was 3.7%, primarily as a result of strong growth in the beverage area, supported by a roll-out for a chain customer in North America. Price increases also contributed to the organic growth. Operating income increased and the business area reached an operating margin of 16.3%. This was partly related to price increases as well as good contribution from the beverage area. Another earnings contributor was a positive effect from a pension plan settlement in Sweden relating to the preparation work for the separation of Professional Products. Investments in marketing and innovation for product launches continued. OPERATING INCOME AND MARGIN 0% 2% 4% 6% 8% 10% 12% 14% 16% 18% 0 50 100 150 200 250 300 350 400 450 Q2 Q3 Q4 Q1 Q2 Q3 Q4 Q1 Q2 2017 2018 2019 SEKm EBIT EBIT margin EBIT margin - 12 months SEKM Q2 2019 Q2 2018 Six months 2019 Six months 2018 Full year 2018 Net sales 2,455 2,209 4,757 4,126 8,666 Organic growth, % 3.7 6.7 7.6 3.9 3.5 Acquisitions,% 5.0 - 4.5 3.7 4.7 Operating income 401 324 702 561 1,134 Operating margin, % 16.3 14.7 14.7 13.6 13.1
- 8. 8 | AB ELECTROLUX INTERIM REPORT Q2 2019 Cash flow Operating cash flow after investments amounted to SEK 384m (1,805) in the quarter. The year-over-year decline is mainly an effect of a negative contribution from working capital due to timing effects, primarily related to an ERP system go-live in North America. Higher capital expenditure also explains the decline. The first of two installments for the 2018 dividend payment of SEK 8.50 per share was distributed to shareholders during the quarter and the cash flow was impacted by SEK –1,221m. Acquisitions of operations had a negative impact of SEK 406m on the cash flow in the second quarter and refers to UNIC S.A.S., see page 27. Operating cash flow after investments in the first half of 2019 amounted to SEK -2,386m (-866). OPERATING CASH FLOW AFTER INVESTMENTS ¹ Operating income adjusted for depreciation, amortization and other non-cash items. ² For the period January 1 to June 30: interest and similar items received SEK 57m (71), interest and similar items paid SEK -248m (-115) and other financial items received/paid SEK -33m (-25). Interest paid for lease liabilities SEK -66m (-). -3,000 -2,400 -1,800 -1,200 -600 0 600 1,200 1,800 2,400 3,000 3,600 Q2 Q3 Q4 Q1 Q2 2018 2019 SEKm SEKM Q2 2019 Q2 2018 Six months 2019 Six months 2018 Full year 2018 Operating income adjusted for non-cash items¹ 2,855 2,550 5,427 4,973 10,547 Change in operating assets and liabilities -1,039 523 -5,111 -3,848 -1,000 Operating cash flow 1,816 3,073 316 1,125 9,547 Investments in tangible and intangible assets -1,331 -1,023 -2,433 -1,823 -5,629 Changes in other investments -102 -244 -270 -167 -269 Operating cash flow after investments 384 1,805 -2,386 -866 3,649 Acquisitions and divestments of operations -406 -1 -467 -430 -609 Operating cash flow after structural changes -23 1,804 -2,853 -1,296 3,041 Financial items paid, net² -166 18 -290 -69 -361 Taxes paid -228 -304 -740 -515 -1,140 Cash flow from operations and investments -416 1,519 -3,884 -1,880 1,540 Payment of lease liabilities -203 - -450 - - Dividend -1,221 -1,193 -1,221 -1,193 -2,385 Share-based payments 5 8 5 -218 -210 Total cash flow, excluding changes in loans and short–term investments -1,837 334 -5,551 -3,291 -1,056
- 9. 9 | AB ELECTROLUX INTERIM REPORT Q2 2019 Financial position Net debt As of June 30, 2019, Electrolux had a financial net debt position (excluding lease liabilities and post-employment provisions) of SEK 3,463m, compared to the financial net cash position of SEK 1,989m as of December 31, 2018. Net provisions for post- employment benefits increased to SEK 4,099m. Lease liabilities amounted to SEK 3,465m as of June 30, 2019 and is an effect of the application of IFRS 16 as from January 1, 2019. In total, net debt amounted to SEK 11,027m, an increase by SEK 9,202m compared to SEK 1,825m per December 31, 2018. Long-term borrowings and long-term borrowings with maturities within 12 months amounted to a total of SEK 9,832m as of June 30, 2019 with average maturity of 2.8 years, compared to SEK 8,553m and 2.6 years at the end of 2018. In the second quarter, a new long-term bond loan of SEK 1.25bn was raised to refinance a SEK 1bn maturity and long-term bilateral borrowings in the amount of SEK 77m were amortized. During the remaining part of 2019, long-term borrowings amounting to approximately SEK 1.2bn will mature. Liquid funds as of June 30, 2019, amounted to SEK 8,217m, a decrease of SEK 4,032m compared to SEK 12,249m as of December 31, 2018. Working capital and net assets Working capital as of June 30, 2019, amounted to SEK –12,374m (–14,167), corresponding to –10.0% (–11.7) of annualized net sales. Operating working capital amounted to SEK 7,133m (5,619), corresponding to 5.8% (4.6) of annualized net sales, see page 23. Average net assets for the first half of 2019 amounted to SEK 29,376m (23,284), corresponding to 23.9% (19.6) of annualized net sales. Net assets as of June 30, 2019, amounted to SEK 33,367m (24,027). Return on net assets was 12.7% (13.7), and return on equity was 11.1% (10.3). Net debt ¹ Whereof interest-bearing liabilities amounting to SEK 11,392m as of June 30, 2019 and SEK 9,946m as of June 30, 2018 and SEK 9,982m as of December 31, 2018. ² Electrolux has one unused committed back-up multicurrency revolving credit facility of EUR 1,000m, approximately SEK 10,600m, expiring in 2023. SEKM Jun. 30, 2019 Jun. 30, 2018 Dec. 31, 2018 Short-term loans 1,560 928 1,429 Short-term part of long-term loans 2,440 1,582 2,355 Trade receivables with recourse 139 248 168 Short-term borrowings 4,140 2,758 3,952 Financial derivative liabilities 108 60 81 Accrued interest expenses and prepaid interest income 40 108 28 Total short-term borrowings 4,287 2,926 4,062 Long-term borrowings 7,392 7,436 6,198 Total borrowings¹ 11,679 10,362 10,260 Cash and cash equivalents 7,702 9,207 11,697 Short-term investments 180 116 176 Financial derivative assets 96 396 132 Prepaid interest expenses and accrued interest income 239 249 243 Liquid funds² 8,217 9,969 12,249 Financial net debt 3,463 393 -1,989 Lease liabilities 3,465 - - Net provisions for post-employment benefits 4,099 2,352 3,814 Net debt 11,027 2,745 1,825 Net debt/equity ratio 0.52 0.14 0.08 Total equity 21,118 20,090 21,749 Equity per share, SEK 73.48 69.90 75.67 Return on equity, % 11.1 10.3 18.2 Equity/assets ratio, % 22.5 24.4 25.6
- 10. 10 | AB ELECTROLUX INTERIM REPORT Q2 2019 Other items Asbestos litigation in the U.S. Litigation and claims related to asbestos are pending against the Group in the US. Almost all of the cases refer to externally supplied components used in industrial products manufactured by discontinued operations prior to the early 1970s. The cases involve plaintiffs who have made substantially identical allegations against other defendants who are not part of the Electrolux Group. As of June 30, 2019, the Group had a total of 3,694 (3,359) cases pending, representing approximately 3,729 (approximately 3,401) plaintiffs. During the second quarter of 2019, 408 new cases with 408 plaintiffs were filed and 266 pending cases with approximately 266 plaintiffs were resolved. It is expected that additional lawsuits will be filed against Electrolux. It is not possible to predict the number of future lawsuits. In addition, the outcome of asbestos lawsuits is difficult to predict and Electrolux cannot provide any assurances that the resolution of these types of lawsuits will not have a material adverse effect on its business or on results of operations in the future. Risks and uncertainty factors As an international group with a wide geographic spread, Electrolux is exposed to a number of business and financial risks. The business risks can be divided into strategic, operational and legal risks. The financial risks are related to such factors as exchange rates, interest rates, liquidity, the giving of credit and financial instruments. Risk management in Electrolux aims to identify, control and reduce risks. Risks, risk management and risk exposure are described in more detail in the 2018 Annual Report: www.electrolux.com/annualreport2018
- 11. 11 | AB ELECTROLUX INTERIM REPORT Q2 2019 Innovation targeting outstanding consumer experiences Electrolux focuses on bringing innovations to consumers that enhance experiences in the areas of great tasting food, perfect care for clothes, and healthy wellbeing in their homes. This is done with a strong focus on sustainability. Innovation is the key driver for long term profitable growth and margin improvement. Consumer-driven product innovation meets family needs Guided by consumer insights, Electrolux is the first to bring Air Fry technology built in to the cooker to the North American market. A recent consumer study showed that the majority of consumers stated that Air Fry was a critical or important factor in their purchase decision of cooking appliances. Yet, a stand- alone Air Fryer consumes a lot of space on the kitchen countertop. Electrolux therefore equipped the Frigidaire Gallery® front control cooker with the industry-first built-in Air Fry. This means consumers can now make healthy, crispy and delicious meals for the entire family at the same time using the hottest trend in cooking, while eliminating the need for an expensive, bulky countertop appliance. The new product will be available to the market in the third quarter this year. How premium laundry added >30% EBIT improvement Electrolux identified a potential to grow profitably in the premium laundry category in Europe under the AEG brand, with the help of a sharpened brand and product offering. The revitalization of the AEG brand in 2016 shifted business from an underutilized brand into a distinct laundry offer, focusing on care of clothes. Marketing focused on online content which significantly boosted click-rates, as well as increased social media efforts and knowledge about care benefits with messages like – the wool sweater guardian and the delicate shirt defender. This resulted in larger target reach and opportunity to become preferred trade partner with customers. Consumer insight has for many years been the focus of product development, and a clear understanding of consumer relevance inherent in the development process resulted in outstanding consumer experience ratings across Europe. The effects on AEG laundry business in Europe one year after the launch were significant, resulting in 0.5% value market share increase, 9% net sales increase, >30% operating income (EBIT) improvement and 7.5 percentage points increase in price index. Examples of innovations during 2019 January 18 Strengthening partnerships at Consumer Electronics Show in Las Vegas. Electrolux has launched Google voice integration with its smart ovens in early 2019. May 15 Electrolux is partnering with Mila, a US/Chinese start-up that offers connected air purifiers via a subscription-based model direct to consumers. February 21 Frigidaire products launched at the 2019 Kitchen and Bath Industry Show, include the market’s first oven with integrated Air Fry technology. June 27 Electrolux is joining forces with Stena Recycling for the new Circular Initiative to build understanding of what needs to be done to pave the way towards a more circular society. March 20 Electrolux to launch a new intuitive kitchen range across Europe. For more information, see www.electroluxgroup.com
- 12. 12 | AB ELECTROLUX INTERIM REPORT Q2 2019 Events during and after the quarter Events during the second quarter of 2019 April 10. Annual General Meeting 2019 Staffan Bohman, Petra Hedengran, Hasse Johansson, Ulla Litzén, Fredrik Persson, David Porter, Jonas Samuelson, Ulrika Saxon and Kai Wärn were re-elected to the Board of Directors. Staffan Bohman was also elected Chairman of the Board. The proposed dividend of SEK 8.50 per share was adopted. April 25. Electrolux strengthens its professional beverage offering by acquiring UNIC in France Electrolux business area Professional Products announced it has acquired UNIC S.A.S., a French manufacturer of professional espresso machines. The acquisition complements Electrolux offering of products for beverage service and further develops its position as a leader in complete solutions for the hospitality industry. The acquired company had combined net sales of approximately EUR 20m in 2018, and 130 employees. June 17. Electrolux issued a SEK 1.25 billion bond loan under its EMTN (Euro Medium Term Note) program The bond loan is issued on June 17, 2019 with a maturity on June 17, 2022. The loan has a floating interest rate and is listed on the Luxembourg Stock Exchange. The proceeds of the offering will be used for general corporate purposes. Events after the second quarter of 2019 July 3. Electrolux to invest EUR 130 million in Italian refrigeration facility The Electrolux Group will invest approximately EUR 130m in automation, digitalization and innovation at its manufacturing facility in Susegana, Italy. The investment is part of Electrolux previously communicated manufacturing investment program (announced at the Capital Markets Day in 2017), totaling SEK 8bn over 4-5 years as from 2018. The program is expected to generate annual cost savings of approximately SEK 3bn with full effect from 2024. For more information, visit www.electroluxgroup.com
- 13. 13 | AB ELECTROLUX INTERIM REPORT Q2 2019 Parent Company AB Electrolux The Parent Company comprises the functions of the Group’s head office, as well as five companies operating on a commission basis for AB Electrolux. Net sales for the Parent Company, AB Electrolux, for the first half 2019 amounted to SEK 19,045m (18,168) of which SEK 15,468m (14,742) referred to sales to Group companies and SEK 3,577m (3,426) to external customers. Income after financial items was SEK 1,748m (632), including dividends from subsidiaries in the amount of SEK 1,451m (869). Income for the period amounted to SEK 935m (-997). Capital expenditure in tangible and intangible assets was SEK 303m (316). Liquid funds at the end of the period amounted to SEK 2,615m, as against SEK 7,244m at the start of the year. Undistributed earnings in the Parent Company at the end of the period amounted to SEK 20,442m, as against SEK 22,078m at the start of the year. Dividend payment to shareholders for 2018 amounted to SEK 2,443m, whereof SEK 1,221m has been paid during the second quarter 2019 and SEK 1,221m has been reported as a current liability. The income statement and balance sheet for the Parent Company are presented on page 24.
- 14. 14 | AB ELECTROLUX INTERIM REPORT Q2 2019 The Board of Directors and the President and CEO certify that the Interim Report for the period January – June 2019 gives a true and fair overview of the Parent Company AB Electrolux and the Group’s operations, their financial position and results of operations, and describes significant risks and uncertainties facing the Parent Company and other companies in the Group. Stockholm, July 17, 2019 AB Electrolux (publ) 556009-4178 Staffan Bohman Chairman of the Board of Directors Petra Hedengran Board member Hasse Johansson Board member Ulla Litzén Board member Fredrik Persson Board member David Porter Board member Jonas Samuelson Board member, President and CEO Ulrika Saxon Board member Kai Wärn Board member Viveca Brinkenfeldt-Lever Board member, employee representative Ulf Carlsson Board member, employee representative Peter Ferm Board member, employee representative
- 15. 15 | AB ELECTROLUX INTERIM REPORT Q2 2019 Review Report Introduction We have reviewed the interim report for AB Electrolux (publ) for the period January 1 - June 30, 2019. The Board of Directors and the President are responsible for the preparation and presentation of this interim report in accordance with IAS 34 and the Annual Accounts Act. Our responsibility is to express a conclusion on this interim report based on our review. Scope of Review We conducted our review in accordance with the International Standard on Review Engagements ISRE 2410, Review of Interim Financial Information Performed by the Independent Auditor of the Entity. A review consists of making inquiries, primarily of persons responsible for financial and accounting matters, and applying analytical and other review procedures. A review has a different focus and is substantially less in scope than an audit conducted in accordance with ISA and other generally accepted auditing practices. The procedures performed in a review do not enable us to obtain a level of assurance that would make us aware of all significant matters that might be identified in an audit. Therefore, the conclusion expressed based on a review does not give the same level of assurance as a conclusion expressed based on an audit. Conclusion Based on our review, nothing has come to our attention that causes us to believe that the interim report is not, in all material respects, prepared for the Group in accordance with IAS 34 and the Annual Accounts Act, and for the Parent Company in accordance with the Annual Accounts Act. Stockholm, July 17, 2019 Deloitte AB Jan Berntsson Authorized Public Accountant
- 16. 16 | AB ELECTROLUX INTERIM REPORT Q2 2019 Consolidated statement of comprehensive income ¹ Average numbers of shares excluding shares held by Electrolux. SEKM Q2 2019 Q2 2018 Six months 2019 Six months 2018 Full year 2018 Net sales 31,687 31,354 61,396 59,259 124,129 Cost of goods sold -25,318 -25,424 -50,224 -48,439 -100,908 Gross operating income 6,368 5,930 11,173 10,820 23,221 Selling expenses -3,422 -3,276 -6,587 -6,198 -12,986 Administrative expenses -1,192 -1,283 -2,601 -2,632 -5,101 Other operating income/expenses -135 -544 -117 -400 177 Operating income 1,619 827 1,868 1,591 5,310 Financial items, net -179 -79 -337 -171 -423 Income after financial items 1,441 748 1,531 1,420 4,887 Taxes -309 -231 -320 -352 -1,081 Income for the period 1,132 517 1,211 1,068 3,805 Items that will not be reclassified to income for the period: Remeasurement of provisions for post-employment benefits -998 33 -412 300 -448 Income tax relating to items that will not be reclassified 219 -16 88 -71 128 -779 17 -323 228 -319 Items that may be reclassified subsequently to income for the period: Cash flow hedges 24 -5 1 -16 -2 Exchange-rate differences on translation of foreign operations 380 137 1,142 867 203 Income tax relating to items that may be reclassified -1 5 -6 -5 23 402 137 1,136 846 224 Other comprehensive income, net of tax -377 153 813 1,074 -95 Total comprehensive income for the period 755 670 2,024 2,143 3,710 Income for the period attributable to: Equity holders of the Parent Company 1,132 517 1,212 1,068 3,805 Non-controlling interests -0 0 -0 1 -0 Total 1,132 517 1,211 1,068 3,805 Total comprehensive income for the period attributable to: Equity holders of the Parent Company 755 670 2,024 2,142 3,710 Non-controlling interest 0 1 0 1 -0 Total 755 670 2,024 2,143 3,710 Earnings per share, SEK Basic, SEK 3.94 1.80 4.22 3.72 13.24 Diluted, SEK 3.92 1.78 4.19 3.69 13.14 Average number of shares¹ Basic, million 287.4 287.4 287.4 287.4 287.4 Diluted, million 288.9 289.7 288.9 289.5 289.5
- 17. 17 | AB ELECTROLUX INTERIM REPORT Q2 2019 Consolidated balance sheet Change in consolidated equity SEKM Jun. 30, 2019 Jun. 30, 2018 Dec. 31, 2018 Assets Property, plant and equipment, owned 21,394 19,701 21,088 Property, plant and equipment, right-of-use 3,161 - - Goodwill 8,968 8,172 8,239 Other intangible assets 4,264 3,821 3,919 Investments in associates 424 363 397 Deferred tax assets 6,709 6,000 6,448 Financial assets 264 223 246 Pension plan assets 455 483 532 Other non-current assets 1,313 643 952 Total non-current assets 46,954 39,405 41,822 Inventories 19,194 17,679 16,750 Trade receivables 22,216 20,305 21,482 Tax assets 826 718 738 Derivatives 97 455 139 Other current assets 4,757 4,266 4,507 Short-term investments 180 116 176 Cash and cash equivalents 7,702 9,207 11,697 Total current assets 54,972 52,746 55,490 Total assets 101,926 92,151 97,312 Equity and liabilities Equity attributable to equity holders of the Parent Company Share capital 1,545 1,545 1,545 Other paid-in capital 2,905 2,905 2,905 Other reserves -1,259 -1,769 -2,394 Retained earnings 17,918 17,396 19,683 Equity attributable to equity holders of the Parent Company 21,109 20,077 21,738 Non-controlling interests 10 13 11 Total equity 21,118 20,090 21,749 Long-term borrowings 7,392 7,436 6,198 Long-term lease liabilities 2,521 - - Deferred tax liabilities 758 728 868 Provisions for post-employment benefits 4,554 2,835 4,346 Other provisions 6,254 5,754 5,281 Total non-current liabilities 21,478 16,753 16,693 Accounts payable 34,277 32,365 34,443 Tax liabilities 520 686 984 Dividend payable 1,221 1,193 - Other liabilities 15,834 15,151 17,105 Short-term borrowings 4,140 2,758 3,952 Short-term lease liabilities 945 - - Derivatives 134 60 102 Other provisions 2,258 3,097 2,284 Total current liabilities 59,329 55,309 58,870 Total equity and liabilities 101,926 92,151 97,312 SEKM Six months 2019 Six months 2018 Full year 2018 Opening balance 21,749 20,480 20,480 Change in accounting principles -235 -18 -18 Total comprehensive income for the period 2,024 2,143 3,710 Share-based payments 25 -129 -35 Dividend to equity holders of the Parent Company -2,443 -2,385 -2,385 Dividend to non-controlling interests -0 -0 -0 Acquisition of non-controlling interests -1 -2 -3 Total transactions with equity holders -2,419 -2,516 -2,424 Closing balance 21,118 20,090 21,749
- 18. 18 | AB ELECTROLUX INTERIM REPORT Q2 2019 Consolidated cash flow statement ¹ For the period January 1 to June 30: depreciation related to right-of-use assets amounted to SEK 421m (-). 2 For the period January 1 to June 30: interest and similar items received SEK 57m (71), interest and similar items paid SEK -248m (-115) and other financial items received/paid SEK -33m (-25). Interest paid related to lease liabilities SEK -66m (-). SEKM Q2 2019 Q2 2018 Six months 2019 Six months 2018 Full year 2018 Operations Operating income 1,619 827 1,868 1,591 5,310 Depreciation and amortization¹ 1,236 1,052 2,461 2,058 4,150 Other non-cash items -0 672 1,099 1,324 1,088 Financial items paid, net² -166 18 -290 -69 -361 Taxes paid -228 -304 -740 -515 -1,140 Cash flow from operations, excluding change in operating assets and liabilities 2,461 2,265 4,396 4,388 9,046 Change in operating assets and liabilities Change in inventories 76 -558 -1,781 -2,264 -1,619 Change in trade receivables -468 -41 86 1,074 -582 Change in accounts payable -752 1,013 -1,423 -35 2,317 Change in other operating assets, liabilities and provisions 105 109 -1,992 -2,623 -1,116 Cash flow from change in operating assets and liabilities -1,039 523 -5,111 -3,848 -1,000 Cash flow from operations 1,422 2,787 -714 540 8,046 Investments Acquisition of operations -406 -1 -467 -430 -902 Divestment of operations - - - - 293 Capital expenditure in property, plant and equipment -901 -794 -1,707 -1,409 -4,650 Capital expenditure in product development -301 -97 -459 -185 -416 Capital expenditure in software and other intangibles -129 -132 -267 -229 -563 Other -102 -244 -270 -167 -269 Cash flow from investments -1,839 -1,269 -3,169 -2,421 -6,506 Cash flow from operations and investments -416 1,519 -3,884 -1,880 1,540 Financing Change in short-term investments 353 54 -3 248 193 Change in short-term borrowings 139 -104 201 116 951 New long-term borrowings 1,295 652 2,317 1,660 1,736 Amortization of long-term borrowings -1,081 -77 -1,159 -1,073 -1,531 Payment of lease liabilities -203 - -450 - - Dividend -1,221 -1,193 -1,221 -1,193 -2,385 Share-based payments 5 8 5 -218 -210 Cash flow from financing -714 -660 -312 -460 -1,245 Total cash flow -1,131 859 -4,195 -2,341 295 Cash and cash equivalents at beginning of period 8,773 8,272 11,697 11,289 11,289 Exchange-rate differences referring to cash and cash equivalents 60 76 200 259 113 Cash and cash equivalents at end of period 7,702 9,207 7,702 9,207 11,697
- 19. 19 | AB ELECTROLUX INTERIM REPORT Q2 2019 Key ratios 1 Non-recurring items of SEK -1,054 in the first six months of 2019 refers to business area North America and Latin America in the first quarter. Non-recurring items of SEK -1,414m in the first six months of 2018 include SEK -596m in business area North America in the first quarter and SEK -818m in business area Europe in the second quarter. For information on non-recurring items, see page 21. ²Basic. For definitions, see pages 29-30. Shares Exchange rates SEKM unless otherwise stated Q2 2019 Q2 2018 Six months 2019 Six months 2018 Full year 2018 Net sales 31,687 31,354 61,396 59,259 124,129 Organic growth, % -2.6 0.4 -0.5 1.0 1.3 EBITA 1,851 1,075 2,311 2,086 6,282 EBITA margin, % 5.8 3.4 3.8 3.5 5.1 Operating income 1,619 827 1,868 1,591 5,310 Operating margin, % 5.1 2.6 3.0 2.7 4.3 Operating margin excl. non-recurring items, %¹ 5.1 5.2 4.8 5.1 5.4 Income after financial items 1,441 748 1,531 1,420 4,887 Income for the period 1,132 517 1,211 1,068 3,805 Capital expenditure property, plant and equipment -901 -794 -1,707 -1,409 -4,650 Operating cash flow after investments 384 1,805 -2,386 -866 3,649 Earnings per share, SEK² 3.94 1.80 4.22 3.72 13.24 Equity per share, SEK 73.48 69.90 73.48 69.90 75.67 Capital turnover rate, times/year - - 4.2 5.1 5.3 Return on net assets, % - - 12.7 13.7 22.7 Return on equity, % - - 11.1 10.3 18.2 Net debt 11,027 2,745 11,027 2,745 1,825 Net debt/equity ratio 0.52 0.14 0.52 0.14 0.08 Average number of shares excluding shares owned by Electrolux, million 287.4 287.4 287.4 287.4 287.4 Average number of employees 52,505 54,415 52,280 54,972 54,419 Number of shares A-shares B-shares Shares total Shares held by Electrolux Shares held by other shareholders Number of shares as of January 1, 2019 8,192,539 300,727,769 308,920,308 21,522,858 287,397,450 Number of shares as of June 30, 2019 8,192,539 300,727,769 308,920,308 21,522,858 287,397,450 As % of total number of shares 7.0% SEK Exchange rate Average End of period Average End of period Average End of period ARS 0.2258 0.2187 0.3971 0.3107 0.3087 0.2373 AUD 6.55 6.50 6.50 6.62 6.50 6.34 BRL 2.41 2.42 2.46 2.33 2.39 2.32 CAD 6.94 7.09 6.60 6.77 6.71 6.59 CHF 9.31 9.51 8.72 9.04 8.91 9.15 CLP 0.0137 0.0137 0.0137 0.0138 0.0136 0.0129 CNY 1.37 1.35 1.32 1.35 1.31 1.30 EUR 10.49 10.56 10.17 10.45 10.26 10.28 GBP 11.96 11.78 11.55 11.80 11.57 11.38 HUF 0.0327 0.0327 0.0322 0.0317 0.0321 0.0320 MXN 0.4804 0.4841 0.4423 0.4568 0.4517 0.4556 RUB 0.1416 0.1475 0.1422 0.1429 0.1392 0.1292 THB 0.2928 0.3027 0.2646 0.2710 0.2691 0.2754 USD 9.26 9.28 8.44 8.97 8.70 8.97 Jun. 30, 2019 Jun. 30, 2018 Dec. 31, 2018
- 20. 20 | AB ELECTROLUX INTERIM REPORT Q2 2019 Net sales and operating income by business area ¹ Basic. SEKM Q1 2019 Q2 2019 Q3 2019 Q4 2019 Full year 2019 Q1 2018 Q2 2018 Q3 2018 Q4 2018 Full year 2018 Europe Net sales 10,553 10,479 9,760 10,138 10,885 12,539 43,321 Sales growth, % 4.6 1.0 8.0 5.1 5.2 0.5 4.4 EBITA 730 631 687 -215 806 1,114 2,392 EBITA margin, % 6.9 6.0 7.0 -2.1 7.4 8.9 5.5 Operating income 686 576 610 -286 749 1,055 2,128 Operating margin, % 6.5 5.5 6.2 -2.8 6.9 8.4 4.9 North America Net sales 9,099 10,255 8,785 10,804 10,072 10,143 39,804 Sales growth, % -6.8 -12.1 -5.4 -10.2 -6.3 -6.3 -7.2 EBITA -450 555 -118 703 392 261 1,238 EBITA margin, % -4.9 5.4 -1.3 6.5 3.9 2.6 3.1 Operating income -482 504 -148 670 358 223 1,104 Operating margin, % -5.3 4.9 -1.7 6.2 3.6 2.2 2.8 Latin America Net sales 4,312 4,816 4,247 4,518 3,845 5,353 17,963 Sales growth, % 6.9 8.3 5.9 19.5 0.4 11.8 9.3 EBITA -165 217 97 22 260 342 721 EBITA margin, % -3.8 4.5 2.3 0.5 6.8 6.4 4.0 Operating income -223 164 35 -38 205 290 492 Operating margin, % -5.2 3.4 0.8 -0.8 5.3 5.4 2.7 Asia-Pacific, Middle East and Africa Net sales 3,445 3,682 3,197 3,685 3,507 3,986 14,375 Sales growth, % 2.3 -3.8 10.1 1.0 5.1 18.3 8.4 EBITA 141 204 191 273 301 331 1,096 EBITA margin, % 4.1 5.5 6.0 7.4 8.6 8.3 7.6 Operating income 110 171 163 243 270 302 979 Operating margin, % 3.2 4.7 5.1 6.6 7.7 7.6 6.8 Professional Products Net sales 2,302 2,455 1,917 2,209 2,135 2,405 8,666 Sales growth, % 15.6 8.8 8.5 6.7 6.7 11.0 8.2 EBITA 316 417 245 331 293 310 1,179 EBITA margin,% 13.7 17.0 12.8 15.0 13.7 12.9 13.6 Operating income 301 401 237 324 280 294 1,134 Operating margin, % 13.1 16.3 12.4 14.7 13.1 12.2 13.1 Group common costs, etc. -143 -197 -133 -86 -107 -201 -527 Total Group Net sales 29,710 31,687 27,906 31,354 30,444 34,425 124,129 Sales growth, % 1.6 -2.7 3.3 0.7 0.7 2.5 1.7 EBITA 460 1,851 1,011 1,075 1,991 2,205 6,282 EBITA margin, % 1.5 5.8 3.6 3.4 6.5 6.4 5.1 Operating income 248 1,619 764 827 1,756 1,963 5,310 Operating margin, % 0.8 5.1 2.7 2.6 5.8 5.7 4.3 Income after financial items 90 1,441 672 748 1,634 1,832 4,887 Income for the period 79 1,132 551 517 1,162 1,575 3,805 Earnings per share, SEK¹ 0.28 3.94 1.92 1.80 4.04 5.48 13.24
- 21. 21 | AB ELECTROLUX INTERIM REPORT Q2 2019 Non-recurring items by business area ¹ The non-recurring item of SEK -829m relates to the consolidation of U.S. cooking production and SEK -225m to the closure of a refrigeration production line in Latin America. The costs are included in Cost of goods sold and consists of write down of fixed assets, provision for severance cost and other cost related to the projects. 2 The non-recurring item of SEK -596m refers to the consolidation of freezer production in North America. The cost is included in Cost of goods sold and consists of write down of fixed assets, provision for severance cost and other cost related to the project. 3 The non-recurring items of SEK -818m refer to business area Europe. These include a provision of SEK -564m for a fine relating to an investigation by the French Competition Authority and a provision of SEK -254m relating to an unfavorable court ruling in France. These costs are included in other operating income/expenses. 4 The non-recurring item of SEK 71m refers to business area Europe and relates to the French Competition Authority investigation that was concluded in the quarter and is the difference between the actual fine and the provision set in the second quarter. This income is included in other operating income/expenses. Operating income excluding non-recurring items SEKM Q1 2019¹ Q2 2019 Q3 2019 Q4 2019 Full year 2019 Q1 2018² Q2 2018³ Q3 2018 Q4 2018⁴ Full year 2018 Europe - - - -818 - 71 -747 North America -829 - -596 - - - -596 Latin America -225 - - - - - - Asia-Pacific, Middle East and Africa - - - - - - - Professional Products - - - - - - - Group common costs, etc. - - - - - - - Total Group -1,054 - -596 -818 - 71 -1,343 SEKM Q1 2019 Q2 2019 Q3 2019 Q4 2019 Full year 2019 Q1 2018 Q2 2018 Q3 2018 Q4 2018 Full year 2018 Europe Operating income excl. non- recurring items 686 576 610 532 749 984 2,875 Operating margin excl. non- recurring items, % 6.5 5.5 6.2 5.3 6.9 7.9 6.6 North America Operating income excl. non- recurring items 347 504 448 670 358 223 1,700 Operating margin excl. non- recurring items, % 3.8 4.9 5.1 6.2 3.6 2.2 4.3 Latin America Operating income excl. non- recurring items 2 164 35 -38 205 290 492 Operating margin excl. non- recurring items, % 0.1 3.4 0.8 -0.8 5.3 5.4 2.7 Total Group Operating income excl. non- recurring items 1,302 1,619 1,360 1,645 1,756 1,892 6,653 Operating margin excl. non- recurring items, % 4.4 5.1 4.9 5.2 5.8 5.5 5.4
- 22. 22 | AB ELECTROLUX INTERIM REPORT Q2 2019 Net sales by business area Change in net sales by business area Operating income by business area Change in operating income by business area SEKM Q2 2019 Q2 2018 Six months 2019 Six months 2018 Full year 2018 Europe 10,479 10,138 21,032 19,898 43,321 North America 10,255 10,804 19,354 19,589 39,804 Latin America 4,816 4,518 9,127 8,765 17,963 Asia-Pacific, Middle East and Africa 3,682 3,685 7,126 6,882 14,375 Professional Products 2,455 2,209 4,757 4,126 8,666 Total 31,687 31,354 61,396 59,259 124,129 Year–over–year, % Q2 2019 Q2 2019 in local currencies Six months 2019 Six months 2019 in local currencies Europe 3 1 6 3 North America -5 -12 -1 -10 Latin America 7 8 4 8 Asia-Pacific, Middle East and Africa -0 -4 4 -1 Professional Products 11 9 15 12 Total change 1 -3 4 -1 SEKM Q2 2019 Q2 2018 Six months 2019 Six months 2018 Full year 2018 Europe 576 -286 1,262 324 2,128 Margin, % 5.5 -2.8 6.0 1.6 4.9 North America 504 670 22 522 1,104 Margin, % 4.9 6.2 0.1 2.7 2.8 Latin America 164 -38 -59 -3 492 Margin, % 3.4 -0.8 -0.6 -0.0 2.7 Asia-Pacific, Middle East and Africa 171 243 282 406 979 Margin, % 4.7 6.6 4.0 5.9 6.8 Professional Products 401 324 702 561 1,134 Margin, % 16.3 14.7 14.7 13.6 13.1 Group common costs, etc. -197 -86 -341 -219 -527 Operating income 1,619 827 1,868 1,591 5,310 Margin, % 5.1 2.6 3.0 2.7 4.3 Year–over–year, % Q2 2019 Q2 2019 in local currencies Six months 2019 Six months 2019 in local currencies Europe n.m. n.m. 289 260 North America -25 -31 -96 -96 Latin America n.m. n.m. n.m. n.m. Asia-Pacific, Middle East and Africa -29 -32 -31 -34 Professional Products 24 20 25 20 Total change 96 75 17 10
- 23. 23 | AB ELECTROLUX INTERIM REPORT Q2 2019 Working capital and net assets Net assets by business area ¹Includes common functions and tax items. SEKM Jun. 30, 2019 % of annualized net sales Jun. 30, 2018 % of annualized net sales Dec. 31, 2018 % of annualized net sales Inventories 19,194 15.6 17,679 14.5 16,750 13.5 Trade receivables 22,216 18.0 20,305 16.7 21,482 17.3 Accounts payable -34,277 -27.8 -32,365 -26.6 -34,443 -27.7 Operating working capital 7,133 5.8 5,619 4.6 3,789 3.0 Provisions -8,512 -8,850 -7,565 Prepaid and accrued income and expenses -10,842 -10,456 -11,745 Taxes and other assets and liabilities -153 -479 -1,327 Working capital -12,374 -10.0 -14,167 -11.7 -16,848 -13.5 Property, plant and equipment, owned 21,394 19,701 21,088 Property, plant and equipment, right-of-use 3,161 - - Goodwill 8,968 8,172 8,239 Other non-current assets 6,266 5,049 5,516 Deferred tax assets and liabilities 5,951 5,272 5,580 Net assets 33,367 27.0 24,027 19.8 23,574 19.0 Annualized net sales, calculated at end of period exchange rates 123,374 121,547 124,399 Average net assets 29,376 23.9 23,284 19.6 23,381 18.8 Annualized net sales, calculated at average exchange rates 122,793 118,518 124,129 SEKM Jun. 30, 2019 Jun. 30, 2018 Dec. 31, 2018 Jun. 30, 2019 Jun. 30, 2018 Dec. 31, 2018 Jun. 30, 2019 Jun. 30, 2018 Dec. 31, 2018 Europe 26,403 24,861 26,276 22,607 23,268 25,766 3,796 1,594 510 North America 24,685 19,507 19,124 16,996 15,603 15,322 7,688 3,904 3,802 Latin America 13,321 12,544 13,092 6,946 6,491 6,906 6,375 6,053 6,186 Asia-Pacific, Middle East and Africa 12,428 10,785 10,826 6,072 5,659 5,603 6,357 5,126 5,223 Professional Products 6,975 5,768 6,101 3,251 3,084 3,144 3,724 2,684 2,957 Other¹ 9,443 8,233 9,112 4,015 3,566 4,217 5,427 4,667 4,895 Total operating assets and liabilities 93,255 81,699 84,531 59,888 57,672 60,958 33,367 24,027 23,574 Liquid funds 8,217 9,969 12,249 - - - - - - Total borrowings - - - 11,679 10,362 10,260 - - - Lease liabilities - - - 3,465 - - - - - Pension assets and liabilities 455 483 532 4,554 2,835 4,346 - - - Dividend payable - - - 1,221 1,193 - - - - Total equity - - - 21,118 20,090 21,749 - - - Total 101,926 92,151 97,312 101,926 92,151 97,312 - - - Assets Equity and liabilities Net assets
- 24. 24 | AB ELECTROLUX INTERIM REPORT Q2 2019 Parent Company income statement Parent Company balance sheet SEKM Q2 2019 Q2 2018 Six months 2019 Six months 2018 Full year 2018 Net sales 9,304 9,270 19,045 18,168 38,911 Cost of goods sold -8,047 -7,959 -16,359 -15,458 -33,560 Gross operating income 1,257 1,311 2,686 2,710 5,351 Selling expenses -760 -738 -1,550 -1,479 -3,247 Administrative expenses -522 -517 -1,050 -945 -1,410 Other operating expenses - -565 - -565 -804 Operating income -25 -509 86 -279 -110 Financial income 1,715 1,065 1,971 1,242 7,967 Financial expenses -190 -104 -309 -331 -695 Financial items, net 1,525 961 1,662 911 7,272 Income after financial items 1,500 452 1,748 632 7,162 Appropriations -931 -1,835 -889 -1,883 -1,743 Income before taxes 569 -1,383 859 -1,251 5,419 Taxes 148 295 76 254 69 Income for the period 717 -1,088 935 -997 5,488 SEKM Jun. 30, 2019 Jun. 30, 2018 Dec. 31, 2018 Assets Non–current assets 38,675 36,845 38,254 Current assets 32,093 27,473 33,157 Total assets 70,768 64,318 71,411 Equity and liabilities Restricted equity 5,623 5,258 5,437 Non–restricted equity 20,442 15,697 22,078 Total equity 26,065 20,955 27,515 Untaxed reserves 457 446 442 Provisions 1,075 1,783 1,133 Non–current liabilities 6,891 6,935 5,735 Current liabilities 36,280 34,199 36,586 Total equity and liabilities 70,768 64,318 71,411
- 25. 25 | AB ELECTROLUX INTERIM REPORT Q2 2019 Notes Note 1 Accounting principles Electrolux applies International Financial Reporting Standards (IFRS) as adopted by the European Union. This report has been prepared in accordance with IAS 34, Interim Financial Reporting, the Swedish Annual Accounts Act and RFR 2 ‘Accounting for legal entities’ issued by the Swedish Financial Reporting Board. Electrolux interim reports contain a condensed set of financial statements. For the Group this chiefly means that the disclosures are limited compared to the consolidated financial statements presented in the annual report. For the Parent Company this means that the financial statements in general are presented in condensed versions and with limited disclosures compared to the annual report. The accounting policies adopted are consistent with those followed in the preparation of the Group’s Annual Report 2018, except for the adoption of new standards effective as of January 1, 2019. The Group’s accounting principles are described in Note 1 in the Annual Report 2018, including transition effects and accounting principles related to IFRS 16 Leases which is applied by Electrolux from January 1, 2019. The transition to IFRS 16 has resulted in the following opening balance adjustment: Assets Equity and Liabilities Right-of-use assets 3,160 Lease liabilities 3,453 Deferred tax assets 88 Retained earnings -235 Prepaid lease fees -35 Accrued lease fees -4 Total 3,214 Total 3,214 Reportable segments – Business areas As from 2019 Electrolux has revised its consumer business area structure. The former business area Home Care & SDA has been combined with the former major appliances business areas, creating four consumer-focused regional business areas: Europe, North America, Latin America, and Asia-Pacific, Middle East and Africa. These, together with business area Professional Products, represent the Group’s reportable segments. Comparatives have been restated accordingly. For more information, please see press release ‘Restated figures for 2018 in line with Electrolux new business area structure’ published on April 5, 2019. Note 2 Disaggregation of revenue Electrolux manufactures and sells appliances mainly in the wholesale market to customers being retailers. Electrolux products include refrigerators, dishwashers, washing machines, cookers, vacuum cleaners, air conditioners and small domestic appliances. The four regional Consumer Products business areas focus on the consumer market and business area Professional Products focuses on professional users. Sales of products are revenue recognized at a point in time, when control of the products has transferred. Revenue from services related to installation of products, repairs or maintenance service is recognized when control is transferred being over the time the service is provided. Sales of services are not material in relation to Electrolux total net sales. Product and geography are considered important attributes when disaggregating Electrolux revenue. Therefore, the table below presents net sales related to Consumer Products and Professional Products per geographical region based on the location of each selling company. SEKM Consumer Products Professional Products Total Consumer Products Professional Products Total Geographical region Europe 21,032 3,771 24,803 19,898 3,336 23,234 North America 19,354 574 19,928 19,589 399 19,988 Latin America 9,127 - 9,127 8,765 - 8,765 Asia-Pacific, Middle East and Africa 7,126 412 7,538 6,882 391 7,273 Total 56,640 4,757 61,396 55,133 4,126 59,259 Six months 2018Six months 2019
- 26. 26 | AB ELECTROLUX INTERIM REPORT Q2 2019 Note 3 Fair values and carrying amounts of financial assets and liabilities The Group strives for arranging master-netting agreements (ISDA) with the counterparts for derivative transactions and has established such agreements with the majority of the counterparties, i.e., if a counterparty will default, assets and liabilities will be netted. Derivatives are presented gross in the balance sheet. Fair value estimation Valuation of financial instruments at fair value is done at the most accurate market prices available. Instruments which are quoted on the market, e.g., the major bond and interest-rate future markets, are all marked-to-market with the current price. The foreign-exchange spot rate is used to convert the value into SEK. For instruments where no reliable price is available on the market, cash-flows are discounted using the deposit/swap curve of the cash flow currency. If no proper cash-flow schedule is available, e.g., as in the case with forward-rate agreements, the underlying schedule is used for valuation purposes. To the extent option instruments are used, the valuation is based on the Black & Scholes’ formula. The carrying value less impairment provision of trade receivables and payables are assumed to approximate their fair values. The fair value of financial liabilities is estimated by discounting the future contractual cash flows at the current market-interest rate for similar financial instruments. The Group’s financial assets and liabilities are measured according to the following hierarchy: Level 1: Quoted prices in active markets for identical assets or liabilities. At June 30, 2019, the fair value for Level 1 financial assets was SEK 180m (116) and for financial liabilities SEK 0m (0). Level 2: Inputs other than quoted prices included in Level 1 that are observable for assets or liabilities either directly or indirectly. At June 30, 2019, the fair value of Level 2 financial assets was SEK 22,313m (20,701) and financial liabilities SEK 134m (60). Level 3: Inputs for the assets or liabilities that are not entirely based on observable market data. At June 30, 2019, the fair value of Level 3 financial assets was SEK 264m (222) and financial liabilities SEK 0m (0). Note 4 Pledged assets and contingent assets and liabilities For more information on contingent assets and liabilities, see Note 25 in the Annual Report 2018. SEKM Fair value Carrying amount Fair value Carrying amount Fair value Carrying amount Per category Financial assets at fair value through profit and loss 264 264 222 222 246 246 Financial assets measured at amortized cost 30,098 30,098 29,629 29,629 33,355 33,355 Derivatives, financial assets at fair value through profit and loss 96 96 396 396 120 120 Derivatives in hedge accounting 1 1 - - 19 19 Total financial assets 30,459 30,459 30,247 30,247 33,740 33,740 Financial liabilities measured at amortized cost 45,866 45,809 42,375 42,311 44,650 44,593 Derivatives, financial liabilities at fair value through profit and loss 132 132 21 21 100 100 Derivatives in hedge accounting 2 2 39 39 2 2 Total financial liabilities 46,000 45,943 42,435 42,371 44,752 44,695 Jun. 30, 2019 Jun. 30, 2018 Dec. 31, 2018 SEKM Jun. 30, 2019 Jun. 30, 2018 Dec. 31, 2018 Group Pledged assets 6 6 6 Guarantees and other commitments 1,197 1,338 1,015 Parent Company Pledged assets - - - Guarantees and other commitments 1,579 1,572 1,534
- 27. 27 | AB ELECTROLUX INTERIM REPORT Q2 2019 Note 5 Acquisitions of operations Acquisitions in the first quarter of 2019 During the first quarter of 2019, Electrolux completed an acquisition of an appliance installation and repair service operations in Australia with an upfront payment of AUD 3.9m (approximately SEK 26m). The operations are included in business area Asia-Pacific, Middle East and Africa. Acquisitions in the second quarter of 2019 UNIC S.A.S. On April 24, 2019, Electrolux completed the acquisition of UNIC S.A.S., a French manufacturer of professional espresso machines. The company’s headquarters and main manufacturing facility are located in southern France, with subsidiaries in the U.S. and Japan. The acquired business had combined net sales of approximately EUR 20m in 2018, and 130 employees. The consideration consists of a cash payment of EUR 39m with a preliminary net debt assumed of EUR 6.6m. The cash payment is equivalent to SEK 410m and a cash flow effect of SEK -406m, excluding acquired cash and cash equivalents. Net sales and operating income in the acquired business during the period January 1, 2019, up until the date the acquisition was completed amounted to EUR 6m and EUR 0m respectively, approximately SEK 63m and SEK 0m respectively. The acquired business is included in Electrolux consolidated accounts per June 30 based on the acquired balance sheet and a preliminary purchase price allocation. Goodwill recognized amounts to SEK 334m and is not expected to be deductible for income tax purposes. The operations are included in business area Professional Products. Transaction costs Transaction costs related to the acquisitions described above amount to SEK 3.2m and have been expensed as incurred during the acquisition processes, whereof SEK 2.6m expensed in 2019. The costs have been reported in the operating income of the respective business area. Cash flow related to acquisitions of operations Total cash flow related to acquisitions of operations amounts to SEK -467m and includes payments for the acquisitions completed in the first and second quarters, totaling SEK 432m, excluding acquired cash and cash equivalents, and a deferred consideration payment in the first quarter of SEK 35m regarding the Schneidereit acquisition in 2018.
- 28. 28 | AB ELECTROLUX INTERIM REPORT Q2 2019 Operations by business area yearly ¹ 2017 has been restated due to IFRS 15. ² For more information, see Note 7 in the annual reports. 3 Refers to costs related to the not completed acquisition of GE Appliances of SEK -2,059m and restructuring costs within HC&SDA of SEK -190m. 4 Non-recurring items 2018: SEK -596m refers to the consolidation of freezer production in North America, SEK -747m refers to business area Europe and includes a fine of SEK -493m, relating to an investigation by the French Competition Authority, and a cost of SEK -254m relating to an unfavorable court ruling in France. SEKM 2015 2016 2017¹ 2018 Europe Net sales 38,224 39,097 39,618 43,321 Operating income 2,290 2,794 2,765 2,128 Margin, % 6.0 7.1 7.0 4.9 North America Net sales 45,276 44,914 42,083 39,804 Operating income 1,454 2,657 2,796 1,104 Margin, % 3.2 5.9 6.6 2.8 Latin America Net sales 19,679 16,384 18,277 17,963 Operating income 459 -111 483 492 Margin, % 2.3 -0.7 2.6 2.7 Asia-Pacific, Middle East and Africa Net sales 13,787 13,833 13,071 14,375 Operating income 308 673 1,084 979 Margin, % 2.2 4.9 8.3 6.8 Professional Products Net sales 6,546 6,865 7,723 8,666 Operating income 862 954 1,054 1,134 Margin, % 13.2 13.9 13.7 13.1 Other Group common cost, etc. -2,631 -693 -775 -527 Total Group Net sales 123,511 121,093 120,771 124,129 Operating income 2,741 6,274 7,407 5,310 Margin, % 2.2 5.2 6.1 4.3 Non-recurring items in operating income² 2015³ 2016 2017 2018⁴ Europe -40 - - -747 North America -207 - - -596 Latin America -11 - - - Asia-Pacific, Middle East and Africa -90 - - - Professional Products - - - - Group common cost -1,901 - - - Total Group -2,249 - - -1,343
- 29. 29 | AB ELECTROLUX INTERIM REPORT Q2 2019 Five-year review ¹ 2017 is restated due to IFRS 15. ² For more information, see table on pages 21 and 28 and Note 7 in the annual reports. 3 Basic. Definitions This report includes financial measures as required by the financial reporting framework applicable to Electrolux, which is based on IFRS. In addition, there are other measures and indicators that are used to follow-up, analyze and manage the business and to provide Electrolux stakeholders with useful financial information on the Group’s financial position, performance and development in a consistent way. On the following page is a list of definitions of all measures and indicators used, referred to and presented in this report. Computation of average amounts and annualized income statement measures In computation of key ratios where averages of capital balances are related to income statement measures, the average capital balances are based on the opening balance and all quarter-end closing balances included in the reporting period, and the income statement measures are annualized, translated at average rates for the period. In computation of key ratios where end-of-period capital balances are related to income statement measures, the latter are annualized, translated at end of-period exchange rates. Adjustments are made for acquired and divested operations. SEKM unless otherwise stated 2014 2015 2016 2017¹ 2018 Net sales 112,143 123,511 121,093 120,771 124,129 Organic growth, % 1.1 2.2 -1.1 -0.4 1.3 Operating income 3,581 2,741 6,274 7,407 5,310 Operating margin, % 3.2 2.2 5.2 6.1 4.3 Income after financial items 2,997 2,101 5,581 6,966 4,887 Income for the period 2,242 1,568 4,493 5,745 3,805 Non-recurring items in operating income² -1,348 -2,249 - - -1,343 Capital expenditure, property, plant and equipment -3,006 -3,027 -2,830 -3,892 -4,650 Operating cash flow after investments 6,631 6,745 9,140 6,877 3,649 Earnings per share, SEK³ 7.83 5.45 15.64 19.99 13.24 Equity per share, SEK 57.52 52.21 61.72 71.26 75.67 Dividend per share, SEK 6.50 6.50 7.50 8.30 8.50 Capital-turnover rate, times/year 4.5 5.0 5.8 5.9 5.3 Return on net assets, % 14.2 11.0 29.9 36.0 22.7 Return on equity, % 15.7 9.9 29.4 31.9 18.2 Net debt 9,631 6,407 360 197 1,825 Net debt/equity ratio 0.58 0.43 0.02 0.01 0.08 Average number of shares excluding shares owned by Electrolux, million 286.3 287.1 287.4 287.4 287.4 Average number of employees 60,038 58,265 55,400 55,692 54,419 Financial goals over a business cycle The financial goals set by Electrolux aim to strengthen the Group’s leading, global position in the industry and to assist in generating a healthy total yield for Electrolux shareholders. The objective is growth with consistent profitability. Financial goals • Operating margin of at least 6% • Capital turnover-rate of at least 4 times • Return on net assets >20% • Average annual sales growth of at least 4%
- 30. 30 | AB ELECTROLUX INTERIM REPORT Q2 2019 Definitions (continued) Growth measures Change in net sales Current year net sales for the period less previous year net sales for the period as a percentage of previous year net sales for the period. Sales growth Change in net sales adjusted for currency translation effects. Organic growth Change in net sales, adjusted for changes in exchange rates, acquisitions and divestments. Acquisitions Change in net sales, adjusted for organic growth, changes in exchange rates and divestments. The impact from acquisitions relates to net sales reported by acquired operations within 12 months after the acquisition date. Divestments Change in net sales, adjusted for organic growth, changes in exchange rates and acquisitions. The impact from divestments relates to net sales reported by the divested operations within 12 months before the divestment date. Profitability measures EBITA Operating income excluding amortization of intangible assets. EBITA margin EBITA expressed as a percentage of net sales. Operating margin (EBIT margin) Operating income (EBIT) expressed as a percentage of net sales. Operating margin (EBIT margin) excluding non-recurring items Operating income (EBIT) excluding non-recurring items, expressed as a percentage of net sales. Return on net assets Operating income (annualized) expressed as a percentage of average net assets. Return on equity Income for the period (annualized) expressed as a percentage of average total equity. Capital measures Net debt/equity ratio Net debt in relation to total equity. Equity/assets ratio Total equity as a percentage of total assets less liquid funds. Capital turnover-rate Net sales (annualized) divided by average net assets. Share-based measures Earnings per share, Basic Income for the period attributable to equity holders of the Parent Company divided by the average number of shares excluding shares held by Electrolux. Earnings per share, Diluted Income for the period attributable to equity holders of the Parent Company divided by the average number of shares after dilution, excluding shares held by Electrolux. Equity per share Total equity divided by total number of shares excluding shares held by Electrolux. Capital indicators Liquid funds Cash and cash equivalents, short-term investments, financial derivative assets1 and prepaid interest expenses and accrued interest income1 . Operating working capital Inventories and trade receivables less accounts payable. Working capital Total current assets exclusive of liquid funds, less non-current other provisions and total current liabilities exclusive of total short-term borrowings. Net assets Total assets exclusive of liquid funds and pension plan assets, less deferred tax liabilities, non-current other provisions and total current liabilities exclusive of total short-term borrowings. Total borrowings Long-term borrowings and short-term borrowings, financial derivative liabilities1 , accrued interest expenses and prepaid interest income1 . Total short-term borrowings Short-term borrowings, financial derivative liabilities1 , accrued interest expenses and prepaid interest income1 . Interest-bearing liabilities Long-term borrowings and short-term borrowings exclusive of liabilities related to trade receivables with recourse1 . Financial net debt Total borrowings less liquid funds. Net provision for post-employment benefits Provisions for post-employment benefits less pension plan assets. Net debt Financial net debt, lease liabilities and net provision for post- employment benefits. Other measures Operating cash flow after investments Cash flow from operations and investments adjusted for financial items paid, taxes paid and acquisitions/divestments of operations. Non-recurring items Material profit or loss items in operating income which are relevant for understanding the financial performance when comparing income for the current period with previous periods. 1 See table Net debt on page 9.
- 31. 31 | AB ELECTROLUX INTERIM REPORT Q2 2019 Shareholders’ information President and CEO Jonas Samuelson’s comments on the second quarter results 2019 Today’s press release is available on the Electrolux website www.electroluxgroup.com/ir Telephone conference 09.00 CET A telephone conference is held at 09.00 CET today, July 18. Jonas Samuelson, President and CEO and Therese Friberg, CFO will comment on the report. Details for participation by telephone are as follows: Participants in Sweden: +46 8 566 426 51 Participants in UK/Europe: +44 3333 000 804 Participants in US: +1 631 9131 422 Pin code: 86381780# Slide presentation for download: www.electroluxgroup.com/ir Link to webcast: https://edge.media-server.com/m6/p/ibk4cpkt For further information, please contact: Sophie Arnius, Head of Investor Relations +46 70 590 80 72 Merton Kaplan, Investor Relations manager +46 73 885 78 03 Calendar 2019 Interim report January – September October 25 This report contains ‘forward-looking’ statements that reflect the company’s current expectations. Although the company believes that the expectations reflected in such forward-looking statements are reasonable, no assurance can be given that such expectations prove to have been correct as they are subject to risks and uncertainties that could cause actual results to differ materially due to a variety of factors. These factors include, but are not limited to, changes in consumer demand, changes in economic, market and competitive conditions, currency fluctuations, developments in product liability litigation, changes in the regulatory environment and other government actions. Forward-looking statements speak only as of the date they were made, and, other than as required by applicable law, the company undertakes no obligation to update any of them in light of new information or future events. AB Electrolux (publ), 556009-4178 Postal address: SE-105 45 Stockholm, Sweden Visiting address: S:t Göransgatan 143, Stockholm Telephone: +46 (0)8 738 60 00 Website: www.electroluxgroup.com
- 32. Shape living for the better Electrolux shapes living for the better by reinventing taste, care and wellbeing experiences, making life more enjoyable and sustainable for millions of people. As a leading global appliance company, we place the consumer at the heart of everything we do. Through our brands, including Electrolux, AEG, and Frigidaire, we sell more than 60 million household and professional products in more than 150 markets every year. In 2018, Electrolux had sales of SEK 124 billion and employed 54,000 people around the world. For more information, go to www.electroluxgroup.com.