5 New Rules of Transportation
•
1 j'aime•1,461 vues

The old rules of transportation are in the wind! Catch up on the new rules, and learn how the global and logistics markets are being affected.
Recommandé

Recommandé
Contenu connexe
Similaire à 5 New Rules of Transportation
Similaire à 5 New Rules of Transportation (20)
Plus de Elemica
Plus de Elemica (20)
Dernier
Dernier (20)
5 New Rules of Transportation
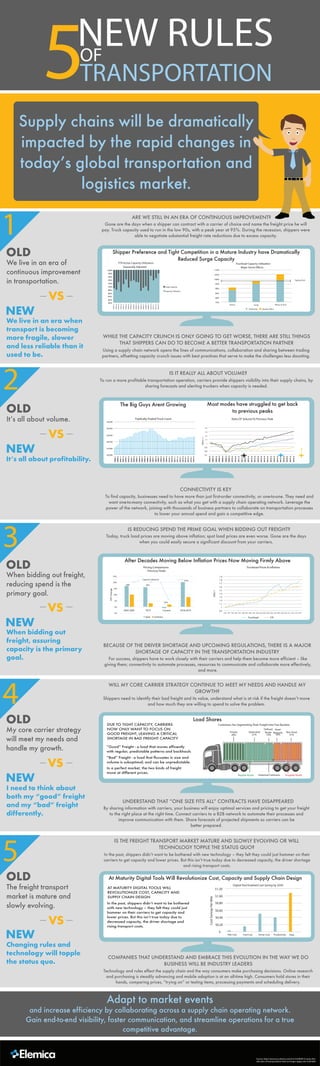
- 1. 5NEW RULES TRANSPORTATION OF We live in an era when transport is becoming more fragile, slower and less reliable than it used to be. 1 2 3 4 5 OLD NEW We live in an era of continuous improvement in transportation. It’s all about profitability. OLD NEW It’s all about volume. When bidding out freight, assuring capacity is the primary goal. OLD NEW When bidding out freight, reducing spend is the primary goal. I need to think about both my “good” freight and my “bad” freight differently. OLD NEW My core carrier strategy will meet my needs and handle my growth. Changing rules and technology will topple the status quo. OLD NEW The freight transport market is mature and slowly evolving. ARE WE STILL IN AN ERA OF CONTINUOUS IMPROVEMENT? FTR Active Capacity Utilization Truckload Capacity Utilization Using a supply chain network opens the lines of communications, collaboration and sharing between trading partners, offsetting capacity crunch issues with best practices that serve to make the challenges less daunting. To run a more profitable transportation operation, carriers provide shippers visibility into their supply chains, by sharing forecasts and alerting truckers when capacity is needed. To find capacity, businesses need to have more than just first-order connectivity, or one-to-one. They need and want one-to-many connectivity, such as what you get with a supply chain operating network. Leverage the power of the network, joining with thousands of business partners to collaborate on transportation processes to lower your annual spend and gain a competitive edge. CONNECTIVITY IS KEY For success, shippers have to work closely with their carriers and help them become more efficient – like giving them; connectivity to automate processes, resources to communicate and collaborate more effectively, and more. Today, truck load prices are moving above inflation; spot load prices are even worse. Gone are the days when you could easily secure a significant discount from your carriers. BECAUSE OF THE DRIVER SHORTAGE AND UPCOMING REGULATIONS, THERE IS A MAJOR SHORTAGE OF CAPACITY IN THE TRANSPORTATION INDUSTRY By sharing information with carriers, your business will enjoy optimal services and pricing to get your freight to the right place at the right time. Connect carriers to a B2B network to automate their processes and improve communication with them. Share forecasts of projected shipments so carriers can be better prepared. Shippers need to identify their bad freight and its value, understand what is at risk if the freight doesn’t move and how much they are willing to spend to solve the problem. Technology and rules effect the supply chain and the way consumers make purchasing decisions. Online research and purchasing is steadily advancing and mobile adoption is at an all-time high. Consumers hold stores in their hands, comparing prices, “trying on” or testing items, processing payments and scheduling delivery. UNDERSTAND THAT “ONE SIZE FITS ALL” CONTRACTS HAVE DISAPPEARED WILL MY CORE CARRIER STRATEGY CONTINUE TO MEET MY NEEDS AND HANDLE MY GROWTH? IS THE FREIGHT TRANSPORT MARKET MATURE AND SLOWLY EVOLVING OR WILL TECHNOLOGY TOPPLE THE STATUS QUO? COMPANIES THAT UNDERSTAND AND EMBRACE THIS EVOLUTION IN THE WAY WE DO BUSINESS WILL BE INDUSTRY LEADERS Most modes have struggled to get back to previous peaks 2006.4 2007.2 2007.4 2008.4 2009.2 2009.4 2010.4 2011.2 2008.2 2010.2 2011.4 2012.2 2013.2 2013.4 2012.4 2014.2 2015.2 2015.4 2014.4 2016.2 2016.4 2017.4 2017.2 2018.2 2019.2 2019.4 2018.4 1.4 1.3 1.2 1.1 1 0.9 0.8 0.7 2006.4=1 ? 25% 20% 15% 10% 5% 0% -5% YOYChange Capacity Utilization .98% .99% .95% 105% 2004-2005 2014 Current 2018-2019 Spot Contract Pricing Comparisons - Previous Peaks Private 38% Dedicated 21% Defined Route 10% Asset Network 10% Non Asset 21% Historical Contracts Irregular RouteRegular Route Load Shares Customers Are Segmenting Their Freight Into Two Buckets $1.20 $1.00 $0.80 $0.60 $0.40 $0.20 $- CostSavingsPerMile Risk Cost Fuel Cost Driver Cost Productivity Total Digital-Tool Enabled Cost Saving by 2030 AT MATURITY DIGITAL TOOLS WILL REVOLUTIONIZE COST, CAPACITY AND SUPPLY CHAIN DESIGN In the past, shippers didn’t want to be bothered with new technology – they felt they could just hammer on their carriers to get capacity and lower prices. But this isn’t true today due to decreased capacity, the driver shortage and rising transport costs. Source: http://resources.elemica.com/h/i/223009014-series-five- old-rules-of-transportation-that-no-longer-apply-rule-5/201809 After Decades Moving Below Inflation Prices Now Moving Firmly Above 1.9 1.8 1.7 1.6 1.5 1.4 1.3 1.2 1.1 1 0.9 1992-1 1993 1994 1995 1996 1997 19981999 2000 2001 2002 2003 2004 2005 2006 2007 2008 2009 2010 2011 2012 2013 2014 Truckload CPI Adapt to market events and increase efficiency by collaborating across a supply chain operating network. Gain end-to-end visibility, foster communication, and streamline operations for a true competitive advantage. IS IT REALLY ALL ABOUT VOLUME? WHILE THE CAPACITY CRUNCH IS ONLY GOING TO GET WORSE, THERE ARE STILL THINGS THAT SHIPPERS CAN DO TO BECOME A BETTER TRANSPORTATION PARTNER IS REDUCING SPEND THE PRIME GOAL WHEN BIDDING OUT FREIGHT? In the past, shippers didn’t want to be bothered with new technology – they felt they could just hammer on their carriers to get capacity and lower prices. But this isn’t true today due to decreased capacity, the driver shortage and rising transport costs. VS VS VS VS VS 2000.1 2000.3 2001.1 2002.1 2002.3 2003.1 2004.3 2005.1 2001.3 2004.1 2005.3 2006.1 2007.1 2007.3 2006.3 2008.1 2009.3 2010.1 2009.1 2010.3 2011.1 2012.1 2011.3 2012.3 2013.3 2014.1 2013.1 2003.3 2014.3 2008.3 55,000 50,000 45,000 40,000 35,000 30,000 The Big Guys Arent Growing Ratio Of Volume To Previous Peak Supply chains will be dramatically impacted by the rapid changes in today’s global transportation and logistics market. Gone are the days when a shipper can contract with a carrier of choice and name the freight price he will pay. Truck capacity used to run in the low 90s, with a peak year at 95%. During the recession, shippers were able to negotiate substantial freight rate reductions due to excess capacity. 100% 98% 96% 94% 92% 90% 88% 86% 84% 82% 80% 1992.1 1993.2 1994.3 1997.1 1998.2 1999.3 2002.1 2003.2 1995.4 2000.4 2004.3 2005.4 2008.2 2009.3 2007.1 2010.4 2013.2 2014.3 2012.1 Surge Capacity Capacity Utilization 90% 85% 80% 75% 95% 100% 105% 110% Tipping Point Katrina Sandy Winter of 2014 Underlying Weather Effect Publically-Traded Truck Count Shipper Preference and Tight Competition in a Mature Industry have Dramatically Reduced Surge Capacity Major Storm EffectsSeasonally Adjusted DUE TO TIGHT CAPACITY, CARRIERS NOW ONLY WANT TO FOCUS ON GOOD FREIGHT, LEAVING A CRITICAL SHORTAGE IN BAD FREIGHT CAPACITY In a perfect market, the two kinds of freight move at different prices. Truckload Prices & Inflation At Maturity Digital Tools Will Revolutionize Cost, Capacity and Supply Chain Design “Good” Freight - a load that moves efficently with regular, predictable patterns and backhauls “Bad” Freight - a load that flucuates in size and volume is suboptimal; and can be unpredictable.