Phase Diagram:One Component System
•Télécharger en tant que PPTX, PDF•
8 j'aime•7,755 vues

Gibbs Phase Rule, Application of Gibbs Phase Rule to Unary Phase Diagram. Reference: Material Science and Engineering, William Callister

Recommandé
Contenu connexe
Tendances
Tendances (20)
Similaire à Phase Diagram:One Component System
Similaire à Phase Diagram:One Component System (20)
Plus de Manipal Academy of Higher Education (MAHE)
Plus de Manipal Academy of Higher Education (MAHE) (20)
Dernier
Dernier (20)
Phase Diagram:One Component System
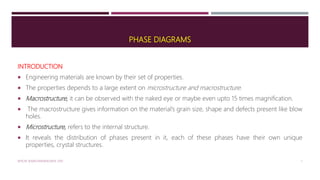
- 1. PHASE DIAGRAMS INTRODUCTION Engineering materials are known by their set of properties. The properties depends to a large extent on microstructure and macrostructure. Macrostructure, it can be observed with the naked eye or maybe even upto 15 times magnification. The macrostructure gives information on the material’s grain size, shape and defects present like blow holes. Microstructure, refers to the internal structure. It reveals the distribution of phases present in it, each of these phases have their own unique properties, crystal structures. MTE/III SEMESTER/MSE/MTE 2101 1
- 2. The nature and occurrence of these phases depends on: i. Temperature ii. Pressure iii. Composition A PHASE DIAGRAM IS ESSENTIALLY A GRAPHICALLY REPRESENTATION OF AN ALLOY DIAGRAMS ARE ALSO CALLED AS “EQUILIBRIUM DIAGRAMS” OR “CONSTITUTIONAL DIAGRAMS”. MTE/III SEMESTER/MSE/MTE 2101 2
- 3. CLASSIFICATION OF PHASE DIAGRAMS Based on the number of components in the system Unary phase diagrams - 1 component systems Binary phase diagrams - 2 component systems Tertiary phase diagrams - 3 component systems Ternary phase diagrams – 4 component systems MTE/III SEMESTER/MSE/MTE 2101 3
- 4. GIBB’S PHASE RULE Josiah Willard Gibbs (1839–1903) Gibbs developed the phase rule in 1875–1876. This rule enables to compute the number of phases that can co-exist in equilibrium in a chosen system. n + C = F + P Where P = Number of Phases F = Number of degrees of freedom C = Number of components in the system n = Number of external factors used for the study MTE/III SEMESTER/MSE/MTE 2101 4
- 5. Degrees of Freedom, F: The number of degrees of freedom of a system is the number of variables that can be changed independently without causing disappearance of phase. Components, C: The elements or compounds that constitute the alloy system. Ex: Fe-Ni alloy system is a two component (binary) system Cu-Ni-Zn in German Silver is a three component (tertiary) system Al-Cu-Mn-Mg in Duralumin is a four component (ternary) system. Number of External Factors, n: It is simply an integral number which represents the number of external factors like temperature and pressure used during construction (study) of phase Generally n = 2. So, the phase rule is written as 2+C = F+P MTE/III SEMESTER/MSE/MTE 2101 5
- 6. If the effect of pressure is ignored and assumed to be 1atm (as it remains constant), only temperature is the external factor. So, n=1. The Phase Rule becomes P+F = C+1 (Modified Gibb’s Phase Rule) MTE/III SEMESTER/MSE/MTE 2101 6
- 7. UNARY PHASE DIAGRAM (ONE COMPONENT SYSTEM) The simplest and easiest type of phase diagram to understand is that for a one-component system, in which composition is held constant (i.e., the phase diagram is for a pure substance); this means that pressure and temperature are the variables. This one-component phase diagram (or unary phase diagram) [sometimes also called a pressure– temperature (or P–T) diagram] is represented as a two-dimensional plot of pressure (ordinate, or vertical axis) versus temperature (abscissa, or horizontal axis). Illustration and demonstration of this phase diagram is done taking example of H₂O . MTE/III SEMESTER/MSE/MTE 2101 7
- 8. MTE/III SEMESTER/MSE/MTE 2101 8 Pic Courtesy: Material Science and Engineering, Callister
- 9. DESCRIPTION Three different phases—solid, liquid, and vapour—are delineated on the plot. Each of the phases will exist under equilibrium conditions over the temperature–pressure ranges of its corresponding area. The three curves shown on the plot (labelled aO, bO, and cO) are phase boundaries; at any point on of these curves, the two phases on either side of the curve are in equilibrium (or coexist) with one another. That is, equilibrium between solid and vapour phases is along curve aO—likewise for the solid-liquid, curve bO, and the liquid-vapour, curve cO. MTE/III SEMESTER/MSE/MTE 2101 9
- 10. Also, upon crossing a boundary (as temperature and/or pressure is altered), one phase transforms to another. All three of the phase boundary curves intersect at a common point, which is labelled O (and for H₂O system, at a temperature of 273.16 K and a pressure of 6.04×10⁻³atm). This means that at this point only, all of the solid, liquid, and vapour phases are simultaneously in equilibrium with one another. This point is called as “Triple Point” or “Invariant Point”. Point c is called as “critical point”. MTE/III SEMESTER/MSE/MTE 2101 10
- 11. APPLICATION OF GIBB’S PHASE RULE FOR A ONE-COMPONENT SYSTEM For one-component system, C = 1, n = 2 (pressure & temperature). Hence, the Gibb’s phase rule becomes: P + F = C + n P + F = 1 + 2 F = 3 – P MTE/III SEMESTER/MSE/MTE 2101 11
- 12. Gibb’s phase rule applied to single-phase region (P = 1) Let a point “A” be marked in a single phase region. The temperature and pressure at ‘A’ are ‘TA’ & ‘PA’ respectively. Degrees of Freedom = 2 (as both temperature and pressure can be varied without any change in the phase). Applying Gibb’s Phase Rule: F = 3 – P = 3 – 1 = 2 Number of degrees of freedom = 2. MTE/III SEMESTER/MSE/MTE 2101 12 Fig: Schematic unary phase diagram for magnesium, showing the melting and boiling temperatures at one atmosphere pressure. On this diagram, point X is the triple point. Pic courtesy: Science and Engineering of Materials, Donald Askeland, Pradeep Phule
- 13. In the same way, Gibb’s phase rule can be applied to two phase region (Point B) and three phase region (Point X) . MTE/III SEMESTER/MSE/MTE 2101 13