SlideShare une entreprise Scribd logo
1  sur  10
VALOR PRESENTE NETO


∑INVERSION:                                 9 AÑOS
∑INVERSION FINANCIERA:                    250,000.00


 VPN=     FC1        +      FC2       +     FC3        …    FCN        - IO
         (1+R)N            (1+R)N          (1+R)N          (1+R)N


   R=         0.07


 VPN=   (1,038.25) +      12,498.46   +   29,876.44        45,763.33    +     65,864.29 +   71,696.10 +   79,849.27 +   87,779.17 +   86,334.40 - 158.148,75
           1.07             1.14            1.23            1.31                1.4           1.5          1.61          1.72          1.84

 VPN=     (970.33) +      10,916.63 +     24,388.08 +      34,912.62    +     46,960.33 +   47,774.14 +   49,726.11 +   51,088.28 +   46,960.20 - 158.148,75


 VPN= 153,607.32         EL PROYECTO ES RENTABLE
POLICÍA MUNICIPAL MUNICIPIO JUAN JOSÉ MORA

                                                     FLUJO DE EFECTIVO


PERIODOS                          2010        2011         2012        2013        2014        2015        2016         2017         2018
UTILIDAD NETA                   -10,509.25   12,028.46    30,158.44   46,827.33   69,913.29   77,620.10   86,707.27    95,773.17    94,865.40
DEPRECIACION                     9,471.00    9,471.00     9,471.00    9,471.00    9,471.00     9,471.00    9,471.00     9,471.00     9,471.00
SUB-TOTAL
MAS:
LIMITACION CTAS. POR COBRAR
AUMENTO CTAS. POR COBRAR
MENOS:
AUMENTO CTAS. POR COBRAR
DISMINUCION CTAS. POR PAGAR
EFECTIVO NETO USADO              -1,038.25   21,499.46    39,629.44   56,298.33   79,384.29   87,091.10   96,178.27   105,244.17   104,336.40
ACTIVIDADES DE INVERSION
MAS:
DISMINUCUION DE PROPIEDADES Y
EQUIPOS
MENOS:
AUMENTO DE PROPIEDADES Y
EQUIPOS                                       9,001.00     9,753.00   10,535.00   13,520.00   15,395.00   16,329.00   17,465.00   18,002.00
EFECTIVO NETO USADO                          (9,001.00)   (9,753.00) (10,535.00) (13,520.00) (15,395.00) (16,329.00) (17,465.00) (18,002.00)
ACTIVIDADES DE FIANCIAMIENTO
MAS:
AUMENTO DE FINANCIAMIENTO              -      9,001.00     9,753.00   10,535.00   13,520.00   15,395.00   16,329.00   17,465.00    18,002.00
MENOS:
DISMINUCION DE FINANCIAMIENTO
EFECTIVO NETO PROVISTO DE
FINANCIAMIENTO                                9,001.00     9,753.00   10,535.00   13,520.00   15,395.00   16,329.00   17,465.00    18,002.00
TOTAL FLUJO DE CAJA             (1,038.25)   12,498.46    29,876.44   45,763.33   65,864.29   71,696.10   79,849.27   87,779.17    86,334.40
ESTADO DE RESULTADO PROYECTADO
                              EMPRESA HELADERIA INDUSTRIAL DE PUERTO CABELLO, S.A.

                                                           DEL 2003 AL 2011


      INGRESOS POR SERVICIO          2010        2011        2012       2013       2014       2015            2016         2017         2018
INGRESOS NETOS                      40,000.00   65,000.00   84,000.00 102,000.00 126,000.00 140,233.01      150,383.01   160,533.01   170,683.01
COSTOS Y GASTOS
INSUMOS                                 79.75   84.54           86.23       88.81      90.59       103.27      105.34       107.44       128.93
GASTOS DE ENERGIA ELECTRICA            960.00 1,017.60       1,037.95    1,069.09 1,090.47       1,243.14    1,268.00     1,293.36     1,552.03
PERSONAL                            30,000.00 31,800.00     32,436.00   33,409.08 34,077.26     38,848.08   39,625.04    40,417.54    48,501.05
DEPRECIACION VEHÍCULOS               9,471.00   9,471.00     9,471.00    9,471.00   9,471.00     9,471.00     9,471.00     9,471.00     9,471.00
COSTOS VARIABLES
ALQUILER DEL LOCAL                     720.00  763.20          778.46      801.82      817.85      932.35      951.00       970.02     1,164.03
MANTENIMIENTO DE EQUIPO              1,578.50 1,673.21       1,706.67    1,757.87    1,793.03    2,044.06    2,084.94     2,126.64     2,551.96
GASTOS (FINANCIAMIENTO)              7,700.00 8,162.00       8,325.24    8,575.00    8,746.50    9,971.01   10,170.43    10,373.84    12,448.60
IMPUESTO MUNICIPALES
UTILIDAD NETA ANTES DEL I.S.R.L.   (10,509.25) 12,028.46    30,158.44   46,827.33   69,913.29   77,620.10   86,707.27    95,773.17    94,865.40
I.S.R.L.
UTILIDAD NETA                      -10,509.25   12,028.46   30,158.44   46,827.33   69,913.29   77,620.10    86,707.27    95,773.17    94,865.40
Modelo Económico
                                       Presupuesto de Inversión
                         Monto a Financiar
      Descripción              2010          Aportes Propios         Total Bs.
Insumos                          79,750.00          0                       79,750.00
Maquinarias y Equipos                    -                                       0.00
Equipos de Seguridad            137,500.00          0                      137,500.00
Vehículos                    38,500,000.00                              38,500,000.00
Equipos de Comput.               30,000.00                                  30,000.00
Uniformes del Personal           10,000.00                                  10,000.00
Mobiliario y Equipos             82,500.00                                  82,500.00


                             38,839,750.00

COSTO DE
MANTENIMIENTO DE
EQUIPOS                        38,667,500.00
ESTIMADO 1% 1er AÑO               386,675.00
GASTOS ENERGIA
ELECTRICA                          12,000.00
50 PERSONAS S/MINIMO         75,000.00
ALQUILER DEL LOCAL           6,000.00
FINANCIAMIENTO                  -
ESTIMADO 7% 1er AÑO             -

DEPRECIACIÓN 15 AÑOS       2,320,050.00


         38,839,750.00              100.00% APORTE FINANCIADO
     38,839,750.00


                                                                                        INGRESOS POR
        Años                                   PRESTACIÓN SERVICIO     P/U                SERVICIO

         2010                                      10,000.00           14.02             140,233.01

         2011                                      10,500.00           14.32             150,383.01

         2012                                      11,000.00           14.59             160,533.01

         2013                                      11,500.00           14.84             170,683.01
CALCULO DEL COEFICIENTE DE VARIANZA ESTANDAR

Y=       Ingresos por Servicio Prestado                             8
X=       Cantidades de unidades promedio 20% Operativas 80% Recaudación


 ∑X2 =                                269,500,000.00
 S2 =                              19,954,574,433.66
 N=                                             5.00
 X=                                        36,000.00


             ∑X2              S2                                                                   1                  S2
 Sb1=                     *                                                    Sb2=                               *

          N*∑X *(X)
               2     2
                                                                                            ∑X - 1 (X)
                                                                                               2         2

                                                                                                 N


                    269,500,000.00                         19.954.574.433,66                            1                      19.954.574.433,66
 Sb1=                                                  *
                                                                               Sb2=                                        *

           5 * 269.500.000,00 * (36.000,00)2                                          269.500.000,00 - 1 * (36.000,00) 2
                                                                                                    5

                    269,500,000.00                         19.954.574.433,66                            1                      19.954.574.433,66
 Sb1=                                                  *
                                                                               Sb2=                                        *

          1.347.500.000,00 * 1.296.000.000,00                                         269.500.000,00 - 1 * (36.000,00) 2
                                                                                                    5

                    269,500,000.00                         19.954.574.433,66                            1                     19.954.574.433,66
 Sb1=                                                  *
                                                                               Sb2=                                         *

             1,746,360,000,000,000,000.00                                             269.500.000,00 - 1 * 1.296.000.000,00
                                                                                                    5

 Sb1=               0.000000000154                         19.954.574.433,66                           1                       19.954.574.433,66
                                                       *                       Sb2=                                        *

                                                                                        269.500.000,00 - 259.200.000,00
 Sb1=              3.07
                                                                                                          1                    19.954.574.433,66
                                                                               Sb2=                                        *
                                                                                                    10,300,000.00

                                                                               Sb1=                0.000000097087          *
                                                                                                                               19.954.574.433,66

                                                                               Sb1=                    1,937.33
CALCULO DEL ERROR ESTANDAR DE ESTIMACIÓN

Y=                 Ingresos por Prestación del Servicio                                         8
X=                 Cantidades de unidades promedio 20% Operativas 80% Recaudación

     Año                    X                        Y                 XY                X²                y²
     2003                 5000                         40,000.00     200,000,000.00 25,000,000.00     1,600,000,000.00
     2004                 6500                         65,000.00     422,500,000.00 42,250,000.00     4,225,000,000.00
     2005                 7000                         84,000.00     588,000,000.00 49,000,000.00     7,056,000,000.00
     2006                 8500                        102,000.00     867,000,000.00 72,250,000.00    10,404,000,000.00
     2007                 9000                        126,000.00   1,134,000,000.00 81,000,000.00    15,876,000,000.00
      Σ                   36000                       417,000.00   3,211,500,000.00 269,500,000.00   39,161,000,000.00

     B2 =                                           20.30
     B1 =                                      -62,766.99
     Y=                                         83,400.00
     X=                                         7,200.00

                           ∑ e 12
     S2 =
                          N -2

        e12 = ∑ Y2 - B1∑ Y- B2 ∑ (XY)
                                         26,173,834,951.46       -5,471,111,650.49
        e12 = 39.161.000.000,00 - (-62.766,99)(417.000,00) - 20,30(269.500.000,00)

        e 12 =         39,161,000,000.00 + 26.173.834.951,46 - 5.471.111.650,49

        e 12 =         59,863,723,300.97

            S2 =                59,863,723,300.97
                                      3.00

            S2 =       19,954,574,433.66


            S=          141,260.66
MODELO ECONÒMICO

FORMULAS BASICAS

Ŷ = B1 ± B2 + U
          __
B1 = Ŷ - B2 (X)

B2 =               N Σ (XY) - Σ X . ΣY
                     N Σ X² - Σ (X)²

DETERMINACION DE VARIABLES

Y=            Ingresos por prestación del servicio                                        8
X=            Cantidades de unidades promedio 20% servicio 80% recaudación

 Año               X               Y                  XY                       X²
 2010             5000            40,000.00       200,000,000.00              25,000,000.00
 2011             6500            65,000.00       422,500,000.00              42,250,000.00
 2012             7000            84,000.00       588,000,000.00              49,000,000.00
 2013             8500           102,000.00       867,000,000.00              72,250,000.00
 2014             9000           126,000.00     1,134,000,000.00              81,000,000.00
     Σ            36000          417,000.00     3,211,500,000.00          269,500,000.00

       B2 = N ∑ (XY) - ∑ X .           ∑Y
            N ∑ X2 - ∑ (X) 2

       B2 =                      5 (3.211500.000,00) - (36.000,00 x 417.000,00)
                                          5 (269.500.000,00) - (36.000,00)2

       B2 =         16,057,500,000.00                    -                    15,012,000,000.00
                    1,347,500,000.00                                          1,296,000,000.00

       B2 =                            1,045,500,000.00
                                         51,500,000.00

       B2 =                      20.30              20.30097087


         Y=                       ∑Y
N

Y=               417,000.00
                     5

Y=               83,400.00


X=                  ∑X
                    N

X=               36,000.00
                     5

X=                7,200.00


     B1 =   Y - B2. (X)

     B1 =           83,400.00   -   20.30                 7,200.00

     B1 =           83,400.00   -   146,166.99

     B1 =          -62,766.99


     Ŷ=     B1                  ⁺   B2 X + μ

     Ŷ=            -62,766.99   +           20.30097087   X +μ
Proyección


                                              Ŷ=   -62,766.99 +    20.30       X +μ
 Año      X          Y

 2010   10,000.00   140,233.01     Ŷ año 2008 =    -62,766.99 +    20.30       10,000.00

 2011   10,500.00   150,383.01

 2012   11,000.00   160,533.01     Ŷ año 2008 =    -62,766.99 +   203,000.00

 2013   11,500.00   170,683.01

Total   43,000.00   621,832.04     Ŷ año 2008 =    140,233.01


                                   Ŷ año 2009 =    -62,766.99 +    20.30       10,500.00


                                   Ŷ año 2009 =    -62,766.99 +   213,150.00


                                   Ŷ año 2009 =    150,383.01


                                   Ŷ año 2010 =    -62,766.99 +    20.30       11,000.00


                                   Ŷ año 2010 =    -62,766.99 +   223,300.00


                                   Ŷ año 2010 =    160,533.01
Ŷ año 2011 =   -62,766.99 +    20.30       11,500.00


Ŷ año 2011 =   -62,766.99 +   233,450.00


Ŷ año 2011 =   170,683.01

Contenu connexe

Tendances

KA6564 Assignment 3
KA6564 Assignment 3KA6564 Assignment 3
KA6564 Assignment 3armada7000
 
2008 annual audited financial statements
2008 annual audited financial statements2008 annual audited financial statements
2008 annual audited financial statementsProphecy Corp
 
SPICE MODEL of SCS110AG , TC=25degree , LTspice (Professional Model) in SPICE...
SPICE MODEL of SCS110AG , TC=25degree , LTspice (Professional Model) in SPICE...SPICE MODEL of SCS110AG , TC=25degree , LTspice (Professional Model) in SPICE...
SPICE MODEL of SCS110AG , TC=25degree , LTspice (Professional Model) in SPICE...Tsuyoshi Horigome
 
SPICE MODEL of SCS110AG , TC=75degree , PSpice (Professional Model) in SPICE ...
SPICE MODEL of SCS110AG , TC=75degree , PSpice (Professional Model) in SPICE ...SPICE MODEL of SCS110AG , TC=75degree , PSpice (Professional Model) in SPICE ...
SPICE MODEL of SCS110AG , TC=75degree , PSpice (Professional Model) in SPICE ...Tsuyoshi Horigome
 
SPICE MODEL of SCS110AG , TC=125degree , LTspice (Professional Model) in SPIC...
SPICE MODEL of SCS110AG , TC=125degree , LTspice (Professional Model) in SPIC...SPICE MODEL of SCS110AG , TC=125degree , LTspice (Professional Model) in SPIC...
SPICE MODEL of SCS110AG , TC=125degree , LTspice (Professional Model) in SPIC...Tsuyoshi Horigome
 
15a transição 2001-2009
15a transição 2001-200915a transição 2001-2009
15a transição 2001-2009Edinho Silva
 
SPICE MODEL of SCS110AG , TC=-25degree , LTspice (Professional Model) in SPIC...
SPICE MODEL of SCS110AG , TC=-25degree , LTspice (Professional Model) in SPIC...SPICE MODEL of SCS110AG , TC=-25degree , LTspice (Professional Model) in SPIC...
SPICE MODEL of SCS110AG , TC=-25degree , LTspice (Professional Model) in SPIC...Tsuyoshi Horigome
 
SPICE MODEL of SCS110AG , TC=125degree , LTspice (Standard Model) in SPICE PARK
SPICE MODEL of SCS110AG , TC=125degree , LTspice (Standard Model) in SPICE PARKSPICE MODEL of SCS110AG , TC=125degree , LTspice (Standard Model) in SPICE PARK
SPICE MODEL of SCS110AG , TC=125degree , LTspice (Standard Model) in SPICE PARKTsuyoshi Horigome
 
SPICE MODEL of SCS110AG , TC=25degree , LTspice (Standard Model) in SPICE PARK
SPICE MODEL of SCS110AG , TC=25degree , LTspice (Standard Model) in SPICE PARKSPICE MODEL of SCS110AG , TC=25degree , LTspice (Standard Model) in SPICE PARK
SPICE MODEL of SCS110AG , TC=25degree , LTspice (Standard Model) in SPICE PARKTsuyoshi Horigome
 
SPICE MODEL of SCS110AG , TC=-25degree , PSpice (Standard Model) in SPICE PARK
SPICE MODEL of SCS110AG , TC=-25degree , PSpice (Standard Model) in SPICE PARKSPICE MODEL of SCS110AG , TC=-25degree , PSpice (Standard Model) in SPICE PARK
SPICE MODEL of SCS110AG , TC=-25degree , PSpice (Standard Model) in SPICE PARKTsuyoshi Horigome
 
SPICE MODEL of SCS110AG , TC=75degree , LTspice (Professional Model) in SPICE...
SPICE MODEL of SCS110AG , TC=75degree , LTspice (Professional Model) in SPICE...SPICE MODEL of SCS110AG , TC=75degree , LTspice (Professional Model) in SPICE...
SPICE MODEL of SCS110AG , TC=75degree , LTspice (Professional Model) in SPICE...Tsuyoshi Horigome
 
Future wind power forecast errors, and associated costs in the Swedish power ...
Future wind power forecast errors, and associated costs in the Swedish power ...Future wind power forecast errors, and associated costs in the Swedish power ...
Future wind power forecast errors, and associated costs in the Swedish power ...Winterwind
 
SPICE MODEL of SCS110AG , TC=125degree , PSpice (Standard Model) in SPICE PARK
SPICE MODEL of SCS110AG , TC=125degree , PSpice (Standard Model) in SPICE PARKSPICE MODEL of SCS110AG , TC=125degree , PSpice (Standard Model) in SPICE PARK
SPICE MODEL of SCS110AG , TC=125degree , PSpice (Standard Model) in SPICE PARKTsuyoshi Horigome
 
SPICE MODEL of SCS110AG , TC=75degree , PSpice (Standard Model) in SPICE PARK
SPICE MODEL of SCS110AG , TC=75degree , PSpice (Standard Model) in SPICE PARKSPICE MODEL of SCS110AG , TC=75degree , PSpice (Standard Model) in SPICE PARK
SPICE MODEL of SCS110AG , TC=75degree , PSpice (Standard Model) in SPICE PARKTsuyoshi Horigome
 

Tendances (18)

KA6564 Assignment 3
KA6564 Assignment 3KA6564 Assignment 3
KA6564 Assignment 3
 
Lesson 19: Analyzing Cash Flow
Lesson 19: Analyzing Cash FlowLesson 19: Analyzing Cash Flow
Lesson 19: Analyzing Cash Flow
 
fr05_scf
fr05_scffr05_scf
fr05_scf
 
2008 annual audited financial statements
2008 annual audited financial statements2008 annual audited financial statements
2008 annual audited financial statements
 
2 Sfy 10 Detail Budget
2 Sfy 10 Detail Budget2 Sfy 10 Detail Budget
2 Sfy 10 Detail Budget
 
Ghana library expenses and revenue 2008-10
Ghana library expenses and revenue 2008-10Ghana library expenses and revenue 2008-10
Ghana library expenses and revenue 2008-10
 
SPICE MODEL of SCS110AG , TC=25degree , LTspice (Professional Model) in SPICE...
SPICE MODEL of SCS110AG , TC=25degree , LTspice (Professional Model) in SPICE...SPICE MODEL of SCS110AG , TC=25degree , LTspice (Professional Model) in SPICE...
SPICE MODEL of SCS110AG , TC=25degree , LTspice (Professional Model) in SPICE...
 
SPICE MODEL of SCS110AG , TC=75degree , PSpice (Professional Model) in SPICE ...
SPICE MODEL of SCS110AG , TC=75degree , PSpice (Professional Model) in SPICE ...SPICE MODEL of SCS110AG , TC=75degree , PSpice (Professional Model) in SPICE ...
SPICE MODEL of SCS110AG , TC=75degree , PSpice (Professional Model) in SPICE ...
 
SPICE MODEL of SCS110AG , TC=125degree , LTspice (Professional Model) in SPIC...
SPICE MODEL of SCS110AG , TC=125degree , LTspice (Professional Model) in SPIC...SPICE MODEL of SCS110AG , TC=125degree , LTspice (Professional Model) in SPIC...
SPICE MODEL of SCS110AG , TC=125degree , LTspice (Professional Model) in SPIC...
 
15a transição 2001-2009
15a transição 2001-200915a transição 2001-2009
15a transição 2001-2009
 
SPICE MODEL of SCS110AG , TC=-25degree , LTspice (Professional Model) in SPIC...
SPICE MODEL of SCS110AG , TC=-25degree , LTspice (Professional Model) in SPIC...SPICE MODEL of SCS110AG , TC=-25degree , LTspice (Professional Model) in SPIC...
SPICE MODEL of SCS110AG , TC=-25degree , LTspice (Professional Model) in SPIC...
 
SPICE MODEL of SCS110AG , TC=125degree , LTspice (Standard Model) in SPICE PARK
SPICE MODEL of SCS110AG , TC=125degree , LTspice (Standard Model) in SPICE PARKSPICE MODEL of SCS110AG , TC=125degree , LTspice (Standard Model) in SPICE PARK
SPICE MODEL of SCS110AG , TC=125degree , LTspice (Standard Model) in SPICE PARK
 
SPICE MODEL of SCS110AG , TC=25degree , LTspice (Standard Model) in SPICE PARK
SPICE MODEL of SCS110AG , TC=25degree , LTspice (Standard Model) in SPICE PARKSPICE MODEL of SCS110AG , TC=25degree , LTspice (Standard Model) in SPICE PARK
SPICE MODEL of SCS110AG , TC=25degree , LTspice (Standard Model) in SPICE PARK
 
SPICE MODEL of SCS110AG , TC=-25degree , PSpice (Standard Model) in SPICE PARK
SPICE MODEL of SCS110AG , TC=-25degree , PSpice (Standard Model) in SPICE PARKSPICE MODEL of SCS110AG , TC=-25degree , PSpice (Standard Model) in SPICE PARK
SPICE MODEL of SCS110AG , TC=-25degree , PSpice (Standard Model) in SPICE PARK
 
SPICE MODEL of SCS110AG , TC=75degree , LTspice (Professional Model) in SPICE...
SPICE MODEL of SCS110AG , TC=75degree , LTspice (Professional Model) in SPICE...SPICE MODEL of SCS110AG , TC=75degree , LTspice (Professional Model) in SPICE...
SPICE MODEL of SCS110AG , TC=75degree , LTspice (Professional Model) in SPICE...
 
Future wind power forecast errors, and associated costs in the Swedish power ...
Future wind power forecast errors, and associated costs in the Swedish power ...Future wind power forecast errors, and associated costs in the Swedish power ...
Future wind power forecast errors, and associated costs in the Swedish power ...
 
SPICE MODEL of SCS110AG , TC=125degree , PSpice (Standard Model) in SPICE PARK
SPICE MODEL of SCS110AG , TC=125degree , PSpice (Standard Model) in SPICE PARKSPICE MODEL of SCS110AG , TC=125degree , PSpice (Standard Model) in SPICE PARK
SPICE MODEL of SCS110AG , TC=125degree , PSpice (Standard Model) in SPICE PARK
 
SPICE MODEL of SCS110AG , TC=75degree , PSpice (Standard Model) in SPICE PARK
SPICE MODEL of SCS110AG , TC=75degree , PSpice (Standard Model) in SPICE PARKSPICE MODEL of SCS110AG , TC=75degree , PSpice (Standard Model) in SPICE PARK
SPICE MODEL of SCS110AG , TC=75degree , PSpice (Standard Model) in SPICE PARK
 

En vedette

Bibliotheken moeten naar buiten toe
Bibliotheken moeten naar buiten toeBibliotheken moeten naar buiten toe
Bibliotheken moeten naar buiten toeErna Winters
 
2011 How to Prepare for the First Avenue Career & Grad School Fair
2011 How to Prepare for the First Avenue Career & Grad School Fair 2011 How to Prepare for the First Avenue Career & Grad School Fair
2011 How to Prepare for the First Avenue Career & Grad School Fair Mary Beth Snell
 
The Online Stoning of MD & GT: Manifestations of Patriarchal Microaggressions...
The Online Stoning of MD & GT: Manifestations of Patriarchal Microaggressions...The Online Stoning of MD & GT: Manifestations of Patriarchal Microaggressions...
The Online Stoning of MD & GT: Manifestations of Patriarchal Microaggressions...fariez
 
Psychiatric Nurse Practitioners Emr System
Psychiatric Nurse Practitioners Emr SystemPsychiatric Nurse Practitioners Emr System
Psychiatric Nurse Practitioners Emr SystemShai Levit
 
Freshwater Invasions in the Hudson Valley: Causes, Impacts, and Management
Freshwater Invasions in the Hudson Valley: Causes, Impacts, and ManagementFreshwater Invasions in the Hudson Valley: Causes, Impacts, and Management
Freshwater Invasions in the Hudson Valley: Causes, Impacts, and ManagementCary Institute of Ecosystem Studies
 
Floor Plan Presentation
Floor Plan PresentationFloor Plan Presentation
Floor Plan Presentationmqazi
 
_right_ Goozzy TechCrunch presentation
_right_ Goozzy TechCrunch presentation_right_ Goozzy TechCrunch presentation
_right_ Goozzy TechCrunch presentationalarin
 
London’s sights
London’s sightsLondon’s sights
London’s sightsBerezinaNP
 
How to Assess Integrity Risks for a Company ?
How to Assess Integrity Risks for a Company ?How to Assess Integrity Risks for a Company ?
How to Assess Integrity Risks for a Company ?iohann Le Frapper
 
Как стать информационным продюсером
Как стать информационным продюсеромКак стать информационным продюсером
Как стать информационным продюсеромАльберт Коррч
 
Authority and Respect
Authority and RespectAuthority and Respect
Authority and Respectarshiaaziz
 
Wilkinson bosc2010 moby-to-sadi
Wilkinson bosc2010 moby-to-sadiWilkinson bosc2010 moby-to-sadi
Wilkinson bosc2010 moby-to-sadiBOSC 2010
 

En vedette (20)

Guia cinematica caida libre
Guia cinematica caida libreGuia cinematica caida libre
Guia cinematica caida libre
 
Bibliotheken moeten naar buiten toe
Bibliotheken moeten naar buiten toeBibliotheken moeten naar buiten toe
Bibliotheken moeten naar buiten toe
 
2011 How to Prepare for the First Avenue Career & Grad School Fair
2011 How to Prepare for the First Avenue Career & Grad School Fair 2011 How to Prepare for the First Avenue Career & Grad School Fair
2011 How to Prepare for the First Avenue Career & Grad School Fair
 
The Online Stoning of MD & GT: Manifestations of Patriarchal Microaggressions...
The Online Stoning of MD & GT: Manifestations of Patriarchal Microaggressions...The Online Stoning of MD & GT: Manifestations of Patriarchal Microaggressions...
The Online Stoning of MD & GT: Manifestations of Patriarchal Microaggressions...
 
Foto loca
Foto locaFoto loca
Foto loca
 
Psychiatric Nurse Practitioners Emr System
Psychiatric Nurse Practitioners Emr SystemPsychiatric Nurse Practitioners Emr System
Psychiatric Nurse Practitioners Emr System
 
Freshwater Invasions in the Hudson Valley: Causes, Impacts, and Management
Freshwater Invasions in the Hudson Valley: Causes, Impacts, and ManagementFreshwater Invasions in the Hudson Valley: Causes, Impacts, and Management
Freshwater Invasions in the Hudson Valley: Causes, Impacts, and Management
 
Responding to Climate Change at the Local Level
Responding to Climate Change at the Local LevelResponding to Climate Change at the Local Level
Responding to Climate Change at the Local Level
 
Free sample
Free sampleFree sample
Free sample
 
Floor Plan Presentation
Floor Plan PresentationFloor Plan Presentation
Floor Plan Presentation
 
_right_ Goozzy TechCrunch presentation
_right_ Goozzy TechCrunch presentation_right_ Goozzy TechCrunch presentation
_right_ Goozzy TechCrunch presentation
 
London’s sights
London’s sightsLondon’s sights
London’s sights
 
How to Assess Integrity Risks for a Company ?
How to Assess Integrity Risks for a Company ?How to Assess Integrity Risks for a Company ?
How to Assess Integrity Risks for a Company ?
 
Summer grandkids
Summer grandkidsSummer grandkids
Summer grandkids
 
Как стать информационным продюсером
Как стать информационным продюсеромКак стать информационным продюсером
Как стать информационным продюсером
 
Authority and Respect
Authority and RespectAuthority and Respect
Authority and Respect
 
Color Illustrations
Color IllustrationsColor Illustrations
Color Illustrations
 
Wilkinson bosc2010 moby-to-sadi
Wilkinson bosc2010 moby-to-sadiWilkinson bosc2010 moby-to-sadi
Wilkinson bosc2010 moby-to-sadi
 
Innovate or die
Innovate or dieInnovate or die
Innovate or die
 
Architect Cheatsheet
Architect CheatsheetArchitect Cheatsheet
Architect Cheatsheet
 

Similaire à Modelos economicos

Mayo%202010 presupuesto centro
Mayo%202010 presupuesto centroMayo%202010 presupuesto centro
Mayo%202010 presupuesto centrowinstonrivera
 
Mayo de 2010 presupuesto centro
Mayo de 2010 presupuesto centroMayo de 2010 presupuesto centro
Mayo de 2010 presupuesto centrowinstonrivera
 
City Council July 20, 2012 Budget Presentation
City Council July 20, 2012 Budget PresentationCity Council July 20, 2012 Budget Presentation
City Council July 20, 2012 Budget PresentationCity of San Angelo Texas
 
Flujo de caja
Flujo de cajaFlujo de caja
Flujo de cajaacalixtoh
 
111647298 heritage-dolls-case-study-analysis-calc
111647298 heritage-dolls-case-study-analysis-calc111647298 heritage-dolls-case-study-analysis-calc
111647298 heritage-dolls-case-study-analysis-calcFaheem Mukhtar
 
Forecast Vs Actual Budget Powerpoint Presentation Slides
Forecast Vs Actual Budget Powerpoint Presentation SlidesForecast Vs Actual Budget Powerpoint Presentation Slides
Forecast Vs Actual Budget Powerpoint Presentation SlidesSlideTeam
 
Forecast Vs Actual Budget PowerPoint Presentation Slides
Forecast Vs Actual Budget PowerPoint Presentation Slides Forecast Vs Actual Budget PowerPoint Presentation Slides
Forecast Vs Actual Budget PowerPoint Presentation Slides SlideTeam
 
Sgs Sfp 2012 15 C
Sgs Sfp 2012 15 CSgs Sfp 2012 15 C
Sgs Sfp 2012 15 Cmarsfs
 
Senario Analysis for Risk management in Corporate Finance
Senario Analysis for Risk management in Corporate FinanceSenario Analysis for Risk management in Corporate Finance
Senario Analysis for Risk management in Corporate FinanceIman Najafi
 
MPOrtigas_samplecompFlat_ValidMarOnly
MPOrtigas_samplecompFlat_ValidMarOnlyMPOrtigas_samplecompFlat_ValidMarOnly
MPOrtigas_samplecompFlat_ValidMarOnlyBernadette Kitching
 
Spark the rise Recycle e-waste
Spark the rise Recycle e-wasteSpark the rise Recycle e-waste
Spark the rise Recycle e-wasteShivin Tikoo
 
Rendición de cuentas GABO 2013
Rendición de cuentas GABO 2013Rendición de cuentas GABO 2013
Rendición de cuentas GABO 2013Martha De Olarte
 
Actual Cost Vs Plan Projection PowerPoint Presentation Slides
Actual Cost Vs Plan Projection PowerPoint Presentation Slides Actual Cost Vs Plan Projection PowerPoint Presentation Slides
Actual Cost Vs Plan Projection PowerPoint Presentation Slides SlideTeam
 
Pavilion income statement as to Dec 31 2017
Pavilion income statement as to Dec 31 2017Pavilion income statement as to Dec 31 2017
Pavilion income statement as to Dec 31 2017al karajo jr
 
Netscape IPO - Harvard Business Case
Netscape IPO - Harvard Business CaseNetscape IPO - Harvard Business Case
Netscape IPO - Harvard Business CaseKivanc Ozuolmez
 

Similaire à Modelos economicos (20)

Mayo%202010 presupuesto centro
Mayo%202010 presupuesto centroMayo%202010 presupuesto centro
Mayo%202010 presupuesto centro
 
Mayo de 2010 presupuesto centro
Mayo de 2010 presupuesto centroMayo de 2010 presupuesto centro
Mayo de 2010 presupuesto centro
 
City Council July 20, 2012 Budget Presentation
City Council July 20, 2012 Budget PresentationCity Council July 20, 2012 Budget Presentation
City Council July 20, 2012 Budget Presentation
 
Flujo de caja
Flujo de cajaFlujo de caja
Flujo de caja
 
111647298 heritage-dolls-case-study-analysis-calc
111647298 heritage-dolls-case-study-analysis-calc111647298 heritage-dolls-case-study-analysis-calc
111647298 heritage-dolls-case-study-analysis-calc
 
Forecast Vs Actual Budget Powerpoint Presentation Slides
Forecast Vs Actual Budget Powerpoint Presentation SlidesForecast Vs Actual Budget Powerpoint Presentation Slides
Forecast Vs Actual Budget Powerpoint Presentation Slides
 
Forecast Vs Actual Budget PowerPoint Presentation Slides
Forecast Vs Actual Budget PowerPoint Presentation Slides Forecast Vs Actual Budget PowerPoint Presentation Slides
Forecast Vs Actual Budget PowerPoint Presentation Slides
 
Sgs Sfp 2012 15 C
Sgs Sfp 2012 15 CSgs Sfp 2012 15 C
Sgs Sfp 2012 15 C
 
Balance comprobación-diciembre-2011
Balance comprobación-diciembre-2011Balance comprobación-diciembre-2011
Balance comprobación-diciembre-2011
 
Ecsf
EcsfEcsf
Ecsf
 
Accruals 16.02.09
Accruals 16.02.09Accruals 16.02.09
Accruals 16.02.09
 
Senario Analysis for Risk management in Corporate Finance
Senario Analysis for Risk management in Corporate FinanceSenario Analysis for Risk management in Corporate Finance
Senario Analysis for Risk management in Corporate Finance
 
MPOrtigas_samplecompFlat_ValidMarOnly
MPOrtigas_samplecompFlat_ValidMarOnlyMPOrtigas_samplecompFlat_ValidMarOnly
MPOrtigas_samplecompFlat_ValidMarOnly
 
Spark the rise Recycle e-waste
Spark the rise Recycle e-wasteSpark the rise Recycle e-waste
Spark the rise Recycle e-waste
 
Accruals 16.02.09
Accruals 16.02.09Accruals 16.02.09
Accruals 16.02.09
 
Rendición de cuentas GABO 2013
Rendición de cuentas GABO 2013Rendición de cuentas GABO 2013
Rendición de cuentas GABO 2013
 
Actual Cost Vs Plan Projection PowerPoint Presentation Slides
Actual Cost Vs Plan Projection PowerPoint Presentation Slides Actual Cost Vs Plan Projection PowerPoint Presentation Slides
Actual Cost Vs Plan Projection PowerPoint Presentation Slides
 
2 q11
2 q112 q11
2 q11
 
Pavilion income statement as to Dec 31 2017
Pavilion income statement as to Dec 31 2017Pavilion income statement as to Dec 31 2017
Pavilion income statement as to Dec 31 2017
 
Netscape IPO - Harvard Business Case
Netscape IPO - Harvard Business CaseNetscape IPO - Harvard Business Case
Netscape IPO - Harvard Business Case
 

Plus de Francoveliz

Capítulo iii, antecedentes y situación actual
Capítulo iii, antecedentes y situación actualCapítulo iii, antecedentes y situación actual
Capítulo iii, antecedentes y situación actualFrancoveliz
 
Capítulo ii, identificación de la propuesta
Capítulo ii, identificación de la propuestaCapítulo ii, identificación de la propuesta
Capítulo ii, identificación de la propuestaFrancoveliz
 
Capítulo i, presentación del grupo
Capítulo i, presentación del grupoCapítulo i, presentación del grupo
Capítulo i, presentación del grupoFrancoveliz
 

Plus de Francoveliz (9)

Proyecto
ProyectoProyecto
Proyecto
 
Capítulo vii
Capítulo viiCapítulo vii
Capítulo vii
 
Capítulo vi
Capítulo viCapítulo vi
Capítulo vi
 
Capítulo v
Capítulo vCapítulo v
Capítulo v
 
Capítulo v
Capítulo vCapítulo v
Capítulo v
 
Capítulo iv
Capítulo ivCapítulo iv
Capítulo iv
 
Capítulo iii, antecedentes y situación actual
Capítulo iii, antecedentes y situación actualCapítulo iii, antecedentes y situación actual
Capítulo iii, antecedentes y situación actual
 
Capítulo ii, identificación de la propuesta
Capítulo ii, identificación de la propuestaCapítulo ii, identificación de la propuesta
Capítulo ii, identificación de la propuesta
 
Capítulo i, presentación del grupo
Capítulo i, presentación del grupoCapítulo i, presentación del grupo
Capítulo i, presentación del grupo
 

Dernier

Search Engine Optimization SEO PDF for 2024.pdf
Search Engine Optimization SEO PDF for 2024.pdfSearch Engine Optimization SEO PDF for 2024.pdf
Search Engine Optimization SEO PDF for 2024.pdfRankYa
 
Vector Databases 101 - An introduction to the world of Vector Databases
Vector Databases 101 - An introduction to the world of Vector DatabasesVector Databases 101 - An introduction to the world of Vector Databases
Vector Databases 101 - An introduction to the world of Vector DatabasesZilliz
 
Developer Data Modeling Mistakes: From Postgres to NoSQL
Developer Data Modeling Mistakes: From Postgres to NoSQLDeveloper Data Modeling Mistakes: From Postgres to NoSQL
Developer Data Modeling Mistakes: From Postgres to NoSQLScyllaDB
 
Advanced Test Driven-Development @ php[tek] 2024
Advanced Test Driven-Development @ php[tek] 2024Advanced Test Driven-Development @ php[tek] 2024
Advanced Test Driven-Development @ php[tek] 2024Scott Keck-Warren
 
"Subclassing and Composition – A Pythonic Tour of Trade-Offs", Hynek Schlawack
"Subclassing and Composition – A Pythonic Tour of Trade-Offs", Hynek Schlawack"Subclassing and Composition – A Pythonic Tour of Trade-Offs", Hynek Schlawack
"Subclassing and Composition – A Pythonic Tour of Trade-Offs", Hynek SchlawackFwdays
 
Beyond Boundaries: Leveraging No-Code Solutions for Industry Innovation
Beyond Boundaries: Leveraging No-Code Solutions for Industry InnovationBeyond Boundaries: Leveraging No-Code Solutions for Industry Innovation
Beyond Boundaries: Leveraging No-Code Solutions for Industry InnovationSafe Software
 
"LLMs for Python Engineers: Advanced Data Analysis and Semantic Kernel",Oleks...
"LLMs for Python Engineers: Advanced Data Analysis and Semantic Kernel",Oleks..."LLMs for Python Engineers: Advanced Data Analysis and Semantic Kernel",Oleks...
"LLMs for Python Engineers: Advanced Data Analysis and Semantic Kernel",Oleks...Fwdays
 
Integration and Automation in Practice: CI/CD in Mule Integration and Automat...
Integration and Automation in Practice: CI/CD in Mule Integration and Automat...Integration and Automation in Practice: CI/CD in Mule Integration and Automat...
Integration and Automation in Practice: CI/CD in Mule Integration and Automat...Patryk Bandurski
 
Streamlining Python Development: A Guide to a Modern Project Setup
Streamlining Python Development: A Guide to a Modern Project SetupStreamlining Python Development: A Guide to a Modern Project Setup
Streamlining Python Development: A Guide to a Modern Project SetupFlorian Wilhelm
 
"ML in Production",Oleksandr Bagan
"ML in Production",Oleksandr Bagan"ML in Production",Oleksandr Bagan
"ML in Production",Oleksandr BaganFwdays
 
SAP Build Work Zone - Overview L2-L3.pptx
SAP Build Work Zone - Overview L2-L3.pptxSAP Build Work Zone - Overview L2-L3.pptx
SAP Build Work Zone - Overview L2-L3.pptxNavinnSomaal
 
Story boards and shot lists for my a level piece
Story boards and shot lists for my a level pieceStory boards and shot lists for my a level piece
Story boards and shot lists for my a level piececharlottematthew16
 
Training state-of-the-art general text embedding
Training state-of-the-art general text embeddingTraining state-of-the-art general text embedding
Training state-of-the-art general text embeddingZilliz
 
Designing IA for AI - Information Architecture Conference 2024
Designing IA for AI - Information Architecture Conference 2024Designing IA for AI - Information Architecture Conference 2024
Designing IA for AI - Information Architecture Conference 2024Enterprise Knowledge
 
"Debugging python applications inside k8s environment", Andrii Soldatenko
"Debugging python applications inside k8s environment", Andrii Soldatenko"Debugging python applications inside k8s environment", Andrii Soldatenko
"Debugging python applications inside k8s environment", Andrii SoldatenkoFwdays
 
Human Factors of XR: Using Human Factors to Design XR Systems
Human Factors of XR: Using Human Factors to Design XR SystemsHuman Factors of XR: Using Human Factors to Design XR Systems
Human Factors of XR: Using Human Factors to Design XR SystemsMark Billinghurst
 
Anypoint Exchange: It’s Not Just a Repo!
Anypoint Exchange: It’s Not Just a Repo!Anypoint Exchange: It’s Not Just a Repo!
Anypoint Exchange: It’s Not Just a Repo!Manik S Magar
 
The Future of Software Development - Devin AI Innovative Approach.pdf
The Future of Software Development - Devin AI Innovative Approach.pdfThe Future of Software Development - Devin AI Innovative Approach.pdf
The Future of Software Development - Devin AI Innovative Approach.pdfSeasiaInfotech2
 
New from BookNet Canada for 2024: BNC CataList - Tech Forum 2024
New from BookNet Canada for 2024: BNC CataList - Tech Forum 2024New from BookNet Canada for 2024: BNC CataList - Tech Forum 2024
New from BookNet Canada for 2024: BNC CataList - Tech Forum 2024BookNet Canada
 
"Federated learning: out of reach no matter how close",Oleksandr Lapshyn
"Federated learning: out of reach no matter how close",Oleksandr Lapshyn"Federated learning: out of reach no matter how close",Oleksandr Lapshyn
"Federated learning: out of reach no matter how close",Oleksandr LapshynFwdays
 

Dernier (20)

Search Engine Optimization SEO PDF for 2024.pdf
Search Engine Optimization SEO PDF for 2024.pdfSearch Engine Optimization SEO PDF for 2024.pdf
Search Engine Optimization SEO PDF for 2024.pdf
 
Vector Databases 101 - An introduction to the world of Vector Databases
Vector Databases 101 - An introduction to the world of Vector DatabasesVector Databases 101 - An introduction to the world of Vector Databases
Vector Databases 101 - An introduction to the world of Vector Databases
 
Developer Data Modeling Mistakes: From Postgres to NoSQL
Developer Data Modeling Mistakes: From Postgres to NoSQLDeveloper Data Modeling Mistakes: From Postgres to NoSQL
Developer Data Modeling Mistakes: From Postgres to NoSQL
 
Advanced Test Driven-Development @ php[tek] 2024
Advanced Test Driven-Development @ php[tek] 2024Advanced Test Driven-Development @ php[tek] 2024
Advanced Test Driven-Development @ php[tek] 2024
 
"Subclassing and Composition – A Pythonic Tour of Trade-Offs", Hynek Schlawack
"Subclassing and Composition – A Pythonic Tour of Trade-Offs", Hynek Schlawack"Subclassing and Composition – A Pythonic Tour of Trade-Offs", Hynek Schlawack
"Subclassing and Composition – A Pythonic Tour of Trade-Offs", Hynek Schlawack
 
Beyond Boundaries: Leveraging No-Code Solutions for Industry Innovation
Beyond Boundaries: Leveraging No-Code Solutions for Industry InnovationBeyond Boundaries: Leveraging No-Code Solutions for Industry Innovation
Beyond Boundaries: Leveraging No-Code Solutions for Industry Innovation
 
"LLMs for Python Engineers: Advanced Data Analysis and Semantic Kernel",Oleks...
"LLMs for Python Engineers: Advanced Data Analysis and Semantic Kernel",Oleks..."LLMs for Python Engineers: Advanced Data Analysis and Semantic Kernel",Oleks...
"LLMs for Python Engineers: Advanced Data Analysis and Semantic Kernel",Oleks...
 
Integration and Automation in Practice: CI/CD in Mule Integration and Automat...
Integration and Automation in Practice: CI/CD in Mule Integration and Automat...Integration and Automation in Practice: CI/CD in Mule Integration and Automat...
Integration and Automation in Practice: CI/CD in Mule Integration and Automat...
 
Streamlining Python Development: A Guide to a Modern Project Setup
Streamlining Python Development: A Guide to a Modern Project SetupStreamlining Python Development: A Guide to a Modern Project Setup
Streamlining Python Development: A Guide to a Modern Project Setup
 
"ML in Production",Oleksandr Bagan
"ML in Production",Oleksandr Bagan"ML in Production",Oleksandr Bagan
"ML in Production",Oleksandr Bagan
 
SAP Build Work Zone - Overview L2-L3.pptx
SAP Build Work Zone - Overview L2-L3.pptxSAP Build Work Zone - Overview L2-L3.pptx
SAP Build Work Zone - Overview L2-L3.pptx
 
Story boards and shot lists for my a level piece
Story boards and shot lists for my a level pieceStory boards and shot lists for my a level piece
Story boards and shot lists for my a level piece
 
Training state-of-the-art general text embedding
Training state-of-the-art general text embeddingTraining state-of-the-art general text embedding
Training state-of-the-art general text embedding
 
Designing IA for AI - Information Architecture Conference 2024
Designing IA for AI - Information Architecture Conference 2024Designing IA for AI - Information Architecture Conference 2024
Designing IA for AI - Information Architecture Conference 2024
 
"Debugging python applications inside k8s environment", Andrii Soldatenko
"Debugging python applications inside k8s environment", Andrii Soldatenko"Debugging python applications inside k8s environment", Andrii Soldatenko
"Debugging python applications inside k8s environment", Andrii Soldatenko
 
Human Factors of XR: Using Human Factors to Design XR Systems
Human Factors of XR: Using Human Factors to Design XR SystemsHuman Factors of XR: Using Human Factors to Design XR Systems
Human Factors of XR: Using Human Factors to Design XR Systems
 
Anypoint Exchange: It’s Not Just a Repo!
Anypoint Exchange: It’s Not Just a Repo!Anypoint Exchange: It’s Not Just a Repo!
Anypoint Exchange: It’s Not Just a Repo!
 
The Future of Software Development - Devin AI Innovative Approach.pdf
The Future of Software Development - Devin AI Innovative Approach.pdfThe Future of Software Development - Devin AI Innovative Approach.pdf
The Future of Software Development - Devin AI Innovative Approach.pdf
 
New from BookNet Canada for 2024: BNC CataList - Tech Forum 2024
New from BookNet Canada for 2024: BNC CataList - Tech Forum 2024New from BookNet Canada for 2024: BNC CataList - Tech Forum 2024
New from BookNet Canada for 2024: BNC CataList - Tech Forum 2024
 
"Federated learning: out of reach no matter how close",Oleksandr Lapshyn
"Federated learning: out of reach no matter how close",Oleksandr Lapshyn"Federated learning: out of reach no matter how close",Oleksandr Lapshyn
"Federated learning: out of reach no matter how close",Oleksandr Lapshyn
 

Modelos economicos

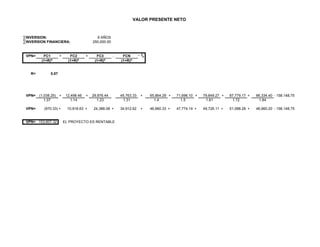
  • 1. VALOR PRESENTE NETO ∑INVERSION: 9 AÑOS ∑INVERSION FINANCIERA: 250,000.00 VPN= FC1 + FC2 + FC3 … FCN - IO (1+R)N (1+R)N (1+R)N (1+R)N R= 0.07 VPN= (1,038.25) + 12,498.46 + 29,876.44 45,763.33 + 65,864.29 + 71,696.10 + 79,849.27 + 87,779.17 + 86,334.40 - 158.148,75 1.07 1.14 1.23 1.31 1.4 1.5 1.61 1.72 1.84 VPN= (970.33) + 10,916.63 + 24,388.08 + 34,912.62 + 46,960.33 + 47,774.14 + 49,726.11 + 51,088.28 + 46,960.20 - 158.148,75 VPN= 153,607.32 EL PROYECTO ES RENTABLE
  • 2. POLICÍA MUNICIPAL MUNICIPIO JUAN JOSÉ MORA FLUJO DE EFECTIVO PERIODOS 2010 2011 2012 2013 2014 2015 2016 2017 2018 UTILIDAD NETA -10,509.25 12,028.46 30,158.44 46,827.33 69,913.29 77,620.10 86,707.27 95,773.17 94,865.40 DEPRECIACION 9,471.00 9,471.00 9,471.00 9,471.00 9,471.00 9,471.00 9,471.00 9,471.00 9,471.00 SUB-TOTAL MAS: LIMITACION CTAS. POR COBRAR AUMENTO CTAS. POR COBRAR MENOS: AUMENTO CTAS. POR COBRAR DISMINUCION CTAS. POR PAGAR EFECTIVO NETO USADO -1,038.25 21,499.46 39,629.44 56,298.33 79,384.29 87,091.10 96,178.27 105,244.17 104,336.40 ACTIVIDADES DE INVERSION MAS: DISMINUCUION DE PROPIEDADES Y EQUIPOS MENOS: AUMENTO DE PROPIEDADES Y EQUIPOS 9,001.00 9,753.00 10,535.00 13,520.00 15,395.00 16,329.00 17,465.00 18,002.00 EFECTIVO NETO USADO (9,001.00) (9,753.00) (10,535.00) (13,520.00) (15,395.00) (16,329.00) (17,465.00) (18,002.00) ACTIVIDADES DE FIANCIAMIENTO MAS: AUMENTO DE FINANCIAMIENTO - 9,001.00 9,753.00 10,535.00 13,520.00 15,395.00 16,329.00 17,465.00 18,002.00 MENOS: DISMINUCION DE FINANCIAMIENTO EFECTIVO NETO PROVISTO DE FINANCIAMIENTO 9,001.00 9,753.00 10,535.00 13,520.00 15,395.00 16,329.00 17,465.00 18,002.00 TOTAL FLUJO DE CAJA (1,038.25) 12,498.46 29,876.44 45,763.33 65,864.29 71,696.10 79,849.27 87,779.17 86,334.40
  • 3. ESTADO DE RESULTADO PROYECTADO EMPRESA HELADERIA INDUSTRIAL DE PUERTO CABELLO, S.A. DEL 2003 AL 2011 INGRESOS POR SERVICIO 2010 2011 2012 2013 2014 2015 2016 2017 2018 INGRESOS NETOS 40,000.00 65,000.00 84,000.00 102,000.00 126,000.00 140,233.01 150,383.01 160,533.01 170,683.01 COSTOS Y GASTOS INSUMOS 79.75 84.54 86.23 88.81 90.59 103.27 105.34 107.44 128.93 GASTOS DE ENERGIA ELECTRICA 960.00 1,017.60 1,037.95 1,069.09 1,090.47 1,243.14 1,268.00 1,293.36 1,552.03 PERSONAL 30,000.00 31,800.00 32,436.00 33,409.08 34,077.26 38,848.08 39,625.04 40,417.54 48,501.05 DEPRECIACION VEHÍCULOS 9,471.00 9,471.00 9,471.00 9,471.00 9,471.00 9,471.00 9,471.00 9,471.00 9,471.00 COSTOS VARIABLES ALQUILER DEL LOCAL 720.00 763.20 778.46 801.82 817.85 932.35 951.00 970.02 1,164.03 MANTENIMIENTO DE EQUIPO 1,578.50 1,673.21 1,706.67 1,757.87 1,793.03 2,044.06 2,084.94 2,126.64 2,551.96 GASTOS (FINANCIAMIENTO) 7,700.00 8,162.00 8,325.24 8,575.00 8,746.50 9,971.01 10,170.43 10,373.84 12,448.60 IMPUESTO MUNICIPALES UTILIDAD NETA ANTES DEL I.S.R.L. (10,509.25) 12,028.46 30,158.44 46,827.33 69,913.29 77,620.10 86,707.27 95,773.17 94,865.40 I.S.R.L. UTILIDAD NETA -10,509.25 12,028.46 30,158.44 46,827.33 69,913.29 77,620.10 86,707.27 95,773.17 94,865.40
  • 4. Modelo Económico Presupuesto de Inversión Monto a Financiar Descripción 2010 Aportes Propios Total Bs. Insumos 79,750.00 0 79,750.00 Maquinarias y Equipos - 0.00 Equipos de Seguridad 137,500.00 0 137,500.00 Vehículos 38,500,000.00 38,500,000.00 Equipos de Comput. 30,000.00 30,000.00 Uniformes del Personal 10,000.00 10,000.00 Mobiliario y Equipos 82,500.00 82,500.00 38,839,750.00 COSTO DE MANTENIMIENTO DE EQUIPOS 38,667,500.00 ESTIMADO 1% 1er AÑO 386,675.00 GASTOS ENERGIA ELECTRICA 12,000.00 50 PERSONAS S/MINIMO 75,000.00 ALQUILER DEL LOCAL 6,000.00 FINANCIAMIENTO - ESTIMADO 7% 1er AÑO - DEPRECIACIÓN 15 AÑOS 2,320,050.00 38,839,750.00 100.00% APORTE FINANCIADO 38,839,750.00 INGRESOS POR Años PRESTACIÓN SERVICIO P/U SERVICIO 2010 10,000.00 14.02 140,233.01 2011 10,500.00 14.32 150,383.01 2012 11,000.00 14.59 160,533.01 2013 11,500.00 14.84 170,683.01
  • 5. CALCULO DEL COEFICIENTE DE VARIANZA ESTANDAR Y= Ingresos por Servicio Prestado 8 X= Cantidades de unidades promedio 20% Operativas 80% Recaudación ∑X2 = 269,500,000.00 S2 = 19,954,574,433.66 N= 5.00 X= 36,000.00 ∑X2 S2 1 S2 Sb1= * Sb2= * N*∑X *(X) 2 2 ∑X - 1 (X) 2 2 N 269,500,000.00 19.954.574.433,66 1 19.954.574.433,66 Sb1= * Sb2= * 5 * 269.500.000,00 * (36.000,00)2 269.500.000,00 - 1 * (36.000,00) 2 5 269,500,000.00 19.954.574.433,66 1 19.954.574.433,66 Sb1= * Sb2= * 1.347.500.000,00 * 1.296.000.000,00 269.500.000,00 - 1 * (36.000,00) 2 5 269,500,000.00 19.954.574.433,66 1 19.954.574.433,66 Sb1= * Sb2= * 1,746,360,000,000,000,000.00 269.500.000,00 - 1 * 1.296.000.000,00 5 Sb1= 0.000000000154 19.954.574.433,66 1 19.954.574.433,66 * Sb2= * 269.500.000,00 - 259.200.000,00 Sb1= 3.07 1 19.954.574.433,66 Sb2= * 10,300,000.00 Sb1= 0.000000097087 * 19.954.574.433,66 Sb1= 1,937.33
  • 6. CALCULO DEL ERROR ESTANDAR DE ESTIMACIÓN Y= Ingresos por Prestación del Servicio 8 X= Cantidades de unidades promedio 20% Operativas 80% Recaudación Año X Y XY X² y² 2003 5000 40,000.00 200,000,000.00 25,000,000.00 1,600,000,000.00 2004 6500 65,000.00 422,500,000.00 42,250,000.00 4,225,000,000.00 2005 7000 84,000.00 588,000,000.00 49,000,000.00 7,056,000,000.00 2006 8500 102,000.00 867,000,000.00 72,250,000.00 10,404,000,000.00 2007 9000 126,000.00 1,134,000,000.00 81,000,000.00 15,876,000,000.00 Σ 36000 417,000.00 3,211,500,000.00 269,500,000.00 39,161,000,000.00 B2 = 20.30 B1 = -62,766.99 Y= 83,400.00 X= 7,200.00 ∑ e 12 S2 = N -2 e12 = ∑ Y2 - B1∑ Y- B2 ∑ (XY) 26,173,834,951.46 -5,471,111,650.49 e12 = 39.161.000.000,00 - (-62.766,99)(417.000,00) - 20,30(269.500.000,00) e 12 = 39,161,000,000.00 + 26.173.834.951,46 - 5.471.111.650,49 e 12 = 59,863,723,300.97 S2 = 59,863,723,300.97 3.00 S2 = 19,954,574,433.66 S= 141,260.66
  • 7. MODELO ECONÒMICO FORMULAS BASICAS Ŷ = B1 ± B2 + U __ B1 = Ŷ - B2 (X) B2 = N Σ (XY) - Σ X . ΣY N Σ X² - Σ (X)² DETERMINACION DE VARIABLES Y= Ingresos por prestación del servicio 8 X= Cantidades de unidades promedio 20% servicio 80% recaudación Año X Y XY X² 2010 5000 40,000.00 200,000,000.00 25,000,000.00 2011 6500 65,000.00 422,500,000.00 42,250,000.00 2012 7000 84,000.00 588,000,000.00 49,000,000.00 2013 8500 102,000.00 867,000,000.00 72,250,000.00 2014 9000 126,000.00 1,134,000,000.00 81,000,000.00 Σ 36000 417,000.00 3,211,500,000.00 269,500,000.00 B2 = N ∑ (XY) - ∑ X . ∑Y N ∑ X2 - ∑ (X) 2 B2 = 5 (3.211500.000,00) - (36.000,00 x 417.000,00) 5 (269.500.000,00) - (36.000,00)2 B2 = 16,057,500,000.00 - 15,012,000,000.00 1,347,500,000.00 1,296,000,000.00 B2 = 1,045,500,000.00 51,500,000.00 B2 = 20.30 20.30097087 Y= ∑Y
  • 8. N Y= 417,000.00 5 Y= 83,400.00 X= ∑X N X= 36,000.00 5 X= 7,200.00 B1 = Y - B2. (X) B1 = 83,400.00 - 20.30 7,200.00 B1 = 83,400.00 - 146,166.99 B1 = -62,766.99 Ŷ= B1 ⁺ B2 X + μ Ŷ= -62,766.99 + 20.30097087 X +μ
  • 9. Proyección Ŷ= -62,766.99 + 20.30 X +μ Año X Y 2010 10,000.00 140,233.01 Ŷ año 2008 = -62,766.99 + 20.30 10,000.00 2011 10,500.00 150,383.01 2012 11,000.00 160,533.01 Ŷ año 2008 = -62,766.99 + 203,000.00 2013 11,500.00 170,683.01 Total 43,000.00 621,832.04 Ŷ año 2008 = 140,233.01 Ŷ año 2009 = -62,766.99 + 20.30 10,500.00 Ŷ año 2009 = -62,766.99 + 213,150.00 Ŷ año 2009 = 150,383.01 Ŷ año 2010 = -62,766.99 + 20.30 11,000.00 Ŷ año 2010 = -62,766.99 + 223,300.00 Ŷ año 2010 = 160,533.01
  • 10. Ŷ año 2011 = -62,766.99 + 20.30 11,500.00 Ŷ año 2011 = -62,766.99 + 233,450.00 Ŷ año 2011 = 170,683.01