Emissions from the Incineration Industry_Luke Martin
1. BSEN40110
Advanced Air Pollution
Air pollution in the incineration industry
Luke Martin
4/27/2015
The incineration of municipal solid waste has become a popular waste disposal method because of
the reduction in emissions compared to landfill and the energy recovery associated with this
technology. By incorporating a number of modern abatement methods into their design,
incinerators can safely come under the emissions limits set out by the E.U. Focusing primarily on the
Irish incineration industry; and subsequently European and US examples, the dispersal of pollutants
emitted by these facilities are assessed to determine their potential impact on human health. The
study shows that all facilities come under the respective emissions limits and that modern gas-
cleaning technology can reduce emissions by 65%.
2. 1
UCD Assessment Submission Form
Student Name Luke Martin
Student Number 14200324
Assessment Title Air pollution model of an incinerator
Module Code BSEN40110
Module Title Advanced Air Pollution
Module Co-ordinator Dr. Tom Curran
Date Submitted 27 April 2015
Date Received
Grade/Mark
A SIGNED COPY OF THIS FORM MUST ACCOMPANY ALL SUBMISSIONS FOR ASSESSMENT.
STUDENTS SHOULD KEEP A COPY OF ALL WORK SUBMITTED.
Procedures for Submission and Late Submission
Ensure that you have checked the School’s procedures for the submission of assessments.
Note: There are penalties for the late submission of assessments. For further information please see the
University’s Policy on Late Submission of Coursework, (http://www.ucd.ie/registrar/)
Plagiarism: the unacknowledged inclusion of another person’s writings or ideas or works, in any
formally presented work (including essays, examinations, projects, laboratory reports or
presentations). The penalties associated with plagiarism designed to impose sanctions that reflect the
seriousness of University’s commitment to academic integrity. Ensure that you have read the University’s
Briefing for Students on Academic Integrity and Plagiarism and the UCD Plagiarism Statement,
Plagiarism Policy and Procedures, (http://www.ucd.ie/registrar/)
Declaration of Authorship
I declare that all material in this assessment is my own work except where there is clear
acknowledgement and appropriate reference to the work of others.
Signed…Luke Martin……………………………………
Date ……24/04/2015…………………………………..
4. 3
Figure 1: Number of MSW incinerators in various countries across Europe and the US (ISWA, 2012) .4
Figure 2: Typical layout of a modern moving grate incinerator (Murdoch University, 2014)................6
Figure 3: Electrostatic precipitator (Holbert Faculty, 2003) .................................................................11
Figure 4: Chemical Scrubber (intech, 2014)..........................................................................................11
Figure 5: Gas filtration system (Tri-Mer, 2013).....................................................................................11
Figure 6: Indaver panoramic view and map showing the facility location (Indaver)............................13
Figure 7: Poolbeg incinerator speculative image and location (Covanta, 2015) ..................................14
Figure 8: Tersa incinerator birds-eye view and location (Tersa, 2015).................................................15
Figure 9: West Palm Beach incinerator image and location (Tersa, 2015)...........................................16
Figure 10: Terrain profile taken from the alternate transect at the Carranstown site ........................18
Figure 11 (a): Air Dispersion of SOx emissions in the direction of prevailing wind..............................19
Figure 12(a): Air dispersion of NOx emissions according to prevailing wind conditions......................21
Figure 13: Air Dispersion of Dioxins and Furans in the prevailing wind direction................................22
Figure 14 (b): Air dispersal of dioxins and furans in the alternate wind direction ...............................22
5. 4
1) Introduction
In the past few decades, the incineration of municipal solid waste (MSW) has become a
popular method for waste disposal. Some studies even go so far to suggest that modern
incineration facilities are crucial to sustainable waste management hierarchies to be in
adherence with EU DIRECTIVE 2000/76/EC targets (Hjelmar, 1996; Van Gervan et al, 2005).
These facilities take preference over the archaic landfill disposal methods due to a
significant reduction in the volume of waste as well as overall emissions reductions
(Cherubini et al, 2009).
Figure.1 taken from ISWA (2012) shows the number of incinerators currently operating in a
number of developed countries across Europe and the US. With the successful completion
of the Carranstown incinerator in 2011, Ireland is finally beginning to follow European
protocol however is still lagging behind its neighbours.
Figure 1: Number of MSW incinerators in various countries across Europe and the US (ISWA, 2012)
While the scientific evidence is unequivocally in favour of incineration as a waste disposal
technique, the potential of detrimental health effects from stack emissions are of major
public concern (Meneses et at, 2004). Up until 2011, Ireland has resisted the use of
incinerators largely due to the phenomena such as “NIMBYism” and lack of trust in planning
authorities (Davies, 2004; Cavazza, 2013). In an attempt to allay or justify the public’s
6. 5
concerns, this study investigates the true impact these facilities have on human health. This
will be achieved by;
Identifying the key pollutants emitted by an incinerator,
Outlining the specific effects these emissions potentially have on human health,
Explaining the concentrations that these pollutants are harmful to human health,
Analysing the dispersion of these pollutants from several incinerators with samples
from Ireland, Europe and the USA.
This project uses Lakes Environmental’s air dispersion modelling software “Screenview” to
assess the dispersion of pollutants from these facilities.
7. 6
2) Literature review
Incineration
Incineration, or under its green-washed pseudonym “thermal treatment”, of municipal solid
waste involves the destruction of waste by heating it to high temperatures in the range of
850-1100°C. This is carried out in a controlled environment to limit the release of emissions
to the environment. The main appeal of this treatment method is that it reduces the volume
of waste to one-tenth of its initial size (Sabbas et al, 2003) and the heat from flue gases can
be utilized to run a steam turbine to generate electricity or used directly for district heating.
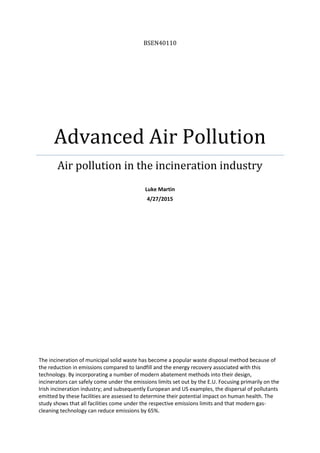
Figure 2: Typical layout of a modern moving grate incinerator (Murdoch University, 2014)
Figure.2 depicts the typical layout of a modern, state of the art, moving grate incinerator.
This type of incinerator is preferred for treating MSW as they are considered most reliable
for dealing with mass quantities of non-homogenous waste streams. All four facilities
studied in the project utilise this type of mass burn incinerator. Waste is received into a
storage bunker (A). A grabber, (B) controlled by an operator in the control room, transfers
waste into a hopper (C). This step allows for the extraction of potentially hazardous wastes
unsuitable for thermal treatment which is particularly important from an emissions
8. 7
perspective as an anomalous piece of waste could lead to a higher release of pollutants than
expected. The hopper then gradually feeds the waste into a moving grate incinerator (D).
This moving grate shifts waste gradually through the drying stage (<100°C), hydrolysis stage
(<700°C) and combustion stage (700-1000°C) (E). The combustion stage results in the
production of a flue gas which is directed by a combustion chamber chute (F), towards a
boiler system. The heat from the flue gas heats water in the boiler creating steam, which is
channelled to a turbine to generate electricity. Flue gases then continue on to an
economiser (H) where heat is recycled either for on-site usage, or for supplementary heat to
the incineration cycle itself.
While the quantities of pollutants are significantly reduced using this waste management
technique over others, the release of some of these pollutants to the atmosphere is
inevitable. This is where the public’s main concern comes in according to Meneses et al
(2004). Modern incinerators are legally obliged to incorporate a number of abatement
technologies (Best Available Techniques) to restrict the emissions of pollutants to an
acceptable level to avoid affecting human health. Figure.3 illustrates the inclusion of a wet
scrubber/evaporating spray reactor (I), an electrostatic precipitator and bag filter system
(J), and dioxin filtration system (K) consisting of a catalytic fibre to oxidise dioxins. These
technologies are elaborated on in the “abatement techniques” section. Finally the stack
height (L) is of importance to ensure adequate dispersal rates of pollutants in the
atmosphere which in turn, dilutes their respective concentrations. Provided these
abatement techniques are properly utilized, the health risks associated with incineration are
estimated to be five times lower than those associated with landfill (Moy et al, 2008).
Furthermore, Cangialosi et al (2008) has claimed that the health impacts which may arise
from inhalation, dermal contact or soil and food ingestion of pollutants emitted from
incinerators are well below background levels of these pollutants.
Pollutants
The principal air pollutants emitted from a municipal solid waste incinerator are acid gases;
consisting of sulphur dioxides and nitrogen oxides, organics; such as dioxins and furans and
heavy metals; including lead, mercury, cadmium and arsenic. Each of these toxins has their
9. 8
own inherent detrimental effect on human health when experienced in acute or chronic
concentrations.
Nitrogen Oxides (NOx)
NOx is one of the most abundant pollutants found in incinerator flue gases. These chemicals
form during the combustion phase of the incineration process when the waste is heated
above 850°C to “crack” the strong molecular bonds of furans and dioxins (DEFRA, 2010).
NOx gases can penetrate deep into the lungs causing, or aggravating existing respiratory
illnesses while particularly high concentrations can be fatal (EPA (a), 2015). According to
WID 2000/76/EC, limits the daily emission of NOx to 200mg/m³ for plants exceeding an
input of 6 t/hr.
Sulphur Oxides (SOx)
These sulphuric compounds form in any process which involves burning. SOx pollutants also
affect the respiratory system and aggravate a number of illnesses such as asthma, bronchitis
and emphysema (EPA (a), 2015). Modern incineration plants cannot exceed daily emissions
of 50mg/m³.
Dioxins and Furans
These pollutants account for all polychlorinated dibenzo-p-dioxins and dibenzofurans (WID,
2000/76/EC). These compounds form either from incomplete combustion of the feedstock
or through de novo synthesis due to an inconsistency in furnace temperature (DEFRA,
2010). Davies (2004) identifies these pollutants as central to most incinerator objections and
with good reason. Benzene, the key component of these compounds can cause dizziness,
drowsiness, headaches and unconsciousness following acute exposure and chronic exposure
has been linked with causing cancer (EPA (a), 2015). Due to their potency these substances
are strictly limited to 0.1 ng/m³.
Mercury
Mercury emissions are associated with combustion of any type. Exposure to humans can
occur either directly through inhalation or indirectly through consumption of fish or animals
who have in turn incorporated into their system through consumption. Mercury emissions
can cause damage to the brain, heart, kidneys and immune system to people of all ages
(EPA, 2015). People with chronic exposure to this substance can exhibit psychosocial
10. 9
symptoms such as shyness, depression, insomnia and irritability. The severity of this toxin
means incinerators are limited to daily emissions of 0.05 mg/m³.
Cadmium
Cadmium can be emitted in a variety of forms from an incinerator in compounds such as
CdO, CdCl₂, CdSO₄ or Cd(NO₃)₂. According to the EPA (2015) cadmium is extremely
carcinogenic and can also induce a number of other illnesses. This substance is limited to a
daily level of 0.05 mg/m³.
Lead and Arsenic
Lead and arsenic are the most abundant heavy metals emitted from a typical incinerator.
Lead in chronic doses is associated the retardation of mental development in children while
arsenic can have detrimental effects on the respiratory, cardiovascular and neurological
systems (EPA, 2015).
This project intends to focus primarily on NOx, SOx, Dioxin and Furan pollutants. Table.1
summarises the emission limits for these pollutants to allow for ease of reference during the
interpretation stage.
Table 1: Summary of emissions limits for NOx, SOx and Dioxins and Furans
NOx SOx Dioxins/Furans
Units mg/m³ mg/m³ ng/ m³
EU.Maximum
Emission Conc.
200 50 0.01
Annual Average
Daily Emission
Conc.
180 40 0.05
11. 10
Abatement Techniques to Limit Pollutant Emissions
In Ireland, under the “Protection of the Environment Act”, (2003) operators of any facility
which emits pollutants such as those aforementioned above are required to apply best
available techniques to their facilities to limit their release into the environment. This means
a spare-no-expense approach must be employed when building facilities such as a mass-
burn incinerator. There a number of technologies and techniques which minimize the
amount of pollutants emitted by these facilities. Each one generally specializes in the
abatement of one or a few specific types of pollutants.
Incinerator design features
The first step in limiting hazardous emissions begins with the operation of the facility itself.
This technically begins at the source of the waste assuming polluters are responsible to sort
waste appropriately. Operators are obliged to omit certain hazardous wastes prior to
feeding the hopper; this is carried out by the operator of the grabber (B) in figure. 2.
The next few emission-limiting steps occur in the furnace itself (D). According to DEFRA
(2010) temperature must be increased gradually to inhibit the development of cold pockets
or gas channelling. Failure to do so results in the incomplete combustion of the waste which
facilitates the release of undesirable, harmful emissions further downstream. The
temperature of the flue gases (E) must be brought between 850-1100°C to facilitate the
cracking of dioxins and furans into nitrogen oxides. At least one after-burner, additional
units added depending on the size of the furnace, must be included according to WID
2000/76/EC. This is to prevent the formation of dioxins and furans de novo synthesis due to
a temperature drop.
Skipping past the downstream gas-cleaning technologies for a moment, there are a number
of features at the point of flue gas exit which limit harmful release of emissions. The height
of the stack can ensure that fumes are taken efficiently away from the source without
affecting any of the immediate population in close proximity to the facility. As a rule of
thumb, DEFRA (2010) recommends that the chimney stack (L) should be 70m in height for
this plant considering 250,000 tonnes of waste are expected per year (DEFRA (b), 2007). In
addition the volumetric flow rate of the exiting gas along with its temperature can also have
12. 11
a significant impact on pollutant dispersal. These aspects will be discussed in the “sensitivity
analysis” section.
Electrostatic precipitator
The main function of this device is to divert fly-ash out of the
flue gas stream and send it into a containment area where it
can be disposed of safely. As illustrated in fig.3 the precipitator
achieves this goal by using positively charged plates to attract
the negatively charged particles as the flue gas passes through.
These can come in two types, wet and dry gas models and are
popular due to their high efficiencies at removing dust or
sludge’s from the flue gas. The downside to this technology is
that if the flue gas particles achieve high resistivity, the electrodes become less efficient at
extracting them (Holbert Faculty, 2003). This can be overcome by regulating flue gas
temperature, increasing its moisture content or adding conditioning agents to it.
Chemical Scrubber
These devices are extremely useful at removing acids such
as HCl, and HF; and acid gases such as NOx and SOx from the
flue gas stream (DEFRA, 2010). Typically this technology
function by administering a scrubbing liquid to capture
particulates and gases as shown in fig.4 (Pollution Systems,
2014) .This technology can facilitate “selective non-catalytic
reduction” by injecting in various reagents to react with and
nullify hazardous compounds (Zandaryaa et al, 2001). As this
technology’s main objective is to remove acidic components from the flue gas a major
disadvantage is that it is susceptible to corrosion, leading to costly maintenance and repairs.
Filtration systems
These units are particularly adept at removing particulate matter from the gas stream by
trapping particulates as the flue gas passes through in their mesh-like structure. They can
consist of fabric or ceramic filters the former which needs to be replaced every 24-36
months, while the latter can last for 5-10 years (Tri-Mer, 2013). The ceramic filters can be
Figure 4: Chemical Scrubber (intech, 2014)
Figure 3: Electrostatic precipitator
(Holbert Faculty, 2003)
Figure 5: Gas filtration system (Tri-Mer, 2013)
13. 12
deployed in the treatment of high temperature flue gases
while the fabric type requires the gases to be cooled first.
These filtrations can assist in the limitation of SOx, HCL, NOx
and dioxins.
14. 13
3) Site Description
This study will consider four sites to assess the effects of pollutant dispersal associated with
incinerators. Each of these incinerators specializes in the thermal processing of non-
hazardous municipal solid waste and commercial solid waste.
Indaver, Carranstown, Co. Meath
The Carranstown facility was completed by
Indaver, a predominantly Dutch company in
2011. It is situated in a rural area and
surrounded by a relatively flat landscape.
Wind data was compiled from 2012-2015
records provided by MetEireann (2015). The
prevailing wind for the site was found to be a
south westerly and figure.3 illustrates that
these winds are likely to carry emissions from
the stack over a flat landscape towards
Drogheda town some 6 km away. The
“alternate wind” path shows the second most
frequent wind direction at this site, a south
easterly. This transect will carry emissions
past a cement factory approximately 700m
downwind followed by a sharp rise in terrain, above the stack height in places,
approximately 2,300m downwind.
Specifications:
The facility consists of a moving grate incinerator and has an annual capacity of 200,000 t.
Flue gases are emitted through a single stack which is 40m in height. Abatement
technologies at this facility consist of an ammonia solution injection, an evaporating spray
reactor, a baghouse filter and an electrostatic precipitator with an activated carbon/dry lime
injection system.
Prevailing wind
(SW, 260)
Alternate
wind (SE, 140)
Figure 6: Indaver panoramic view and map showing the facility location
(Indaver)
15. 14
Covanta, Poolbeg, Co. Dublin
The Poolbeg incineration project is being
built by an American waste management
company known as Covanta. It is anticipated
that this facility will commence operations
in late 2017 (Dublin Waste-to-Energy, 2014).
This incinerator is approximately three times
larger than the Indaver project treating
600,000 t of waste per annum. The site is
located at the eastern periphery of Dublin
City on an old brownfield site in the
docklands. The surrounding landscape is flat
predominantly however there is an
abundance of tall buildings with the
potential to create turbulent air flow. It was appropriate to use the same meteorological
data as the Carranstown facility for this site as it was extrapolated from Dublin Airport.
Hence the prevailing and alternate winds at this site are SW and SE. Figure.4 highlights the
path of the prevailing wind which would carry emissions across Dublin Bay, towards the
elevated peninsula of Howth and Sutton. The alternate wind direction would transport the
emissions from stack exhausts across the north side of the city towards Fairview and Santry.
Specifications:
This facility is expected to consist of a moving grate incinerator with two 100m high stacks
to emit flue gases. Air quality infrastructure include an evaporating spray reactor for NOx
reduction, fabric filter to limit particulate matter release, a two-stage wet scrubber for the
reduction of HCL and SOx and activated carbon and lime are added to bind dioxins out of
solution (Dublin Waste To Energy, 2006).
Figure 7: Poolbeg incinerator speculative image and location (Covanta,
2015)
Prevailing wind
(SW, 260)
Alternate wind
(SE, 140)
16. 15
Tersa, Montcada, Barcelona
This facility was originally opened in 1975
with a capacity for 15 t/hr (ISWA, 2012).
The site was then renovated in 1996 to
upgrade its gas-cleaning system and bring
its emissions more in-line with the various
air quality legislation in Europe at the
time. The best available technique act (EU
Directive 96/61/EC) would have forced
the site operators hand in carrying out
these works. The site was upgraded and is
now currently run by “Tersa”, a European
company consisting of a number of
stakeholders from a variety of E.U nations. The prevailing wind of SW, 255 at this site
conveniently carries emissions away from the densely populated city of Barcelona. The
“alternate wind” pattern was modelled to assess the impacts of pollutants if blown across
this urban landscape.
Specifications:
This facility consists of a moving grate incinerator with a total of three stacks enclosed in
one point source which stands at 48m high. Up until 1996 the principal gas-cleaning
technology consisted of one electrostatic precipitator. The plant upgrade saw the
incorporation of a wet scrubber configured for HCl and SO2 as well as metal limit reduction.
In addition an active-carbon, fabric filter was included to target dioxin and furan emission
reductions (Meneses et al, 2004).
Figure 8: Tersa incinerator birds-eye view and location (Tersa, 2015)
Prevailing wind
(SW, 255)
Alternate wind
(SEE, 100 )
17. 16
Babcock & Wilcox, West Palm Beach, Florida
This project was commissioned by the
solid waste authority of Palm Beach and
built by an American engineering firm
called Babcock and Wilcox. This Is a
42t/hr facility located in a relatively
obscure area surrounded by marshland
and forests on its west side where its
prevailing wind carries pollutant
emissions. The alternate wind would
carry wind towards a number of
residential areas approximately 4km to
the south east of the facility.
Specifications:
“State-of-the-art emissions control systems” are included in this facility including a selective
non-catalytic reducer system, a baghouse filter, a spray-dry absorber and a venturi-style wet
scrubber (Babcock & Wilcox, 2012). The facility has 2 94.49 meter high stacks combined
together in one point source as shown in figure.9.
Figure 9: West Palm Beach incinerator image and location (Tersa, 2015)
Prevailing wind
(E, 90)
Alternate wind
(NW, 320)
18. 17
4) Modelling Methods
The first step taken to accurately model the four chosen sites was to obtain the relevant
input data required by the modelling software. This was acquired from a number of sources
within the literature such as environmental impact statements, journal articles and similar
air pollution studies. This was input into “Lakes Environmental” Screenview software in the
format outlined in table.2.
Table 2: Model Inputs
Unit Indaver Poolbeg Florida Montcada
(2001)
Montcada
(1996)
Stack height m 40 100 94.49 48 48
Stack Diameter m 2 4.52 4.26 1.77 1.77
Stack exit velocity m/s 20.5 20.3 20.12 8.9 8.0
Stack gas exit
temperature
K 373 328 413.7 448.15 509.55
Rural/Urban Rural Urban Rural Urban Urban
SOx emission rate g/s 1.049 7.6 68 (lb/hr) 1.052 n/a
NOx Emission rate g/s 6.459 30.6 173.3 (lb/hr) 3.0702 n/a
Dioxin/Furan
Emission rate
fg/s 0.42 1.53 n/a 0.199 0.592
Capacity t/hr 27 68 42 15 15
Additional data was required for sites surrounded by complex terrain. This data was
collected by taking two transects per site and determining the terrain elevation profile in
relation to distance from the site. This allowed the creation of ground profiles such as that
in figure.3. The elevation data was extracted from Google Earth and the corresponding
distances were found using the ruler function in google Earth. The two 5km transects were
selected for each site on the basis of:
19. 18
I. Prevailing Wind
II. In order to capture a particularly complex train to consider the worst case scenario
of each site.
Figure 10: Terrain profile taken from the alternate transect at the Carranstown site
The output data was compiled into a spread sheet and the data was expressed as the four
sites contribution to a particular emission.
20. 19
5) Results
This study has narrowed its focus onto three significant pollutants released from
incinerators. Sulphur Dioxide and Nitrogen oxides were selected on the basis of a gravity
analysis in which these two emissions ranked highest among all the pollutants emitted from
a MSW incinerator (Indaver, 2015). Dioxins and furans were selected for study in this project
on the premise that they have the potential to cause serious damage to human health and
are the prime subject of controversy between the public on incinerators.
Sulphur Oxide Emissions
Figure.11 (a) and (b) shows sulphur dioxide emissions for all four study sites. In both wind
direction scenarios the Poolbeg facility releases the highest amount of this pollutant
doubling the emissions of the other sites in some cases. Pollutant concentrations all seem to
peak between the 800 to 1000 m mark and trail off gradually to lower concentrations as
distance increases from the source. The Carranstown site performs particularly well relative
to the other sites with the lowest pollutant emissions out of the four sites.
-2
0
2
4
6
8
10
12
14
16
18
0 1000 2000 3000 4000 5000 6000
SOxConcentration(μg/m³)
Distance From Point Source (m)
Prevailing Air Dispersion of SOx emissions
Carranstown
Poolbeg
Montcada
(2001)
Florida
Figure 11 (a): Air Dispersion of SOx emissions in the direction of prevailing wind
21. 20
Figure.11 (b) illustrates the effects of pollutants taking a different path following release
from the stack. The Poolbeg sites peak pollutant emissions are muted slightly in this
scenario however instead of gradually trailing off to lower concentrations, this time
emissions rise again at ~2700 m away from the source. The Carranstown emissions rise
slightly relative to their prevailing wind concentrations while the Montcada emissions also
rise slightly relative to their prevailing counterparts. The Florida site appears to be
unchanged in both scenarios.
Nitrogen Oxide Emissions
The Poolbeg facility also comes in as the highest polluter with respect to NOx, registering its
highest emissions at approximately 68µg/m³; doubling the average concentrations emitted
from the other three facilities (figure. 12 (a)). The Carranstown facility does not perform as
well in limiting Nitrogen emissions as it does Sulphur, ranking second highest in this
scenario. Interestingly, the Florida site almost mirrors the dispersion profile of the
Carranstown site albeit at slightly lower concentrations. The Montcada site performs
greatest at limiting NOx in this scenario.
-2
0
2
4
6
8
10
12
14
0 1000 2000 3000 4000 5000 6000
SOxConcentration(μg/m³)
Distance From Point Source (m)
Alternate Air Dispersion of SOx emissions
Carranstown
Poolbeg
Montcada
(2001)
Florida
Figure 11 (b): Air Dispersion of SOx emissions in the alternate direction chosen for each site.
22. 21
In Figure.11 (b) the slight rise at the end of the NOx emissions profile for the Poolbeg site is
witnessed once more. The Carranstown emissions display a delayed peak at ~ 900 m as
opposed to ~300m in fig.12 (a). The Montcada profile, on the contrary peaks earlier in the
alternate wind scenario than it did in the prevailing wind scenario. The Florida site sees a
slight increase in its peak emissions in the alternate wind scenario however its profile
remains superficially the same.
-10
0
10
20
30
40
50
60
70
80
0 1000 2000 3000 4000 5000 6000
NOxConcentration(μg/m³)
Distance From Point Source (m)
Prevailing Air Dispersion of NOx emissions
Carranstown
Poolbeg
Montcada
(2001)
Florida
-10
0
10
20
30
40
50
60
0 1000 2000 3000 4000 5000 6000
NOxConcentration(μg/m³)
Distance From Point Source (m)
Alternate Air Dispersion of NOx emissions
Carranstown
Poolbeg
Montcada
(2001)
Florida
Figure 12(a): Air dispersion of NOx emissions according to prevailing wind conditions.
Figure 12 (b): Air dispersion of NOx emissions according to alternative wind conditions.
23. 22
Dioxin and Furan Emissions
These pollutants have gained a particular degree of notoriety due to being linked with
causing cancer hence emissions must be strictly limited below emissions limits. Thankfully
this was the case at the three facilities studied in this project hence their concentrations are
measured in femtograms (1e-15 grams). Notice the change from µg/m³ to fg/m³ on the
graphs. The Florida site did not provide data on the emissions of these toxins hence is
omitted from this portion of the study. Data could however be found on the Montcada site
before it underwent renovations in 1996 (Meneses et al, 2004). This could provide an
interesting perspective on quantitative effects the respective gas cleaning methods
mentioned in section.2 have on reducing emissions.
In figure 13 (a), it seems the Poolbeg facility has finally met its match in terms of big
emitters however it is the pre-renovated Montcada, 1996 site which is shadowing the
Poolbeg’s giant profile. The Carranstown site peaks early at ~300m as it has done in all other
prevailing wind scenarios. The upgrades carried out to the Montcada site have clearly been
successful as it has brought the site from the being the highest polluter to the lowest one in
comparison to the two Irish sites studied.
-0.5
0
0.5
1
1.5
2
2.5
3
3.5
4
0 1000 2000 3000 4000 5000 6000
Dioxin/FuranConcentration(fg/m³)
Distance From Point Source (m)
Prevailing Air Dispersion of Dioxins/Furans
Carranstown
Poolbeg
Montcada
(2001)
Montcada
(1996)
Figure 13: Air Dispersion of Dioxins and Furans in the prevailing wind direction
24. 23
The Montcada (1996) site well and truly takes over the top spot of highest emitters from the
Poolbeg site in this scenario (fig 13, b). The Poolbeg site, as with the previous emissions
profiles shows an upward inflection at the 2.7km mark. The Indaver site exhibits its “delayed
peak emissions” characteristic of the alternate wind direction scenario while the Montcada
(2001) maintains its position as lowest Dioxin emitter.
-0.5
0
0.5
1
1.5
2
2.5
3
3.5
4
0 1000 2000 3000 4000 5000 6000
Dioxin/FuranConcentration(fg/m³)
Distance From Point Source (m)
Alternate Air Dispersal of Dioxins/Furans
Carranstown
Poolbeg
Montcada
(2001)
Montcada
(1996)
Figure 13 (b): Air Dispersion of Dioxins and Furans in the alternate wind direction
25. 24
Sensitivity Analyses
Three sensitivity analyses were carried out to serve a dual function of testing the model
consistency and demonstrating the effects that stack height, volumetric flow and exit gas
temperature on pollutant dispersal. Figure.14 and tables 3 and 4 all use the prevailing NOx
concentration for the Carranstown site as a parameter for the analysis.
Figure 14: Stack height variation
Figure.14 shows that the lower the stack height, the higher the associated emissions. While
an increase in stack height reduces overall emissions concentrations. However the rate of
lowering emissions slows once reaching a stack height of 60m. This analysis revealed that
the mean peak point for this parameter occurs at approximately 800m from the site source.
This point was utilised in the following sensitivity analyses.
Table.3 shows the effect of altering the volumetric flow of the model. The NOx emissions
steadily decrease from 39.86µm/m³ to 27.08µm/m³ as the flow rate increases in increments
of 10m³/s. Table.3 also notes a slight but steady increase in the buoyancy flux and an almost
exponential rate of increase of momentum flux mirror an increase in volumetric flow.
-10
0
10
20
30
40
50
100
200
300
400
500
600
700
800
900
1000
1100
1200
1300
1400
1500
1600
1700
1800
1900
2000
NOxConcentration(µm/m³)
Distance from Point Source (m)
Senstivity Analysis for Stack Height
20m
40m
60m
80m
100m
26. 25
Table 3: Volumetric Flow Sensitivity Analysis
Volumetric Flow m³/s 30 41.94 50 60 70
NOx Conc. µm/m³ 39.86 38.43 37.64 32.46 27.08
Buoyancy Flux m^4/s³ 20.084 28.073 33.473 40.168 46.863
Momentum Flux N·s·m−2
·s−1
71.631 139.996 198.975 286.524 389.991
Table.4 shows an increase in exit gas temperature results in a decrease in emission dispersal
at 800 m. Gas temperature increases also results in a buoyancy flux increase however
momentum flux is lowered with an increase in temperature.
Table 4: Gas Temperature Sensitivity Analysis
Gas Temp K 300 373 400 500 600
NOx Conc. µm/m³ 73.04 38.43 37.31 22.18 17.7
Buoyancy Flux m^4/s³ 3.055 28.073 35.019 54.197 66.983
Momentum Flux N·s·m−2
·s−1
174.062 139.996 130.546 104.437 87.013
27. 26
6) Discussion
To reiterate, the main objective of this study was to allay or justify the public’s concerns
with regards to the incineration of municipal solid waste. Collectively, the results show that
all four sites lie within the emission limits outlined in table.1 by many orders of magnitude.
The results were of sufficient resolution to make a number of inferences about the nature of
pollution dispersal within the incineration industry. The interpretation will look at each site
individually to highlight these.
Interpretation
Carranstown Site, Indaver
Out of the two Irish incinerators, the Indaver facility performs better on an all levels despite
having a stack 60% lower than the projected Poolbeg site. This is likely due to the fact is
located in a sparsely populated area and is correctly sized. Perhaps these concerns which
were reported in the Irish Independent (2014) are justified. Why site an incinerator in the
middle of the country’s most densely populated area? Why pay in excess of €600 million to
Covanta when Indaver have already successfully built an incinerator on Irish soil and have
offered to build a smaller sized plant at Poolbeg for FREE (Irish Independent, 2014). It
appears more than public health and air quality are on the agenda for this project.
Looking at greater depth at the Indaver plant, it has the best performance in limiting SOx
emissions with the exception of one high peak at ~400m. This would indicate that the
baghouse filter and evaporating spray reactor is performing particularly well at this facility.
This peak appears ain the same location for all 3 pollutants as shown in figures 11,12 and 13
(a). This initial peak is most likely due to a cement factory approximately 400m downdraft of
the site. Evidently, the building dimensions may trap pollutant emissions, elevating their
concentration briefly. This peak is still with safe limits for all three pollutants.
Nitrogen and Dioxin/Furan concentrations are also relatively low highlighting the
effectiveness of the ammonia injection and ceramic filters at the facility. It could also be a
testament to an efficient incineration of waste, preventing dioxins to reform de novo
synthesis.
28. 27
In the alternate wind scenarios (fig 11,12,13 (b)), the peak emissions have consistently
moved on to ~900m downdraft. This is most likely due to the absence of the cement factory
on this transect to disrupt pollutant dispersal. The emissions profiles in the alternate
scenarios witness a slight rise from 1800m to around 2600m. This is most likely due to the
complex terrain to the NE of the site which is higher than the stack in places.
Poolbeg Site, Covanta
The main reason the Poolbeg site has a higher relative emissions (fig. 11, 12, 13 (a)) profile is
because it is has a much larger capacity than the other facilities at 68t/hr according to
table.2. However this does not excuse the site from emitting more pollutants. The Florida
plant is a similar sized facility but has a considerably lower eco-impact. The similarities don’t
stop there; the stacks are also of a similar dimension as well as gas flow velocities and
temperatures. The main parameter these two sites differ on is their location. The Florida
site is located in a rural area while the Poolbeg facility will sit in a site with sea on one side
and a city on the other. This raises the concerns again over why the planning authorities are
so insistent in siting the facility here.
Another alarming comparison is when this facility is compared to the Montcada (1996)
facility in figure.13 (a). The state-of-the-art Poolbeg plant is performing as poorly as an
archaic incinerator with only an electrostatic precipitator as a gas cleaning technology in
preventing dioxin and furan releases. Although the concentrations are well below the limits,
shouldn’t a monstrous incinerator be performing better than a 40 year old treatment plant?
In defence of the Poolbeg project, the input values used are based on estimated data while
the rest of the studies rely on empirical data. In addition, given that the prevailing wind
carries emissions out to sea, the exceptionally high peak of emissions may be down to
marine temperature inversions which trap pollutants, hence raising their concentrations.
Looking at the alternate scenario for Poolbeg, the wind is now taking emissions across the
city instead of out to sea. An upward inflection in all pollutant concentrations from about
2.7 km is most likely due to the presence of a number of residential buildings at Fairview
and Santry. These are more likely to trap emissions, increasing their concentrations of
29. 28
pollutants. The urban heat island could also come into effect here, which can affect the
buoyancy of the air, causing emissions to linger for longer.
Montcada Site, Tersa
The prevailing profile of this facility has a similar shape to the Poolbeg one albeit at much
lower concentrations across the board. This is most likely because this facility is also located
on the coast and its stack emissions may also be under the influence of a marine
temperature inversion. The alternate wind scenario (fig 11,12,13 (b)) also takes this facility’s
emissions across the city and this causes the emissions profile to warp considerably. At
<200m distance the profile peaks and then troughs again at 500m and then steadily rises up
until 2000m before trailing off. This is explained by the presence of particularly high
buildings at ~350 m, 1,100m and 1700m which were modelled in Screenview.
Moving on to the most interesting part of the Montcada site; Figure.13 (a) and (b) show the
Dioxin/Furan emission profiles and include the Montcada facility before and after
renovations to upgrade the gas clean-up infrastructure. Taking the peak of both profiles in
both prevailing and alternate scenarios, this represents an emissions reduction of 65%. This
figure can be directly attributed to the addition of a wet scrubber and active-carbon fabric
filter and their effectiveness at preventing the release of these highly problematic emitters
(Meneses et al, 2004).
Florida Site, Wilcox & Babcock
The stand out feature of this site was the complete omission of dioxin and furan
concentrations in any of the associated literature. There was not a single mention of these
highly hazardous pollutants in the air modelling report for the site (Solid Waste Authority of
Palm Beach County, 2010). Interestingly, there is no use of the term “incinerator” in this
report either with the 42 tonne per hour plant being referred to as a “renewable energy
facility”. It was quite evident this report was guilty of green washing.
Nonetheless the facility appears to perform resonably well in minimizing emissions. While
an American facility would greenwash their product in a heart-beat in order to secure more
sales, one could be sure that the facility will have the most advanced levels of technology.
30. 29
The facility is surronded by a similar landscape 360° and did not show much variation in
emmsions between the two scenerios figures. 11 and 12 (a) and (b).
Limitations
There are a number of limitations associated with this study yielding lower resolution data
for each site and causing higher uncertainty in the results.
Input data:
The data obtained for the model inputs has, for the most part been sourced from
documentation provided by the operators of the respective facilities. Obviously it is within
these company’s interests to present emission limits which remain within the legislative
limits. Had the activity data been sourced from an unbiased organisation such as the EPA,
and was based on empirical measurements, the integrity of the model would be greatly
enhanced.
Modelling Software:
The “Screenview” software offers a very limited range of data-manipulation features which
prevents the user from creating a model that is consistent with the real life scenario. The
software does not allow simultaneous use of urban terrain and shoreline fumigation which
was required for the Poolbeg and Montcada scenarios. Furthermore it is not possible to
model the concentration of emissions on terrains higher than the overall stack height. The
modelling function has a very linear nature in the sense that it utilises very simple input data
on a single transect and outputs extremely simplified results on a graph based on the
distance from the source. More advanced models such as “AERMOD” overlay results on a
raster file of the given geographical area giving 360° emission concentrations from the
source based on variable wind speeds.
31. 30
7) Conclusions
The results of this study show a strong argument that the incineration of waste is
safe for human health.
The concentrations of NOx, SOx and Dioxins/Furans were found to be several orders
of magnitude lower than emissions limits illustrated by the waste incineration
directive (WID 2000/76/EC).
By comparing the results of a renovated incineration plant in Barcelona, it was
shown that modern gas-cleaning technologies can reduce the emission of cancer-
causing Dioxin/Furans by 65%.
Despite being intimately located in the heart of Ireland’s largest population centre;
the Poolbeg incinerator is appears to be well below the prescribed emissions limits.
However an alarming comparison was made between it and a 1975 standard
incinerator which performed almost exactly the same with respect to preventing
dioxin/furan release.
The major limitation of this study lies on the source of its data; considering most
data was sought from the respective companies which built the infrastructure in the
first place, they are hardly going to publish data which does not look well for the
company’s reputation.
32. 31
Reference List
Babcock & Wilcox (2012) Palm Beach County Renewable Energy Facility No. 2. Available from:
http://www.babcock.com/library/Documents/sp-585.pdf [accessed 24 April, 2015].
Cangialosi, F. Intini, G. Liberti, L. Notarnicola, M. Stellacci, P. (2008) “Health risk assessment of air
emissions from a municipal waste incineration plant – A case study”, Waste Management,
28, 885-895.
Cavazza, N. & Rubichi, S. (2014) “Ways of thinking about the incinerator: A typology of citizen’s
mind-sets”, The Social Science Journal, 51, 422-430.
Cherubini, F. Bargigli, S. Ulgati, S. (2009) “Life cycle assessment (LCA) of waste management
strategies: Landfilling, sorting plant and incineration”, Energy, 34, 2116-2123.
Covanta. (2015) Covanta.com Available from: <http://www.covanta.com/about-
covanta/sustainability.aspx> [Accessed 09 February 2015].
Davies, A. (2010) “Waste wars – public attitudes and the politics of place in the waste management
strategies”, Irish Geography, 36(1), 77-92.
Department for Environment, Food and Rural Affairs (DEFRA). (2007) “Advanced thermal treatment
of municipal solid waste”. London, DEFRA.
Dublin Waste to Energy. (2015) dublinwastetoenergy.ie. Available from:
http://dublinwastetoenergy.ie/?page_id=318 [Accessed 09 February 2015].
EPA (a). (2015) Environmental Protection Agency Ireland. Available from:
http://www.epa.ie/air/quality/monitor/#.VTkGwyFViko [Accessed 25 March 2015].
European Council Directive 96/61/EC (1996) Best Available Techniques : Council Directive 96/61
concerning integrated pollution prevention and control (IPPC).
Hjelmar, O. (1996) “Waste Management in Denmark”, Waste Management, 16, 389-394.
Holbert Faculty. (2003) Holbert.faculty.adu. Availabble from:
http://holbert.faculty.asu.edu/wise/electrostaticprecip.html [Accessed 16 April 2015].
Indaver. (2009) “Environmental impact statement for the Meath waste management facility”.
Available From: http://www.epa.ie/licences/lic_eDMS/090151b28031ebd2.pdf [Accessed 14
November 2014].
Indaver. (2015) Indaver.ie. Available From:
http://sustainabilityreport.indaver.com/index.php?id=289 [Accessed 14 April 2015].
Intech (2014) Intechopin.com. Available from: http://www.intechopen.com/books/waste-
management-an-integrated-vision/greenhouse-gas-emissions-from-housing-and-manure-
management-systems-at-confined-livestock-operations [Accesses 14 April 2015].
Irish Independent. (2014) Independent.ie. Available from: < http://www.independent.ie/irish-
news/firm-offers-to-build-incinerator-for-free-26819683.html> [Accessed 20 April 2015].
ISWA (International Solid Waste Association). (2012) Waste-to-energy: State of the art report.
Statistics 6th
Edition, RAMBOLL, Denmark.
33. 32
Meneses, M. Schuhmacher, M, Domingo, J.L. (2004) Health risk assessment of emissions of dioxins
and furans from a municipal waste incinerator: comparison with other emission sources.
Environmental International, 30, 481-489.
Moy, P. Krishnan, N. Ulloa, P. Cohen, S. Brandt-Rauf, P.W. (2008) “Options for management of
municipal solid waste in New York City – A preliminary comparison of health risks and policy
implications”, Journal of Environmental Management, 87, 73-79.
Murdoch University. (2014) see.murcdoch.edu. Available from:
<http://www.see.murdoch.edu.au/resources/info/Tech/waste/> [Accessed 12 November
2014].
Pollution Systems. (2014) pollutionsystems.com. Available from:
http://www.pollutionsystems.com/wet-scrubbers.html [Accessed 15 April, 2015].
Protection of the Environment Act. (2003) Irish staute book. Available from:
http://www.irishstatutebook.ie/pdf/2003/en.act.2003.0027.pdf [Accessed 6 April, 2015].
Sabbas, T. Polettini, A. Pomi, R. Astrup, T. Hjelmar, O. Mostbauer, P. Cappai, G. Magel, G. Salhoffer,
S. Speiser, C. Heuss-Assbichler, S. Klein, R. Lechner, P. (2003) “Management of municipal
solid waste incineration residues”, Waste Management, 23, 61-88.
Solid Waste Authority of Palm Beach County. (2010) “Class 1 Air Dispersion Modelling Report: Palm
Beach Renewable Energy Facility No.2. Malcolm Pirnie, Plantation, Florida.
Tri-Mer (2013) tri-mer.com. Available From: http://www.tri-mer.com/particulate-control-PM25.html
(Accessed, 15 April 2015).
Van Gervan, T. Geysen, D. Stoffels, L. Jaspers, M. Wauters, G. Vandecasteele, C. (2005)
“Management of incinerator residues in Flanders (Belgium) and in neighbouring countries. A
comparison”, Waste Management 25, 75-87.
Waste Incineration Directive (WID 2000/76/EC). (2000) Directive 2000/76/ec of the European
Parliament and of the Council of 4 december 2000 on the incineration of waste, Official
Journal of the European Communities, 332, 91-111.
Zandaryaa, S. Gavasci, R, Lombardi, F. Fiore, A. (2001) “Nitrogen oxides from waste incineration:
control by selective non-catalytic reduction”, Chemosphere, 42, 491-497.