SlideShare une entreprise Scribd logo
1  sur  24
McKinsey & Company 1
Five emerging consumer themes in 2021
1 4
3
2
Spending has
recovered
to 20-30% year-over-
year growth; 4-7%
year-over-year
growth vs. pre-
COVID-19 growth
trajectory
Loyalty shakeup
continues, with
30–40% of
consumers, most
notably millennials and
Gen Z, continuing to
switch brands or
retailers
Disparate
recovery across
categories:
sustained momentum in
some categories (e.g.,
home), normalizing
performance in others
(e.g., grocery), and
strong growth where
consumers may splurge
post vaccination (e.g.,
cosmetics)
.com step
change has
stuck as
e-commerce sustains
growth of 35% or
more year-over-year,
while brick-and-
mortar recovers to
5% year-over-year
growth in March -
June
Homebody
economy
persists: 28% of
consumers have
invested in new uses
of their living space
at home, and 70% of
companies plan to
continue some type
of remote working
even after the
pandemic
5
Source: Based on 3rd-party data between Feb 2019 and Jun 2021, as well as longitudinal surveys conducted between Mar 2020 and Feb 2021 in the United States
1. Year-over-year growth for Mar–Jun 2021 relative to estimate of Mar–Jun 2020 growth had COVID-19 not occurred
McKinsey & Company 2
1. US consumer spending maintained strong growth in March to
June 2021, following signs of recovery in late 2020
Signs of spend recovery
Source: Affinity Solutions credit-card spend data for Feb 2019–Jun 2021; “Impact of stimulus payments on consumer spending,” Earnest Research, Feb 2021
Year-over-year growth in credit-card spend,1 %
10%
-6%
-18%
-9%
-6% -5% -3%
1% 2% 1%
-2%
3%
-4%
20%
40%
27% 25%
Nov
Feb Mar Jun
Apr May Aug
Jul Sep Oct Dec Jan Feb Mar Apr May Jun
1st round
of stimulus
2nd
round of
stimulus
Holiday pull-
forward spend
Mar–Aug
6-month YoY
change: –8
Sep–Feb
6-month YoY
change: 0
Comparison with pre-COVID-19
months2
vs. re-
forecasted
Jun 2020
spend if
COVID-19
had not
occurred3
vs. Jun
2020 actual
spend
Comparison with
COVID-19-affected
months
Stimulus payments and
holiday-influenced
recovery in the 6 months
prior
Spend is normalizing, with
solid growth for Mar-Jun
vs. re-forecasted Mar-Jun
2020 spend had COVID-19
not occured3
Those who received stimulus
money in Apr-May and Jan
showed a 15-20% uplift in
spend.4 Early holiday shopping
in Oct and Nov helped support
growth in those months
Relative to Mar-Jun 2020 actual
spend (start of pandemic in the
US), spend is up 20%
3rd
round of
stimulus
5
5
4
7
1. Includes credit-card and some debit-card spending data among banked consumers. While card spending represents only a part of overall consumer spending (such as housing, utilities and other
major categories excluded from credit-card spending), the changes in card data closely track changes in official consumption figures reported by the Bureau of Economic Analysis. This is because
the share of unaffected categories in card spending is comparable with the share of categories not affected negatively by COVID-19 in overall consumption (which includes housing). Year-over-
year growth in monthly sales during the current period (Feb 2020–Jun 2021) compared with monthly sales in prior period (Feb 2019–Jun 2020)
2. Year-over-year spend in Mar–Aug 2020 decreased by 8% compared with same period in previous year, whereas Sep 2020–Feb 2021 remained flat compared with same period in previous year
3. Re-forecasted Mar–Jun 2020 spend calculated by growing Feb–May 2020 spend by the same 1-month growth rate observed in Feb–May 2019
4. Year-over-year change in spend for stimulus recipients, vs those who did not receive stimulus payments
Current as of June 2021
McKinsey & Company 3
Confidence in own country’s economic recovery after COVID-191
% of US respondents
13 16 14 15 16 16 16 15 15
20 18 17 18 19 21 17 17 14 13 14
43
45
45
47 46
48 48 52 52
49 49 49 47 46
46
46 45
44 46 45
44
39 41 37 39 35 36 33 34 32 33 34 36 35 32 36 39 42 41 41
Oct
23–27
May
4–10
Mar
16–17
Mar
20–22
Mar 30–
Apr 5
Apr
6–12
Apr
13–19
Apr 27–
May 3
Apr
20–26
Jul
7–12
May
11–17
May
18–24
Jun
1–7
Jun
15–21
Jul 30–
Aug 2
Aug
19–23
Sep
18–24
Nov
9–13
Feb
18–22
Mar
23–29
Mixed: The economy will
be affected for 6–12
months or longer and will
stagnate or show slow
growth thereafter
Pessimistic: COVID-19
will have lasting impact
on the economy and
show regression or fall
into lengthy recession
Optimistic: The
economy will rebound
within 2–3 months and
grow just as strong as or
stronger than before
COVID-19
1. Spend recovery in the United States is driven by increased
consumer optimism
Signs of spend recovery
Source: McKinsey & Company COVID-19 US Consumer Pulse Survey Feb 18–22, 2021, n = 2,076; Nov 9–13, 2020, n = 2,024; Oct 23–27, 2020, n = 2,021; Sep 18–24, 2020, n = 1,026; Aug 19–23, 2020, n = 2,026; Jul 30–Aug 2, 2020, n = 2,024; Jul 7–12, 2020, n = 1,923; Jun 15–
21, 2020, n = 2,006; Jun 1–7, 2020, n = 1,966; May 18–24, 2020, n = 1,975; May 11–17, 2020, n = 2,002; May 4–10, 2020, n = 1,993; Apr 27–May 3, 2020, n = 2,105; Apr 20–26, 2020, n = 1,052; Apr 13–19, 2020, n = 1,052; Apr 6–12, 2020, n = 1,063; Mar 30–Apr 5, 2020,
n = 1,484; Mar 23–29, 2020, n = 1,119; Mar 20–22, 2020, n = 1,073; Mar 16–17, 2020, n = 1,042; sampled and weighted to match the US general population 18+ years
2020 2021
1. Q: What is your overall confidence level surrounding economic conditions after the coronavirus (COVID-19) crisis subsides (i.e., once there is herd
immunity)? Rated from 1 “very optimistic” to 6 “very pessimistic”
Figures may not sum to 100% because of rounding
Current as of February 2021
Conducted before spring/summer
2021 surge in infections
McKinsey & Company 4
Confidence in own country’s economic recovery after COVID-191
% of respondents
10
18 17
32
21
31
20
37
43
53 59
50
62
52 67
61
47
30
24
18 17 17 12
2
14
45
41
Mixed: The economy will be
impacted for 6–12 months or
longer and will stagnate or show
slow growth thereafter
Pessimistic: COVID-19 will
have lasting impact on the
economy and show regression/
fall into lengthy recession
Optimistic: The economy will
rebound within 2–3 months and
grow just as strong as or
stronger than before COVID-19
1. The United States is more optimistic than European countries but
less so than China or Mexico
Signs of spend recovery
1. Q: What is your overall confidence level surrounding economic conditions after the coronavirus (COVID-19) crisis subsides (i.e., once there is herd immunity)? Rate from 1 “very optimistic” to 6 “very pessimistic”
Bars may not sum to 100 percent due to rounding
2. China’s increase in optimism was compared with Sep instead of Nov
United
States China Germany
United
Kingdom Spain
Italy
France Japan
Feb 18 –
Feb 22
Feb 20 –
Mar 8
Feb 23 –
Feb 27
Feb 23 –
Feb 27
Feb 23 –
Feb 27
Feb 23 –
Feb 27
Feb 23 –
Feb 27
Feb 23 –
Feb 27
Source: McKinsey & Company COVID-19 Consumer Pulse Survey
Mexico
Feb 20 –
Mar 2
0 9
3 13 1 7 4 3 5
X Increase in optimism since Nov 2020
percentage points2
Conducted before spring/summer
2021 surge in infections
Current as of February 2021
McKinsey & Company 5
1. Consumers’ optimism manifests in their excitement to splurge,
especially among younger and wealthier consumers
>70%
<30% 50–70%
30–49%
Source: McKinsey & Company COVID-19 US Consumer Pulse Survey Feb 8–22, 2021, n = 2,076, sampled and weighted to match the US general population 18+ years
~51%
Plan to splurge or
treat themselves
32
50
53
29
51
66
63
34
65
82
66
46
Expected leisure spend in 20211
% of respondents who plan to treat themselves or splurge
Gen Z
(18–24 years old)
Millennials
(25–40 years old)
Gen X
(41–56 years old)
Generation
2
Middle
Low High
Baby boomers
(57–75 years old)
Household income
($50,000–
$100,000/year)
(<$50,000/year) (>$100,000/year)
Signs of spend recovery
1. Q: With regard to products and services you will spend money on, do you plan to splurge/treat yourself in 2021? Figures may not sum to 100% because of rounding
2. Ages by generation as of 2021. Members of Gen Z were born in 1997–2012, millennials in 1981–96, Gen X in 1965–80, and baby boomers in 1946–64. The traditionalist/silent generation is
not included, due to a low sample size
Current as of February 2021
McKinsey & Company 6
1. This extra spend is expected across categories, and more than half
of consumers plan to treat themselves before COVID-19 subsides
Expected leisure categories on which people
plan to splurge or treat themselves in 20211
% of respondents who plan to splurge or treat themselves
46
44
43
37
32
30
28
28
27
Out-of-home entertainment
Restaurants, dining out, bars
​Apparel, shoes, accessories
Travel, lodging, vacation
Beauty and personal care
Electronics
Items for your home
Household essentials
Fitness, sports, outdoors
Trigger for when people plan to splurge or treat themselves2
% of respondents who plan to splurge or treat themselves on that category
24
16
32
29
32
37
15
26
20
22
26
23
26
21
20
27
22
28
15
13
13
12
14
10
14
18
17
40
45
32
34
33
34
44
34
36
Anytime When family is vaccinated
When government restrictions lifted / COVID-19 stops spreading
When I am vaccinated
Source: McKinsey & Company COVID-19 US Consumer Pulse Survey Feb 18–22, 2021, n = 2,076, sampled and weighted to match the US general population 18+ years
Signs of spend recovery
1. Q: You mentioned that you plan to splurge/treat yourself in 2021. Which categories do you intend to treat yourself to? Please select all that apply
2. Q: Which best describes when you will most likely splurge/treat yourself? Figures may not sum to 100% because of rounding
Current as of February 2021
McKinsey & Company 7
Estimated 2020 and Q1 2021 savings, ratio to corresponding 2019 savings
1. Spending restrictions during COVID-19 and stimulus payments
boosted savings and ability to spend in 2021, especially in US
Signs of spend recovery
Source: BEA; Eurostat; Oxford Economics; McKinsey Global Institute analysis
2.3x
US
3.1x
UK
2.1x
1.7x
1.5x
Germany
1.8x
1.6x
France
1.7x
1.1x
China
1.1x
Q1 2021 vs Q1 2019
2020 vs 2019
2019 (base)
Current as of Q1 2021
McKinsey & Company 8
1. Spend by lower-income groups drove disproportionate growth until
April 2021, when higher-income consumer spend outpaced others
Signs of spend recovery
Source: Affinity credit card spend data from Feb 2019 to Jun 2021 (spend samples cardholders and underrepresents highest- and lowest-income bands)
Year-over-year credit card spend by population sub-segment,1 %
−30
−20
−10
0
10
20
30
Feb
Mar
Apr
May
Jun
May
Jul
Apr
Aug
Sep
Oct
Jan
Nov
Dec
Feb
Mar
Jun
Low ($0–35,000) High (≥$80,000)
Medium ($35,000–$80,000)
Stimulus payment
7 Lower-income
consumers −2
−1 Higher-income
consumers 10
Medium-income
consumers
3 4
Cumulative year-
over-year change
Jun 2021 vs Jun 2020
year-over-year change
Change in spend, by income level,1 %
2020 2021
1. Re-forecasted Mar–Jun 2020 spend calculated by growing Feb–Jun 2020 spend by the same 1-month growth rate observed for Feb–Jun 2019
Current as of June 2021
McKinsey & Company 9
Source: Affinity Solutions credit-card and debit-card spend data for Feb 2019–Jun 2021; Facteus debit-card spend data for Feb 2019–Jun 2021;
Stackline Amazon spend data for Feb 2019–Jun 2021
2. Online penetration shifted upward with COVID-19’s onset and
has remained ~35 percent above pre-COVID-19 levels
Omnichannel is here to stay
~35%
Increase in online
penetration since
Mar 2020, based
on credit-card and
debit-card spend
Retail-oriented online credit-card and debit-card spend as % of total1
19
20
27 27
25
26
25 25 25
29
30
27
26 26
25
24
26
Jun Apr
May
Last 12
months2
Mar
2020
Dec
Aug
Jul
Apr Sep Oct Mar
Nov Jan
2021
Feb May Jun
~+35%
1. Includes the following retailer categories: Amazon; apparel, software and electronics, cosmetics; pet shops; home stores; mass stores; club stores;
restaurants; grocery stores; drugstores; discount stores
2. Average monthly online penetration from Mar 2019 to Feb 2020
Current as of June 2021
McKinsey & Company 10
2. The trajectory of e-commerce penetration has differed by
category and retailer
Omnichannel is here to stay
Source: Affinity Solutions credit-card and debit-card spend data for Jan 2019–Jun 2021; Facteus debit-card spend data for Jan 2019–Jun 2021;
Stackline Amazon spend data, Jan 2019–Jun 2021
46%
83%
55%
Apr 2020
spike
Pre-
COVID-19,
last 12
months5
Jun 2021
+18%
13%
19% 20%
Jun 2021
Apr 2020
spike
Pre-
COVID-19,
last 12
months5
+63% 5% 9% 9%
Pre-
COVID-19,
last 12
months5
Jun 2021
Apr 2020
spike
+75%
Online sales as a % of overall sales for credit-card and debit-card spend,1
by level of pre-COVID-19 penetration
High penetration2
(>20%)
Moderate penetration3
(7–20%)
Low penetration4
(<7%)
Categories with lower pre-COVID-19 online penetration saw higher e-commerce growth in March and may
be more likely to sustain online penetration rates seen during the pandemic
Categories with already high online penetration
saw a dramatic spike during April’s lockdowns
1. Re-forecasted Mar–Jun 2020 spend calculated by growing Feb–May 2020 spend by the same 1-month growth rate observed for Feb–May 2019
2. High-online-penetration retail categories include those with >20% pre-COVID-19 internet penetration: apparel, software and electronics, cosmetics, pet shops
3. Medium-online-penetration retail categories include those with 7–20% pre-COVID-19 internet penetration: home stores, mass stores, club stores
4. Low-online-penetration retail categories include those with <7% pre-COVID-19 internet penetration: restaurants, grocery stores, drugstores, discount stores
5. Online penetration from Mar 2019 to Feb 2020
Current as of June 2021
McKinsey & Company 11
2. On a year-over-year basis, e-commerce has grown by more than
40 percent while brick-and-mortar has remained flat
Retail channel, year-over-year growth in spend,1 2019–21, %
Total3
Brick-and-
mortar sales4
E-commerce
sales4
Source: Affinity Solutions credit-card spend data for Feb 2019–Jun 2021; Stackline Amazon spend data, Jan 2019–Jun 2021
Year-over-year
change
Last 12 months vs
last 13–24 months
1
2
44
E-
commerce
acceleration
Apr–May
−13
−13
62
Early
summer
Jun–Jul
−5
−3
52
Holiday
Nov–Dec
0
−2
41
Early 2021
Jan–Feb
−1
2
44
Fall
Aug–Oct
0
3
49
May–Jun2
6
5
39
Early
shelter in
place
Mar
1
27
−6
Pre-
COVID-19
Feb 2020
7
24
10
Start of
recovery2
Mar–Apr
5
5
48
Omnichannel is here to stay
Current as of June 2021
1. Includes credit-card and some debit-card spending data among banked consumers. While card spending represents only a part of overall consumer spending (such as housing, utilities, and other major categories excluded from credit-card
spending), the changes in card data closely track changes in official consumption figures reported by the Bureau of Economic Analysis. This is because the share of unaffected categories in card spending is comparable with the share of
categories not affected negatively by COVID-19 in overall consumption (which includes housing). Year-over-year growth in monthly sales during current period (Feb 2020–Jun 2021) compared with monthly sales in prior period (Feb 2019–Jun
2020)
2. Year-over-year growth for Mar–Jun 2021 relative to estimate of Mar–Jun 2020 had COVID not occurred. Re-forecasted Mar–Jun 2020 spend calculated by growing Feb–May 2020 spend by the same 1-month growth rate observed for Feb–
May 2019
3. Includes the following retail channels: Amazon; apparel, software and electronics, cosmetics; pet shops; home stores; mass stores; club stores; restaurants; grocery stores; drugstores; discount stores; auto and cable/telecom (not shown
separately); and experiences, including out-of-home entertainment and travel
4. Includes the following retailer categories: Amazon; apparel, software and electronics, cosmetics; pet shops; home stores; mass stores; club stores; restaurants; grocery stores; drugstores; and discount stores
Year-over-year sales growth, %
−10 0 10 20
−20
< −30 > 30
McKinsey & Company 12
2. Telecom has remained flat; experiences (travel and out-of-home
entertainment) have yet to return to pre-Covid-19 levels
Source: Affinity Solutions credit-card spend data for Feb 2019–Jun 2021
Omnichannel is here to stay
Experiences
(e.g., travel,
out-of-home
entertainment)
Telecom and
cable
Fuel and
other auto3
−46
−4
−21
−73
2
−41
−58
0
−22
−52
1
−16
−52
2
−18
−51
2
−8
−13
−1
−1
7
7
10
−41
1
−10
−32
2
−3
Current as of June 2021
1. Includes credit-card and some debit-card spending data among banked consumers. While card spending represents only a part of overall consumer spending (such as housing, utilities, and other major categories excluded from credit-card
spending), the changes in card data closely track changes in official consumption figures reported by the Bureau of Economic Analysis. This is because the share of unaffected categories in card spending is comparable with the share of
categories not affected negatively by COVID-19 in overall consumption (which includes housing). Year-over-year growth in monthly sales during current period (Feb 2020–Jun 2021) compared with monthly sales in prior period (Feb 2019–Jun
2020)
2. Year-over-year growth for Mar–Jun 2021 relative to estimate of Mar–Jun 2020 had COVID-19 not occurred. Re-forecasted Mar–Jun 2020 spend calculated by growing Feb–May 2020 spend by the same 1-month growth rate observed for
Feb–May 2019
3. Includes automotive parts and accessories retailers (e.g., AutoZone, Napa), fuel dispensers (e.g., Chevron, CITGO), and service stations (e.g., BP, Shell, 76, Hess)
Year-over-year
change
Last 12 months vs
last 13–24 months
E-
commerce
acceleration
Apr–May
Early
summer
Jun–Jul
Holiday
Nov–Dec
Early 2021
Jan–Feb
Fall
Aug–Oct May–Jun
Early
shelter in
place
Mar
Pre-
COVID-19
Feb 2020
Start of
recovery2
Mar–Apr
Retail channel, year-over-year growth in spend,1 2019–21, %
Year-over-year sales growth, %
−10 0 10 20
−20
< −30 > 30
McKinsey & Company 13
3. Channel and category performance has evolved into five distinct
performance types over the course of the pandemic
Disparate recovery
Early pandemic
May–Jul 2020
Later 2020
Aug–Dec
Early 2021
Jan–May
Description Categories/ channels
A Robust year-over-year growth throughout, due to
larger consumer shifts (e.g., homebody economy)
Sustained
elevation
 Amazon
 Software and electronics
 Home
 Pet shop
 Sporting apparel
 Cosmetics
B Fast rise in early days of COVID-19, with growth
subsiding over time
/
Normalizing
growth
 Grocery channels
 Discount stores
 Mass stores
 Wholesale clubs
 Drugstores and
pharmacies
C Steady demand, not affected by COVID-19
Unaffected  Telecom/cable
D Significant declines at the outset of COVID-19, with
quicker recovery
Approaching
recovery
 Retail apparel
 Fuel and other auto
 Restaurants
E Larger decline (−50% or more year over year), with
slower path to recovery
Larger decline  Out-of-home entertainment
 Travel
Current as of June 2021
McKinsey & Company 14
3. Disparate recovery is observed among categories – some are
experiencing sustained elevation, while others remain depressed
Disparate recovery
Source: Affinity credit card spend data for Feb 2019–Jun 2021; Stackline Amazon spend data for Feb 2019–Jun 2021
Year-over-year sales growth, %
Amazon2
Software and electronics
Home
Pet shops
Sporting apparel
Restaurants
Fuel and other auto
Retail apparel
Out-of-home entertainment
Travel
Total
Pre-
COVID-19
Feb 2020
Early shelter
in place
Mar
Fall
Aug–Oct
E-commerce
acceleration
Apr–May
Early
summer
Jun–Jul
2021
Jan–Feb
Mar–Apr
adjusted1
Holiday
Nov–Dec
Sustained
elevation
Normalizing
growth
Approaching
recovery
Larger
decline
Unaffected
Discount stores
Wholesale clubs
Mass
Drugstores and pharmacies
Cosmetics
Grocery stores
Telecom/cable
30
13
15
15
6
9
10
5
30
5
10
4
15
10
7
14
9
7
38
9
2
24
−14
−24
−21
−43
−52
−46
−6
18
20
15
22
−9
36
−4
36
28
35
21
27
−1
−16
−9
−78
−49
0
13
13
8
10
8
10
1
45
29
24
18
−6
−26
−41
−53
−79
−72
−13
9
0
9
2
1
15
2
40
23
28
19
25
−10
−22
−15
−79
−56
−5
9
9
3
9
9
9
0
May–Jun
adjusted1
34
25
21
22
36
5
−1
7
−28
−12
6
12
10
7
7
25
6
−1
30
22
30
22
21
−2
−8
−5
−75
−48
−1
13
12
10
1
14
9
2
40
26
34
24
36
3
−3
3
−62
−28
4
31
13
7
4
30
5
2
37
20
28
6
22
11
16
7
8
−6
−18
−12
5
−78
9
−48
0
2
15 30
−15 > 30
−30
< −45
1. Year-over-year growth for Mar–Jun 2021 relative to estimate of Mar–Jun 2020 had COVID not occurred. Re-forecasted Mar–Jun 2020 spend calculated by growing Feb–May 2020 spend by the same 1-month growth rate observed for Feb–
May 2019
2. Excludes sales in automotive, beauty, grocery, home improvement, home and furniture, pet supplies, apparel and accessories, electronics, sports and outdoors, as these categories are embedded into subsequent rows
Current as of June 2021
McKinsey & Company 15
3. Sustained elevation: Some categories see continued increased
demand, but lower-income consumers are starting to decelerate
Disparate recovery
Source: Affinity Solutions credit-card spend data for Feb 2019–Jun 2021; Stackline Amazon spend data for Jan 2019–Jun 2021
Year-over-year credit-card spend by income segment,1 %
Home
60
−40
40
0
−20
20
80
Apr
Mar
Feb
Mar
Feb
Apr
May
Jun
Jul
Aug
Sep
Oct
Nov
Dec
Jan
May
Jun
$0–35,000 $35,001–80,000 >$80,000
Sporting apparel
0
60
−40
−20
20
40
80
Feb
Mar
Apr
May
Jun
Jul
Aug
Sep
Oct
Dec
Nov
Feb
Jan
Mar
Apr
May
Jun
Software and electronics
40
−40
80
20
0
−20
60
May
May
Jul
Feb
Mar
Oct
Apr
Mar
Jun
Aug
Sep
Nov
Dec
Jan
Feb
Apr
Jul
80
−20
−40
40
0
20
60
Mar
Jul
Feb
Mar
Apr
May
Jun
Aug
Jun
Sep
Oct
Nov
Dec
Apr
Jan
Feb
May
Pet shops
A. Sustained elevation
Current as of June 2021
1. Mar–Jun figure is based on re-forecasted Mar–Jun 2020 spend to estimate Mar−Jun 2020 spend without COVID-19. Calculated by growing Feb−Jun 2020 spend by the same 1-month growth rate observed for Mar−Jun 2019. Note that not all
panelists have income identified, so the stratified income view does not always match the total view
McKinsey & Company 16
3. Normalizing growth: Initial surge subsided with higher-income
consumers now starting to outpace others
Disparate recovery
Source: Affinity Solutions credit-card spend data from 2/2019–6/2021; Stackline Amazon spend data from 1/2019–6/2021
20
−10
−20
40
0
10
30
Apr
Feb
Jul
Mar
May
Jun
Aug
Sep
Oct
Nov
Dec
Jan
Feb
Mar
Apr
May
Jun
−20
−10
40
0
10
20
30
May
Jun
Feb
Mar
Apr
May
Jul
Aug
Sep
Oct
Nov
Dec
Jan
Apr
Feb
Mar
Jun
Discount stores
−20
−10
0
10
30
20
40
Aug
Nov
Feb
Mar
Apr
Apr
May
Jun
Jul
Dec
Sep
Mar
Oct
Jan
Feb
May
Jun
Wholesale clubs
Mass stores2
40
−20
0
30
−10
10
20
Feb
Apr
Apr
Mar
May
Aug
Jun
Jul
Sep
Oct
Nov
Jan
Dec
Feb
Mar
May
Jun
Grocery
30
−20
−10
0
10
20
40
Mar
Feb
Jun
Mar
Jun
Nov
Apr
Oct
May
Jul
Aug
Sep
Dec
Jan
Feb
Apr
May
Drugstores and pharmacies
$0–35,000 $35,001–80,000 >$80,000
B. Normalizing growth
Year-over-year credit-card spend by income segment,1 %
Current as of June 2021
1. Mar–May figure is based on re-forecasted Mar–Jun 2020 spend to estimate Mar–Jun 2020 spend without COVID-19. Calculated by growing Feb–Jun 2020 spend by the same 1-month growth rate observed for Mar–Jun 2019. Note that not
all panelists have income identified, so the stratified income view does not always match the total view
2. Mass stores includes Target and Walmart
McKinsey & Company 17
Year-over-year credit-card spend by income segment,1 %
3. Approaching recovery: After initial steep declines, some categories
have seen recovery as consumers increase in-person spend
Disparate recovery
Source: Affinity Solutions credit-card spend data for Feb 2019–Jun 2021; Stackline Amazon spend data for Jan 2019–Jun 2021
20
−100
−20
−40
−80
−60
0
Feb
Mar
Mar
Apr
May
Jun
Jul
Aug
Sep
Oct
Nov
Dec
Jan
Feb
Apr
May
Jun
100
−50
0
50
150
200
Feb
Mar
Apr
May
Jun
Jul
Aug
Sep
Oct
Nov
Dec
Jan
Feb
Mar
Apr
May
Jun
Online purchase
Quick-service restaurants
On-site
Retail apparel
In-store
−100
20
−80
−60
−40
−20
0
Apr
Feb
Mar
Apr
Dec
Jul
May
Jun
Aug
May
Sep
Oct
Nov
Jan
Feb
Mar
Jun
−50
150
200
100
0
50
Mar
Feb
Jan
Sep
Aug
Nov
Apr
May
Jun
Jul
Dec
Oct
Feb
Mar
Apr
May
Jun
Online purchase
$0–35,000 $35,001–80,000 >$80,000
D. Approaching recovery
Current as of June 2021
1. Mar–Jun figure is based on re-forecasted Mar–Jun 2020 spend to estimate Mar–Jun 2020 spend without COVID-19. Calculated by growing Feb–May 2020 spend by the same 1-month growth rate observed for Feb–May 2019. Note that not
all panelists have income identified, so the stratified income view does not always match the total view
McKinsey & Company 18
Year-over-year credit-card spend by income segment,1 %
−30
−90
−80
40
−70
−40
−60
−50
0
−20
−10
10
20
30
Jan
Feb
Sept
Mar
Mar
Apr
May
June
Jun
Jul
Aug
Oct
Nov
Dec
Feb
Apr
May
3. Larger declines seen in travel and out-of-home categories are
starting to recover
Disparate recovery
Source: Affinity Solutions credit-card spend data for Feb 2019–Jun 2021; Stackline Amazon spend data for Jan 2019–Jun 2021
−50
−90
−30
−80
−70
−60
−20
−40
−10
0
10
20
30
40
Jun
Dec
Oct
Mar
June
Feb
Apr
May
Mar
Jul
Aug
Sept
Nov
Jan
Feb
Apr
May
Travel
$0–35,000 >$80,000
$35,001–80,000
Out-of-home entertainment
E. Larger decline
Current as of June 2021
1. Mar–Jun figure is based on re-forecasted Mar–Jun 2020 spend to estimate Mar–Jun 2020 spend without COVID-19. Calculated by growing Feb–May 2020 spend by the same 1-month growth rate observed for Feb–May 2019. Note that not
all panelists have income identified, so the stratified income view does not always match the total view
McKinsey & Company 19
3. In the online channel, consumers have been trading up since
Q4 2020; categories are close to pre-COVID-19 prices
−5 5 10 > 10
−10
< −15
Source: Stackline Amazon spend data, Jan 2019–1st half Jul 2021
Year-over-year growth of Amazon average selling price, by product category, 2019–21, %
Home and furniture
Apparel and accessories
Beauty
Power and hand tools
Electronics
Grocery
Health
Kitchen and dining
Sports and outdoors
Pet supplies
Automotive
Lawn and garden
Home improvement
Office and school supplies
Shoes
Household supplies
Baby and nursery
Toys and non-video games
Jewelry
Industrial hardware
Overall
Pre-COVID-19
Feb 2020
Early shelter
in place
Mar
E-commerce
acceleration,
Apr–May
Early
summer,
Jun–Jul
Fall,
Aug–Oct
Holiday,
Nov–Dec
−3 0 2 −3 7 3
−7 −10 −11 −9 −9 −8
−7 −12 −8 −4 −2 −1
−5 −5 4 1 4 4
2 15 22 20 17 17
−9 −10 −9 −4 −1 1
−8 −10 −4 3 3 1
−5 −6 −1 2 3 7
−5 −8 −13 −11 0 −4
-6 −7 −1 0 2 4
5 1 3 5 4 1
−8 −9 −4 −4 13 6
−8 −11 −7 −6 −2 −1
−5 1 13 8 7 16
11 3 0 −2 6 3
−6 −9 −7 −7 −5 0
−5 −10 −5 −3 2 1
−7 −5 3 1 6 6
8 2 2 8 6 1
−9 −12 −7 −3 −4 −2
−5 −8 −8 −7 −1 3
20211
Jan–Feb
2 −1
−5 −1
2 12
4 7
18 2
5 7
6 14
3 9
1 5
1 1
−4 −4
7 7
0 6
10 7
−8 −10
−2 9
1 8
Mar
7 10
−1 3
−2 4
−1 8
−2
3
7
−1
−3
7
7
3
14
−4
0
0
3
0
−5
8
3
Apr–May
4
7
−1
7
2
−7
2
4
18
−1
10
8
6
−6
3
−4
−3
10
−6
4
−1
Jun–Jul2
7
13
−4
0
Current as of July 2021
Disparate recovery
1. Year-over-year growth in 2021 is calculated by using actual sales numbers in 2020 reflecting impact from COVID-19
2. Includes all of Jun-2021 and half of Jul-2021
McKinsey & Company 20
What US consumers have done since COVID-19 started1 and intent to continue2
% of respondents
4. More than 75 percent of Americans have tried a new shopping
behavior during the pandemic, and the trend continues in 2021
40
39
34
29
26
Private label/store brand
New shopping method4
Different brand
Different retailer/store/website
New digital shopping method
Source: McKinsey & Company COVID-19 US Consumer Pulse Survey, Feb 18–22, 2021, n = 2,076, sampled and weighted to match the US general population 18+ years
Growth, Aug
2020–Feb 20213
44%
of millennials
and Gen Z
have tried a
new brand6
77%
of consumers
have tried a
new shopping
behavior
84%
of millennials and
Gen Z have tried
a new shopping
behavior6
Intent to
continue
1x
1x
1.1x
1.2x
1.2x
76
78
79
81
81
Loyalty shakeup
Have done
35%
of baby boomers
have tried a new
brand6
Current as of February 2021
1. Q: Since the coronavirus (COVID-19) crisis started, which of the following have you done? 23% of consumers selected “none of these”
2. Q: Which best describes whether or not you plan to continue with these shopping changes once the coronavirus (COVID-19) crisis has subsided (i.e., once there is herd immunity)? Possible answers: “will go back to what I did before
coronavirus”; ”will keep doing both this and what I did before coronavirus”; ”will keep doing this and NOT go back to what I did before coronavirus.” Includes respondents who selected “will keep doing both this and what I did before
coronavirus” and “will keep doing this and NOT go back to what I did before coronavirus”
3. Growth is indicated by numbers greater than 1 (e.g., 1x indicates no growth, 1.1x indicates 10% growth)
4. Includes curbside pickup and delivery apps
5. Members of Gen Z were born in 1997–2012, millennials in 1981–96, Gen X in 19–80, and baby boomers in 1946–64. The traditionalist/silent generation is not included due to a low sample size
McKinsey & Company 21
4. Value was the main reason why consumers switched brands, but
they also switched for purpose, quality, and novelty
40%
38%
16%
13%
42%
17%
9%
11%
11%
24%
18%
24%
17%
19%
16%
26%
19%
Products in stock
Supporting local businesses
Better shipping/delivery cost
Better value
Better prices/promotions
More sustainable/better for the environment
Larger package sizes
The company treats its employees well
Shares my values
Better quality
Natural or organic
I wanted to try a new brand I found
I wanted to try a type of product I’ve never tried before
I wanted to treat myself
I wanted variety or change from my normal routine
Available where I’m shopping (i.e., in store or online)
Cleaner or safer
Reason for trying a new brand since COVID-19 began1
% of respondents selecting reason in top 3
Source: McKinsey & Company COVID-19 US Consumer Pulse Survey, Feb 18–22/2021, n = 2,076, sampled and weighted to match the US general population 18+ years
42%
of millennials and Gen Z cite purpose as a
primary reason2
44%
of millennials and Gen Z cite quality/organic
as a primary reason2
Net % of respondents per category
X%
Value 65%
Quality/organic 34%
Availability 42%
Convenience 26%
Purpose-driven 34%
Novelty 33%
Health/hygiene 16%
Personal choice 28%
Loyalty shakeup
Current as of February 2021
1. Q: You mentioned you tried a new/different brand than what you normally buy. What were the main reasons that drove this decision? Select all that apply. “Brand” includes different brand, new private label/store brand
2. Members of Gen Z were born in 1997–2012, millennials in 1981–96
McKinsey & Company 22
Source: McKinsey Global Sentiment Survey, 2020 and 2021
Trade-off behavior in a standard shopping basket, all consumers by income tier1
% of respondents, Sep 2019 and Sep 20202
>$100,000
$50,000–100,000
<$50,000
US income tiers, per household, annual
6
18
4
3
3
17
6
3
3
10
6
10
Total
4
16
5
5
3.65x
4. Trade-down increased across income groups; trade-up increased as
well for consumers with household income over $100,000
2019
2020
Trade-down
Trade-up
Loyalty shakeup
Current as of September 2020
1. Q: Please indicate how your buying behavior has changed in a standard shopping basket for the items shown in the past 12 months (since Sep 2019). Select all that apply, with option 7 being mutually exclusive and option 1 exclusive from
option. Possible answers: “Switching to less expensive brands”; “Switching to more expensive/premium brands”; “Buying the same brand as I bought 12 months ago, but at stores with lower prices”; “Buying only when on sale or with coupon”;
“Buying less frequently or lower quantity of the same brand”; “Have made some other change in how I buy these products”; “Have not made changes in how I buy these products” Trade-down reflects “Switching to less expensive brands”
option as a percentage of all consumers, while trade-up reflects “Switching to more expensive brands” as a percentage of all consumers
2. For 2019, n = 4,507; for 2020, n = 1,030
McKinsey & Company 23
Homebody economy
5. Consumers have made
life changes that
increase stickiness of
the homebody economy 32%
Work / study change
Worked more from home
Changed jobs
Went back to school
28%
Home renovation
26%
Investments /
Divestments
Set up a specific work-from-
home space
Set up a gym at home
Renovated/remodeled home
Bought a car
Reassessed my investment
portfolio
Bought / sold a property
Changes made in the last 12 months as a result of COVID-191
% of respondents2
Current as of February 2021
1 Versus estimate for Mar 2020 spend if COVID-19 pandemic had not occurred. Revised Mar 2020 baseline calculated by
increasing Feb 2020 spend by the same 1-month growth rate observed for Feb–Mar 2019
2 n = 2,076, sampled and weighted to match the US general population 18+ years
Source: McKinsey & Company COVID-19 US Consumer Pulse Survey, Feb 18–22, 2021
McKinsey & Company 24
Allowing work
from home
(WFH) full-time
for selected staff
66
Allowing WFH
part-time for
selected staff
Migration of
training and
related events to
online models only
Reducing time staff
are expected to
travel to sites other
than their primary
place of work
68
62
Subsidies for costs
of setting up robust
WFH capabilities
61
34
72%
of executives
say their
organizations
have started
adopting
permanent
remote-working
models
5. About 70 percent of companies plan to continue with some type
of hybrid remote work even after the pandemic
Homebody economy
McKinsey survey of C-level executives (n = 278)
Top 5 policy modifications
% of respondents
Source: McKinsey Corporate Business Functions Practice, Aug 2020
Current as of August 2020

Contenu connexe

Tendances

McKinsey Survey: US consumer sentiment during the coronavirus crisis
McKinsey Survey: US consumer sentiment during the coronavirus crisisMcKinsey Survey: US consumer sentiment during the coronavirus crisis
McKinsey Survey: US consumer sentiment during the coronavirus crisisMcKinsey on Marketing & Sales
 
McKinsey Survey: Indian consumer sentiment during the coronavirus crisis
McKinsey Survey: Indian consumer sentiment during the coronavirus crisisMcKinsey Survey: Indian consumer sentiment during the coronavirus crisis
McKinsey Survey: Indian consumer sentiment during the coronavirus crisisMcKinsey on Marketing & Sales
 
COVID-19 Hospital insights survey
COVID-19 Hospital insights surveyCOVID-19 Hospital insights survey
COVID-19 Hospital insights surveyKim Simoniello
 
2021 Consumer Health Insights: COVID-19 Survey Highlights - Sept 2021 update
2021 Consumer Health Insights: COVID-19 Survey Highlights - Sept 2021 update2021 Consumer Health Insights: COVID-19 Survey Highlights - Sept 2021 update
2021 Consumer Health Insights: COVID-19 Survey Highlights - Sept 2021 updateMcKinsey on Healthcare
 
McKinsey Survey: US consumer sentiment during the coronavirus crisis
McKinsey Survey: US consumer sentiment during the coronavirus crisisMcKinsey Survey: US consumer sentiment during the coronavirus crisis
McKinsey Survey: US consumer sentiment during the coronavirus crisisMcKinsey on Marketing & Sales
 
McKinsey Survey: German consumer sentiment during the coronavirus crisis
McKinsey Survey: German consumer sentiment during the coronavirus crisisMcKinsey Survey: German consumer sentiment during the coronavirus crisis
McKinsey Survey: German consumer sentiment during the coronavirus crisisMcKinsey on Marketing & Sales
 
McKinsey Survey: Spanish consumer sentiment during the coronavirus crisis
McKinsey Survey: Spanish consumer sentiment during the coronavirus crisisMcKinsey Survey: Spanish consumer sentiment during the coronavirus crisis
McKinsey Survey: Spanish consumer sentiment during the coronavirus crisisMcKinsey on Marketing & Sales
 
2021 COVID-19 Consumer Healthcare Insights
2021 COVID-19 Consumer Healthcare Insights2021 COVID-19 Consumer Healthcare Insights
2021 COVID-19 Consumer Healthcare InsightsKim Simoniello
 
McKinsey Survey: UK consumer sentiment during the coronavirus crisis
McKinsey Survey: UK consumer sentiment during the coronavirus crisisMcKinsey Survey: UK consumer sentiment during the coronavirus crisis
McKinsey Survey: UK consumer sentiment during the coronavirus crisisMcKinsey on Marketing & Sales
 
McKinsey Survey: Qatari consumer sentiment during the coronavirus crisis
McKinsey Survey: Qatari consumer sentiment during the coronavirus crisisMcKinsey Survey: Qatari consumer sentiment during the coronavirus crisis
McKinsey Survey: Qatari consumer sentiment during the coronavirus crisisMcKinsey on Marketing & Sales
 
20200407 asia covid 19 - grocery retail survey - thailand v final-ds v2
20200407 asia covid 19 - grocery retail survey - thailand v final-ds v220200407 asia covid 19 - grocery retail survey - thailand v final-ds v2
20200407 asia covid 19 - grocery retail survey - thailand v final-ds v2DaniellaSeiler
 
McKinsey Survey: Australian consumer sentiment during the coronavirus crisis
McKinsey Survey: Australian consumer sentiment during the coronavirus crisisMcKinsey Survey: Australian consumer sentiment during the coronavirus crisis
McKinsey Survey: Australian consumer sentiment during the coronavirus crisisMcKinsey on Marketing & Sales
 
McKinsey Survey: Turkish consumer sentiment during the coronavirus crisis
McKinsey Survey: Turkish consumer sentiment during the coronavirus crisisMcKinsey Survey: Turkish consumer sentiment during the coronavirus crisis
McKinsey Survey: Turkish consumer sentiment during the coronavirus crisisMcKinsey on Marketing & Sales
 
McKinsey Survey: US consumer sentiment during the coronavirus crisis
McKinsey Survey: US consumer sentiment during the coronavirus crisisMcKinsey Survey: US consumer sentiment during the coronavirus crisis
McKinsey Survey: US consumer sentiment during the coronavirus crisisMcKinsey on Marketing & Sales
 
McKinsey Survey: Filipino consumer sentiment during the coronavirus crisis
McKinsey Survey: Filipino consumer sentiment during the coronavirus crisisMcKinsey Survey: Filipino consumer sentiment during the coronavirus crisis
McKinsey Survey: Filipino consumer sentiment during the coronavirus crisisMcKinsey on Marketing & Sales
 
McKinsey Survey: European consumer sentiment during the coronavirus crisis
McKinsey Survey: European consumer sentiment during the coronavirus crisisMcKinsey Survey: European consumer sentiment during the coronavirus crisis
McKinsey Survey: European consumer sentiment during the coronavirus crisisMcKinsey on Marketing & Sales
 
McKinsey Survey: German consumer sentiment during the coronavirus crisis
McKinsey Survey: German consumer sentiment during the coronavirus crisisMcKinsey Survey: German consumer sentiment during the coronavirus crisis
McKinsey Survey: German consumer sentiment during the coronavirus crisisMcKinsey on Marketing & Sales
 
McKinsey Survey: Asian consumer sentiment during the coronavirus crisis
McKinsey Survey: Asian consumer sentiment during the coronavirus crisisMcKinsey Survey: Asian consumer sentiment during the coronavirus crisis
McKinsey Survey: Asian consumer sentiment during the coronavirus crisisMcKinsey on Marketing & Sales
 
European consumer pulse sentiment and behaviors during the COVID-19 crisis
European consumer pulse sentiment and behaviors during the COVID-19 crisisEuropean consumer pulse sentiment and behaviors during the COVID-19 crisis
European consumer pulse sentiment and behaviors during the COVID-19 crisisMcKinsey on Marketing & Sales
 

Tendances (20)

McKinsey Survey: US consumer sentiment during the coronavirus crisis
McKinsey Survey: US consumer sentiment during the coronavirus crisisMcKinsey Survey: US consumer sentiment during the coronavirus crisis
McKinsey Survey: US consumer sentiment during the coronavirus crisis
 
McKinsey Survey: Indian consumer sentiment during the coronavirus crisis
McKinsey Survey: Indian consumer sentiment during the coronavirus crisisMcKinsey Survey: Indian consumer sentiment during the coronavirus crisis
McKinsey Survey: Indian consumer sentiment during the coronavirus crisis
 
COVID-19 Hospital insights survey
COVID-19 Hospital insights surveyCOVID-19 Hospital insights survey
COVID-19 Hospital insights survey
 
2021 Consumer Health Insights: COVID-19 Survey Highlights - Sept 2021 update
2021 Consumer Health Insights: COVID-19 Survey Highlights - Sept 2021 update2021 Consumer Health Insights: COVID-19 Survey Highlights - Sept 2021 update
2021 Consumer Health Insights: COVID-19 Survey Highlights - Sept 2021 update
 
McKinsey Survey: US consumer sentiment during the coronavirus crisis
McKinsey Survey: US consumer sentiment during the coronavirus crisisMcKinsey Survey: US consumer sentiment during the coronavirus crisis
McKinsey Survey: US consumer sentiment during the coronavirus crisis
 
McKinsey Survey: German consumer sentiment during the coronavirus crisis
McKinsey Survey: German consumer sentiment during the coronavirus crisisMcKinsey Survey: German consumer sentiment during the coronavirus crisis
McKinsey Survey: German consumer sentiment during the coronavirus crisis
 
McKinsey Survey: Spanish consumer sentiment during the coronavirus crisis
McKinsey Survey: Spanish consumer sentiment during the coronavirus crisisMcKinsey Survey: Spanish consumer sentiment during the coronavirus crisis
McKinsey Survey: Spanish consumer sentiment during the coronavirus crisis
 
2021 COVID-19 Consumer Healthcare Insights
2021 COVID-19 Consumer Healthcare Insights2021 COVID-19 Consumer Healthcare Insights
2021 COVID-19 Consumer Healthcare Insights
 
McKinsey Survey: UK consumer sentiment during the coronavirus crisis
McKinsey Survey: UK consumer sentiment during the coronavirus crisisMcKinsey Survey: UK consumer sentiment during the coronavirus crisis
McKinsey Survey: UK consumer sentiment during the coronavirus crisis
 
McKinsey Survey: Qatari consumer sentiment during the coronavirus crisis
McKinsey Survey: Qatari consumer sentiment during the coronavirus crisisMcKinsey Survey: Qatari consumer sentiment during the coronavirus crisis
McKinsey Survey: Qatari consumer sentiment during the coronavirus crisis
 
20200407 asia covid 19 - grocery retail survey - thailand v final-ds v2
20200407 asia covid 19 - grocery retail survey - thailand v final-ds v220200407 asia covid 19 - grocery retail survey - thailand v final-ds v2
20200407 asia covid 19 - grocery retail survey - thailand v final-ds v2
 
McKinsey Survey: Australian consumer sentiment during the coronavirus crisis
McKinsey Survey: Australian consumer sentiment during the coronavirus crisisMcKinsey Survey: Australian consumer sentiment during the coronavirus crisis
McKinsey Survey: Australian consumer sentiment during the coronavirus crisis
 
McKinsey Survey: Turkish consumer sentiment during the coronavirus crisis
McKinsey Survey: Turkish consumer sentiment during the coronavirus crisisMcKinsey Survey: Turkish consumer sentiment during the coronavirus crisis
McKinsey Survey: Turkish consumer sentiment during the coronavirus crisis
 
McKinsey Survey: US consumer sentiment during the coronavirus crisis
McKinsey Survey: US consumer sentiment during the coronavirus crisisMcKinsey Survey: US consumer sentiment during the coronavirus crisis
McKinsey Survey: US consumer sentiment during the coronavirus crisis
 
McKinsey Survey: Filipino consumer sentiment during the coronavirus crisis
McKinsey Survey: Filipino consumer sentiment during the coronavirus crisisMcKinsey Survey: Filipino consumer sentiment during the coronavirus crisis
McKinsey Survey: Filipino consumer sentiment during the coronavirus crisis
 
1 B Catherine Eddy
1 B Catherine Eddy1 B Catherine Eddy
1 B Catherine Eddy
 
McKinsey Survey: European consumer sentiment during the coronavirus crisis
McKinsey Survey: European consumer sentiment during the coronavirus crisisMcKinsey Survey: European consumer sentiment during the coronavirus crisis
McKinsey Survey: European consumer sentiment during the coronavirus crisis
 
McKinsey Survey: German consumer sentiment during the coronavirus crisis
McKinsey Survey: German consumer sentiment during the coronavirus crisisMcKinsey Survey: German consumer sentiment during the coronavirus crisis
McKinsey Survey: German consumer sentiment during the coronavirus crisis
 
McKinsey Survey: Asian consumer sentiment during the coronavirus crisis
McKinsey Survey: Asian consumer sentiment during the coronavirus crisisMcKinsey Survey: Asian consumer sentiment during the coronavirus crisis
McKinsey Survey: Asian consumer sentiment during the coronavirus crisis
 
European consumer pulse sentiment and behaviors during the COVID-19 crisis
European consumer pulse sentiment and behaviors during the COVID-19 crisisEuropean consumer pulse sentiment and behaviors during the COVID-19 crisis
European consumer pulse sentiment and behaviors during the COVID-19 crisis
 

Similaire à McKinsey Survey: US consumer sentiment during the coronavirus crisis

McKinsey Survey: US consumer sentiment during the coronavirus crisis
McKinsey Survey: US consumer sentiment during the coronavirus crisisMcKinsey Survey: US consumer sentiment during the coronavirus crisis
McKinsey Survey: US consumer sentiment during the coronavirus crisisMcKinsey on Marketing & Sales
 
McKinsey: Survey: Indonesian consumer sentiment during the coronavirus crisis
McKinsey: Survey: Indonesian consumer sentiment during the coronavirus crisisMcKinsey: Survey: Indonesian consumer sentiment during the coronavirus crisis
McKinsey: Survey: Indonesian consumer sentiment during the coronavirus crisisMcKinsey on Marketing & Sales
 
McKinsey Survey: Mexican consumer sentiment during the coronavirus crisis
McKinsey Survey: Mexican consumer sentiment during the coronavirus crisisMcKinsey Survey: Mexican consumer sentiment during the coronavirus crisis
McKinsey Survey: Mexican consumer sentiment during the coronavirus crisisMcKinsey on Marketing & Sales
 
McKinsey: Survey: Indonesian consumer sentiment during the coronavirus crisis
McKinsey: Survey: Indonesian consumer sentiment during the coronavirus crisisMcKinsey: Survey: Indonesian consumer sentiment during the coronavirus crisis
McKinsey: Survey: Indonesian consumer sentiment during the coronavirus crisisMcKinsey on Marketing & Sales
 
McKinsey Survey: Korean consumer sentiment during the coronavirus crisis
McKinsey Survey: Korean consumer sentiment during the coronavirus crisisMcKinsey Survey: Korean consumer sentiment during the coronavirus crisis
McKinsey Survey: Korean consumer sentiment during the coronavirus crisisMcKinsey on Marketing & Sales
 
McKinsey Survey: Japanese consumer sentiment during the coronavirus crisis
McKinsey Survey: Japanese consumer sentiment during the coronavirus crisisMcKinsey Survey: Japanese consumer sentiment during the coronavirus crisis
McKinsey Survey: Japanese consumer sentiment during the coronavirus crisisMcKinsey on Marketing & Sales
 
McKinsey Survey: Indian consumer sentiment during the coronavirus crisis
McKinsey Survey: Indian consumer sentiment during the coronavirus crisisMcKinsey Survey: Indian consumer sentiment during the coronavirus crisis
McKinsey Survey: Indian consumer sentiment during the coronavirus crisisMcKinsey on Marketing & Sales
 
McKinsey Survey: Japanese consumer sentiment during the coronavirus crisis
McKinsey Survey: Japanese consumer sentiment during the coronavirus crisisMcKinsey Survey: Japanese consumer sentiment during the coronavirus crisis
McKinsey Survey: Japanese consumer sentiment during the coronavirus crisisMcKinsey on Marketing & Sales
 
McKinsey Survey: Italian consumer sentiment during the coronavirus crisis
McKinsey Survey: Italian consumer sentiment during the coronavirus crisisMcKinsey Survey: Italian consumer sentiment during the coronavirus crisis
McKinsey Survey: Italian consumer sentiment during the coronavirus crisisMcKinsey on Marketing & Sales
 
McKinsey Survey: European consumer sentiment during the coronavirus crisis
McKinsey Survey: European consumer sentiment during the coronavirus crisisMcKinsey Survey: European consumer sentiment during the coronavirus crisis
McKinsey Survey: European consumer sentiment during the coronavirus crisisMcKinsey on Marketing & Sales
 

Similaire à McKinsey Survey: US consumer sentiment during the coronavirus crisis (20)

McKinsey Survey: US consumer sentiment during the coronavirus crisis
McKinsey Survey: US consumer sentiment during the coronavirus crisisMcKinsey Survey: US consumer sentiment during the coronavirus crisis
McKinsey Survey: US consumer sentiment during the coronavirus crisis
 
McKinsey Survey: US consumer sentiment during the coronavirus crisis
McKinsey Survey: US consumer sentiment during the coronavirus crisisMcKinsey Survey: US consumer sentiment during the coronavirus crisis
McKinsey Survey: US consumer sentiment during the coronavirus crisis
 
McKinsey: Survey: Indonesian consumer sentiment during the coronavirus crisis
McKinsey: Survey: Indonesian consumer sentiment during the coronavirus crisisMcKinsey: Survey: Indonesian consumer sentiment during the coronavirus crisis
McKinsey: Survey: Indonesian consumer sentiment during the coronavirus crisis
 
McKinsey Survey: Mexican consumer sentiment during the coronavirus crisis
McKinsey Survey: Mexican consumer sentiment during the coronavirus crisisMcKinsey Survey: Mexican consumer sentiment during the coronavirus crisis
McKinsey Survey: Mexican consumer sentiment during the coronavirus crisis
 
McKinsey Survey: Mexican consumer sentiment during the coronavirus crisis
McKinsey Survey: Mexican consumer sentiment during the coronavirus crisisMcKinsey Survey: Mexican consumer sentiment during the coronavirus crisis
McKinsey Survey: Mexican consumer sentiment during the coronavirus crisis
 
McKinsey Survey: Mexican consumer sentiment during the coronavirus crisis
McKinsey Survey: Mexican consumer sentiment during the coronavirus crisisMcKinsey Survey: Mexican consumer sentiment during the coronavirus crisis
McKinsey Survey: Mexican consumer sentiment during the coronavirus crisis
 
McKinsey: Survey: Indonesian consumer sentiment during the coronavirus crisis
McKinsey: Survey: Indonesian consumer sentiment during the coronavirus crisisMcKinsey: Survey: Indonesian consumer sentiment during the coronavirus crisis
McKinsey: Survey: Indonesian consumer sentiment during the coronavirus crisis
 
McKinsey: Survey: Indonesian consumer sentiment during the coronavirus crisis
McKinsey: Survey: Indonesian consumer sentiment during the coronavirus crisisMcKinsey: Survey: Indonesian consumer sentiment during the coronavirus crisis
McKinsey: Survey: Indonesian consumer sentiment during the coronavirus crisis
 
McKinsey Survey: Korean consumer sentiment during the coronavirus crisis
McKinsey Survey: Korean consumer sentiment during the coronavirus crisisMcKinsey Survey: Korean consumer sentiment during the coronavirus crisis
McKinsey Survey: Korean consumer sentiment during the coronavirus crisis
 
McKinsey Survey: Korean consumer sentiment during the coronavirus crisis
McKinsey Survey: Korean consumer sentiment during the coronavirus crisisMcKinsey Survey: Korean consumer sentiment during the coronavirus crisis
McKinsey Survey: Korean consumer sentiment during the coronavirus crisis
 
McKinsey Survey: Japanese consumer sentiment during the coronavirus crisis
McKinsey Survey: Japanese consumer sentiment during the coronavirus crisisMcKinsey Survey: Japanese consumer sentiment during the coronavirus crisis
McKinsey Survey: Japanese consumer sentiment during the coronavirus crisis
 
McKinsey Survey: Japanese consumer sentiment during the coronavirus crisis
McKinsey Survey: Japanese consumer sentiment during the coronavirus crisisMcKinsey Survey: Japanese consumer sentiment during the coronavirus crisis
McKinsey Survey: Japanese consumer sentiment during the coronavirus crisis
 
McKinsey Survey: Indian consumer sentiment during the coronavirus crisis
McKinsey Survey: Indian consumer sentiment during the coronavirus crisisMcKinsey Survey: Indian consumer sentiment during the coronavirus crisis
McKinsey Survey: Indian consumer sentiment during the coronavirus crisis
 
McKinsey Survey: Indian consumer sentiment during the coronavirus crisis
McKinsey Survey: Indian consumer sentiment during the coronavirus crisisMcKinsey Survey: Indian consumer sentiment during the coronavirus crisis
McKinsey Survey: Indian consumer sentiment during the coronavirus crisis
 
McKinsey Survey: Indian consumer sentiment during the coronavirus crisis
McKinsey Survey: Indian consumer sentiment during the coronavirus crisisMcKinsey Survey: Indian consumer sentiment during the coronavirus crisis
McKinsey Survey: Indian consumer sentiment during the coronavirus crisis
 
McKinsey Survey: Japanese consumer sentiment during the coronavirus crisis
McKinsey Survey: Japanese consumer sentiment during the coronavirus crisisMcKinsey Survey: Japanese consumer sentiment during the coronavirus crisis
McKinsey Survey: Japanese consumer sentiment during the coronavirus crisis
 
McKinsey Survey: Italian consumer sentiment during the coronavirus crisis
McKinsey Survey: Italian consumer sentiment during the coronavirus crisisMcKinsey Survey: Italian consumer sentiment during the coronavirus crisis
McKinsey Survey: Italian consumer sentiment during the coronavirus crisis
 
McKinsey Survey: European consumer sentiment during the coronavirus crisis
McKinsey Survey: European consumer sentiment during the coronavirus crisisMcKinsey Survey: European consumer sentiment during the coronavirus crisis
McKinsey Survey: European consumer sentiment during the coronavirus crisis
 
McKinsey Survey: Italian consumer sentiment during the coronavirus crisis
McKinsey Survey: Italian consumer sentiment during the coronavirus crisisMcKinsey Survey: Italian consumer sentiment during the coronavirus crisis
McKinsey Survey: Italian consumer sentiment during the coronavirus crisis
 
McKinsey Survey: European consumer sentiment during the coronavirus crisis
McKinsey Survey: European consumer sentiment during the coronavirus crisisMcKinsey Survey: European consumer sentiment during the coronavirus crisis
McKinsey Survey: European consumer sentiment during the coronavirus crisis
 

Plus de McKinsey on Marketing & Sales

McKinsey European consumer sentiment survey: How current events are shaping S...
McKinsey European consumer sentiment survey: How current events are shaping S...McKinsey European consumer sentiment survey: How current events are shaping S...
McKinsey European consumer sentiment survey: How current events are shaping S...McKinsey on Marketing & Sales
 
McKinsey European consumer sentiment survey: How current events are shaping U...
McKinsey European consumer sentiment survey: How current events are shaping U...McKinsey European consumer sentiment survey: How current events are shaping U...
McKinsey European consumer sentiment survey: How current events are shaping U...McKinsey on Marketing & Sales
 
McKinsey European consumer sentiment survey: How current events are shaping I...
McKinsey European consumer sentiment survey: How current events are shaping I...McKinsey European consumer sentiment survey: How current events are shaping I...
McKinsey European consumer sentiment survey: How current events are shaping I...McKinsey on Marketing & Sales
 
McKinsey European consumer sentiment survey: How current events are shaping G...
McKinsey European consumer sentiment survey: How current events are shaping G...McKinsey European consumer sentiment survey: How current events are shaping G...
McKinsey European consumer sentiment survey: How current events are shaping G...McKinsey on Marketing & Sales
 
McKinsey European consumer sentiment survey: How current events are shaping F...
McKinsey European consumer sentiment survey: How current events are shaping F...McKinsey European consumer sentiment survey: How current events are shaping F...
McKinsey European consumer sentiment survey: How current events are shaping F...McKinsey on Marketing & Sales
 
McKinsey Survey: Australian consumer sentiment during the coronavirus crisis
McKinsey Survey: Australian consumer sentiment during the coronavirus crisisMcKinsey Survey: Australian consumer sentiment during the coronavirus crisis
McKinsey Survey: Australian consumer sentiment during the coronavirus crisisMcKinsey on Marketing & Sales
 
McKinsey European consumer sentiment survey: How current events are shaping F...
McKinsey European consumer sentiment survey: How current events are shaping F...McKinsey European consumer sentiment survey: How current events are shaping F...
McKinsey European consumer sentiment survey: How current events are shaping F...McKinsey on Marketing & Sales
 
McKinsey European consumer sentiment survey: How current events are shaping U...
McKinsey European consumer sentiment survey: How current events are shaping U...McKinsey European consumer sentiment survey: How current events are shaping U...
McKinsey European consumer sentiment survey: How current events are shaping U...McKinsey on Marketing & Sales
 
McKinsey European consumer sentiment survey: How current events are shaping G...
McKinsey European consumer sentiment survey: How current events are shaping G...McKinsey European consumer sentiment survey: How current events are shaping G...
McKinsey European consumer sentiment survey: How current events are shaping G...McKinsey on Marketing & Sales
 
McKinsey European consumer sentiment survey: How current events in Europe are...
McKinsey European consumer sentiment survey: How current events in Europe are...McKinsey European consumer sentiment survey: How current events in Europe are...
McKinsey European consumer sentiment survey: How current events in Europe are...McKinsey on Marketing & Sales
 
McKinsey European consumer sentiment survey: How current events are shaping S...
McKinsey European consumer sentiment survey: How current events are shaping S...McKinsey European consumer sentiment survey: How current events are shaping S...
McKinsey European consumer sentiment survey: How current events are shaping S...McKinsey on Marketing & Sales
 
McKinsey European consumer sentiment survey: How current events are shaping I...
McKinsey European consumer sentiment survey: How current events are shaping I...McKinsey European consumer sentiment survey: How current events are shaping I...
McKinsey European consumer sentiment survey: How current events are shaping I...McKinsey on Marketing & Sales
 
McKinsey survey: European consumer sentiment survey: How current events are s...
McKinsey survey: European consumer sentiment survey: How current events are s...McKinsey survey: European consumer sentiment survey: How current events are s...
McKinsey survey: European consumer sentiment survey: How current events are s...McKinsey on Marketing & Sales
 
McKinsey Survey: European consumer sentiment during the coronavirus crisis
McKinsey Survey: European consumer sentiment during the coronavirus crisisMcKinsey Survey: European consumer sentiment during the coronavirus crisis
McKinsey Survey: European consumer sentiment during the coronavirus crisisMcKinsey on Marketing & Sales
 
McKinsey Survey: Australian consumer sentiment during the coronavirus crisis
McKinsey Survey: Australian consumer sentiment during the coronavirus crisisMcKinsey Survey: Australian consumer sentiment during the coronavirus crisis
McKinsey Survey: Australian consumer sentiment during the coronavirus crisisMcKinsey on Marketing & Sales
 
McKinsey Survey: Chinese consumer sentiment during the coronavirus crisis
McKinsey Survey: Chinese consumer sentiment during the coronavirus crisisMcKinsey Survey: Chinese consumer sentiment during the coronavirus crisis
McKinsey Survey: Chinese consumer sentiment during the coronavirus crisisMcKinsey on Marketing & Sales
 

Plus de McKinsey on Marketing & Sales (20)

McKinsey European consumer sentiment survey: How current events are shaping S...
McKinsey European consumer sentiment survey: How current events are shaping S...McKinsey European consumer sentiment survey: How current events are shaping S...
McKinsey European consumer sentiment survey: How current events are shaping S...
 
McKinsey European consumer sentiment survey: How current events are shaping U...
McKinsey European consumer sentiment survey: How current events are shaping U...McKinsey European consumer sentiment survey: How current events are shaping U...
McKinsey European consumer sentiment survey: How current events are shaping U...
 
McKinsey European consumer sentiment survey: How current events are shaping I...
McKinsey European consumer sentiment survey: How current events are shaping I...McKinsey European consumer sentiment survey: How current events are shaping I...
McKinsey European consumer sentiment survey: How current events are shaping I...
 
McKinsey European consumer sentiment survey: How current events are shaping G...
McKinsey European consumer sentiment survey: How current events are shaping G...McKinsey European consumer sentiment survey: How current events are shaping G...
McKinsey European consumer sentiment survey: How current events are shaping G...
 
McKinsey European consumer sentiment survey: How current events are shaping F...
McKinsey European consumer sentiment survey: How current events are shaping F...McKinsey European consumer sentiment survey: How current events are shaping F...
McKinsey European consumer sentiment survey: How current events are shaping F...
 
McKinsey Survey: Australian consumer sentiment during the coronavirus crisis
McKinsey Survey: Australian consumer sentiment during the coronavirus crisisMcKinsey Survey: Australian consumer sentiment during the coronavirus crisis
McKinsey Survey: Australian consumer sentiment during the coronavirus crisis
 
McKinsey European consumer sentiment survey: How current events are shaping F...
McKinsey European consumer sentiment survey: How current events are shaping F...McKinsey European consumer sentiment survey: How current events are shaping F...
McKinsey European consumer sentiment survey: How current events are shaping F...
 
McKinsey European consumer sentiment survey: How current events are shaping U...
McKinsey European consumer sentiment survey: How current events are shaping U...McKinsey European consumer sentiment survey: How current events are shaping U...
McKinsey European consumer sentiment survey: How current events are shaping U...
 
McKinsey European consumer sentiment survey: How current events are shaping G...
McKinsey European consumer sentiment survey: How current events are shaping G...McKinsey European consumer sentiment survey: How current events are shaping G...
McKinsey European consumer sentiment survey: How current events are shaping G...
 
McKinsey European consumer sentiment survey: How current events in Europe are...
McKinsey European consumer sentiment survey: How current events in Europe are...McKinsey European consumer sentiment survey: How current events in Europe are...
McKinsey European consumer sentiment survey: How current events in Europe are...
 
McKinsey European consumer sentiment survey: How current events are shaping S...
McKinsey European consumer sentiment survey: How current events are shaping S...McKinsey European consumer sentiment survey: How current events are shaping S...
McKinsey European consumer sentiment survey: How current events are shaping S...
 
McKinsey European consumer sentiment survey: How current events are shaping I...
McKinsey European consumer sentiment survey: How current events are shaping I...McKinsey European consumer sentiment survey: How current events are shaping I...
McKinsey European consumer sentiment survey: How current events are shaping I...
 
McKinsey survey: European consumer sentiment survey: How current events are s...
McKinsey survey: European consumer sentiment survey: How current events are s...McKinsey survey: European consumer sentiment survey: How current events are s...
McKinsey survey: European consumer sentiment survey: How current events are s...
 
McKinsey survey: European consumer sentiment survey: How current events are s...
McKinsey survey: European consumer sentiment survey: How current events are s...McKinsey survey: European consumer sentiment survey: How current events are s...
McKinsey survey: European consumer sentiment survey: How current events are s...
 
McKinsey Survey: European consumer sentiment during the coronavirus crisis
McKinsey Survey: European consumer sentiment during the coronavirus crisisMcKinsey Survey: European consumer sentiment during the coronavirus crisis
McKinsey Survey: European consumer sentiment during the coronavirus crisis
 
McKinsey Survey: Australian consumer sentiment during the coronavirus crisis
McKinsey Survey: Australian consumer sentiment during the coronavirus crisisMcKinsey Survey: Australian consumer sentiment during the coronavirus crisis
McKinsey Survey: Australian consumer sentiment during the coronavirus crisis
 
McKinsey Survey: Chinese consumer sentiment during the coronavirus crisis
McKinsey Survey: Chinese consumer sentiment during the coronavirus crisisMcKinsey Survey: Chinese consumer sentiment during the coronavirus crisis
McKinsey Survey: Chinese consumer sentiment during the coronavirus crisis
 

Dernier

Call Girls Miyapur 7001305949 all area service COD available Any Time
Call Girls Miyapur 7001305949 all area service COD available Any TimeCall Girls Miyapur 7001305949 all area service COD available Any Time
Call Girls Miyapur 7001305949 all area service COD available Any Timedelhimodelshub1
 
2024 Numerator Consumer Study of Cannabis Usage
2024 Numerator Consumer Study of Cannabis Usage2024 Numerator Consumer Study of Cannabis Usage
2024 Numerator Consumer Study of Cannabis UsageNeil Kimberley
 
BEST Call Girls In Greater Noida ✨ 9773824855 ✨ Escorts Service In Delhi Ncr,
BEST Call Girls In Greater Noida ✨ 9773824855 ✨ Escorts Service In Delhi Ncr,BEST Call Girls In Greater Noida ✨ 9773824855 ✨ Escorts Service In Delhi Ncr,
BEST Call Girls In Greater Noida ✨ 9773824855 ✨ Escorts Service In Delhi Ncr,noida100girls
 
Future Of Sample Report 2024 | Redacted Version
Future Of Sample Report 2024 | Redacted VersionFuture Of Sample Report 2024 | Redacted Version
Future Of Sample Report 2024 | Redacted VersionMintel Group
 
8447779800, Low rate Call girls in Uttam Nagar Delhi NCR
8447779800, Low rate Call girls in Uttam Nagar Delhi NCR8447779800, Low rate Call girls in Uttam Nagar Delhi NCR
8447779800, Low rate Call girls in Uttam Nagar Delhi NCRashishs7044
 
Digital Transformation in the PLM domain - distrib.pdf
Digital Transformation in the PLM domain - distrib.pdfDigital Transformation in the PLM domain - distrib.pdf
Digital Transformation in the PLM domain - distrib.pdfJos Voskuil
 
Call Girls In Connaught Place Delhi ❤️88604**77959_Russian 100% Genuine Escor...
Call Girls In Connaught Place Delhi ❤️88604**77959_Russian 100% Genuine Escor...Call Girls In Connaught Place Delhi ❤️88604**77959_Russian 100% Genuine Escor...
Call Girls In Connaught Place Delhi ❤️88604**77959_Russian 100% Genuine Escor...lizamodels9
 
8447779800, Low rate Call girls in New Ashok Nagar Delhi NCR
8447779800, Low rate Call girls in New Ashok Nagar Delhi NCR8447779800, Low rate Call girls in New Ashok Nagar Delhi NCR
8447779800, Low rate Call girls in New Ashok Nagar Delhi NCRashishs7044
 
Call US-88OO1O2216 Call Girls In Mahipalpur Female Escort Service
Call US-88OO1O2216 Call Girls In Mahipalpur Female Escort ServiceCall US-88OO1O2216 Call Girls In Mahipalpur Female Escort Service
Call US-88OO1O2216 Call Girls In Mahipalpur Female Escort Servicecallgirls2057
 
International Business Environments and Operations 16th Global Edition test b...
International Business Environments and Operations 16th Global Edition test b...International Business Environments and Operations 16th Global Edition test b...
International Business Environments and Operations 16th Global Edition test b...ssuserf63bd7
 
Annual General Meeting Presentation Slides
Annual General Meeting Presentation SlidesAnnual General Meeting Presentation Slides
Annual General Meeting Presentation SlidesKeppelCorporation
 
Global Scenario On Sustainable and Resilient Coconut Industry by Dr. Jelfina...
Global Scenario On Sustainable  and Resilient Coconut Industry by Dr. Jelfina...Global Scenario On Sustainable  and Resilient Coconut Industry by Dr. Jelfina...
Global Scenario On Sustainable and Resilient Coconut Industry by Dr. Jelfina...ictsugar
 
Organizational Structure Running A Successful Business
Organizational Structure Running A Successful BusinessOrganizational Structure Running A Successful Business
Organizational Structure Running A Successful BusinessSeta Wicaksana
 
Contemporary Economic Issues Facing the Filipino Entrepreneur (1).pptx
Contemporary Economic Issues Facing the Filipino Entrepreneur (1).pptxContemporary Economic Issues Facing the Filipino Entrepreneur (1).pptx
Contemporary Economic Issues Facing the Filipino Entrepreneur (1).pptxMarkAnthonyAurellano
 
8447779800, Low rate Call girls in Tughlakabad Delhi NCR
8447779800, Low rate Call girls in Tughlakabad Delhi NCR8447779800, Low rate Call girls in Tughlakabad Delhi NCR
8447779800, Low rate Call girls in Tughlakabad Delhi NCRashishs7044
 
8447779800, Low rate Call girls in Kotla Mubarakpur Delhi NCR
8447779800, Low rate Call girls in Kotla Mubarakpur Delhi NCR8447779800, Low rate Call girls in Kotla Mubarakpur Delhi NCR
8447779800, Low rate Call girls in Kotla Mubarakpur Delhi NCRashishs7044
 
NewBase 19 April 2024 Energy News issue - 1717 by Khaled Al Awadi.pdf
NewBase  19 April  2024  Energy News issue - 1717 by Khaled Al Awadi.pdfNewBase  19 April  2024  Energy News issue - 1717 by Khaled Al Awadi.pdf
NewBase 19 April 2024 Energy News issue - 1717 by Khaled Al Awadi.pdfKhaled Al Awadi
 
Islamabad Escorts | Call 03070433345 | Escort Service in Islamabad
Islamabad Escorts | Call 03070433345 | Escort Service in IslamabadIslamabad Escorts | Call 03070433345 | Escort Service in Islamabad
Islamabad Escorts | Call 03070433345 | Escort Service in IslamabadAyesha Khan
 
(Best) ENJOY Call Girls in Faridabad Ex | 8377087607
(Best) ENJOY Call Girls in Faridabad Ex | 8377087607(Best) ENJOY Call Girls in Faridabad Ex | 8377087607
(Best) ENJOY Call Girls in Faridabad Ex | 8377087607dollysharma2066
 
FULL ENJOY Call girls in Paharganj Delhi | 8377087607
FULL ENJOY Call girls in Paharganj Delhi | 8377087607FULL ENJOY Call girls in Paharganj Delhi | 8377087607
FULL ENJOY Call girls in Paharganj Delhi | 8377087607dollysharma2066
 

Dernier (20)

Call Girls Miyapur 7001305949 all area service COD available Any Time
Call Girls Miyapur 7001305949 all area service COD available Any TimeCall Girls Miyapur 7001305949 all area service COD available Any Time
Call Girls Miyapur 7001305949 all area service COD available Any Time
 
2024 Numerator Consumer Study of Cannabis Usage
2024 Numerator Consumer Study of Cannabis Usage2024 Numerator Consumer Study of Cannabis Usage
2024 Numerator Consumer Study of Cannabis Usage
 
BEST Call Girls In Greater Noida ✨ 9773824855 ✨ Escorts Service In Delhi Ncr,
BEST Call Girls In Greater Noida ✨ 9773824855 ✨ Escorts Service In Delhi Ncr,BEST Call Girls In Greater Noida ✨ 9773824855 ✨ Escorts Service In Delhi Ncr,
BEST Call Girls In Greater Noida ✨ 9773824855 ✨ Escorts Service In Delhi Ncr,
 
Future Of Sample Report 2024 | Redacted Version
Future Of Sample Report 2024 | Redacted VersionFuture Of Sample Report 2024 | Redacted Version
Future Of Sample Report 2024 | Redacted Version
 
8447779800, Low rate Call girls in Uttam Nagar Delhi NCR
8447779800, Low rate Call girls in Uttam Nagar Delhi NCR8447779800, Low rate Call girls in Uttam Nagar Delhi NCR
8447779800, Low rate Call girls in Uttam Nagar Delhi NCR
 
Digital Transformation in the PLM domain - distrib.pdf
Digital Transformation in the PLM domain - distrib.pdfDigital Transformation in the PLM domain - distrib.pdf
Digital Transformation in the PLM domain - distrib.pdf
 
Call Girls In Connaught Place Delhi ❤️88604**77959_Russian 100% Genuine Escor...
Call Girls In Connaught Place Delhi ❤️88604**77959_Russian 100% Genuine Escor...Call Girls In Connaught Place Delhi ❤️88604**77959_Russian 100% Genuine Escor...
Call Girls In Connaught Place Delhi ❤️88604**77959_Russian 100% Genuine Escor...
 
8447779800, Low rate Call girls in New Ashok Nagar Delhi NCR
8447779800, Low rate Call girls in New Ashok Nagar Delhi NCR8447779800, Low rate Call girls in New Ashok Nagar Delhi NCR
8447779800, Low rate Call girls in New Ashok Nagar Delhi NCR
 
Call US-88OO1O2216 Call Girls In Mahipalpur Female Escort Service
Call US-88OO1O2216 Call Girls In Mahipalpur Female Escort ServiceCall US-88OO1O2216 Call Girls In Mahipalpur Female Escort Service
Call US-88OO1O2216 Call Girls In Mahipalpur Female Escort Service
 
International Business Environments and Operations 16th Global Edition test b...
International Business Environments and Operations 16th Global Edition test b...International Business Environments and Operations 16th Global Edition test b...
International Business Environments and Operations 16th Global Edition test b...
 
Annual General Meeting Presentation Slides
Annual General Meeting Presentation SlidesAnnual General Meeting Presentation Slides
Annual General Meeting Presentation Slides
 
Global Scenario On Sustainable and Resilient Coconut Industry by Dr. Jelfina...
Global Scenario On Sustainable  and Resilient Coconut Industry by Dr. Jelfina...Global Scenario On Sustainable  and Resilient Coconut Industry by Dr. Jelfina...
Global Scenario On Sustainable and Resilient Coconut Industry by Dr. Jelfina...
 
Organizational Structure Running A Successful Business
Organizational Structure Running A Successful BusinessOrganizational Structure Running A Successful Business
Organizational Structure Running A Successful Business
 
Contemporary Economic Issues Facing the Filipino Entrepreneur (1).pptx
Contemporary Economic Issues Facing the Filipino Entrepreneur (1).pptxContemporary Economic Issues Facing the Filipino Entrepreneur (1).pptx
Contemporary Economic Issues Facing the Filipino Entrepreneur (1).pptx
 
8447779800, Low rate Call girls in Tughlakabad Delhi NCR
8447779800, Low rate Call girls in Tughlakabad Delhi NCR8447779800, Low rate Call girls in Tughlakabad Delhi NCR
8447779800, Low rate Call girls in Tughlakabad Delhi NCR
 
8447779800, Low rate Call girls in Kotla Mubarakpur Delhi NCR
8447779800, Low rate Call girls in Kotla Mubarakpur Delhi NCR8447779800, Low rate Call girls in Kotla Mubarakpur Delhi NCR
8447779800, Low rate Call girls in Kotla Mubarakpur Delhi NCR
 
NewBase 19 April 2024 Energy News issue - 1717 by Khaled Al Awadi.pdf
NewBase  19 April  2024  Energy News issue - 1717 by Khaled Al Awadi.pdfNewBase  19 April  2024  Energy News issue - 1717 by Khaled Al Awadi.pdf
NewBase 19 April 2024 Energy News issue - 1717 by Khaled Al Awadi.pdf
 
Islamabad Escorts | Call 03070433345 | Escort Service in Islamabad
Islamabad Escorts | Call 03070433345 | Escort Service in IslamabadIslamabad Escorts | Call 03070433345 | Escort Service in Islamabad
Islamabad Escorts | Call 03070433345 | Escort Service in Islamabad
 
(Best) ENJOY Call Girls in Faridabad Ex | 8377087607
(Best) ENJOY Call Girls in Faridabad Ex | 8377087607(Best) ENJOY Call Girls in Faridabad Ex | 8377087607
(Best) ENJOY Call Girls in Faridabad Ex | 8377087607
 
FULL ENJOY Call girls in Paharganj Delhi | 8377087607
FULL ENJOY Call girls in Paharganj Delhi | 8377087607FULL ENJOY Call girls in Paharganj Delhi | 8377087607
FULL ENJOY Call girls in Paharganj Delhi | 8377087607
 

McKinsey Survey: US consumer sentiment during the coronavirus crisis

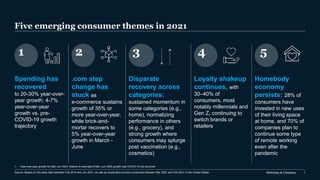
  • 1. McKinsey & Company 1 Five emerging consumer themes in 2021 1 4 3 2 Spending has recovered to 20-30% year-over- year growth; 4-7% year-over-year growth vs. pre- COVID-19 growth trajectory Loyalty shakeup continues, with 30–40% of consumers, most notably millennials and Gen Z, continuing to switch brands or retailers Disparate recovery across categories: sustained momentum in some categories (e.g., home), normalizing performance in others (e.g., grocery), and strong growth where consumers may splurge post vaccination (e.g., cosmetics) .com step change has stuck as e-commerce sustains growth of 35% or more year-over-year, while brick-and- mortar recovers to 5% year-over-year growth in March - June Homebody economy persists: 28% of consumers have invested in new uses of their living space at home, and 70% of companies plan to continue some type of remote working even after the pandemic 5 Source: Based on 3rd-party data between Feb 2019 and Jun 2021, as well as longitudinal surveys conducted between Mar 2020 and Feb 2021 in the United States 1. Year-over-year growth for Mar–Jun 2021 relative to estimate of Mar–Jun 2020 growth had COVID-19 not occurred
  • 2. McKinsey & Company 2 1. US consumer spending maintained strong growth in March to June 2021, following signs of recovery in late 2020 Signs of spend recovery Source: Affinity Solutions credit-card spend data for Feb 2019–Jun 2021; “Impact of stimulus payments on consumer spending,” Earnest Research, Feb 2021 Year-over-year growth in credit-card spend,1 % 10% -6% -18% -9% -6% -5% -3% 1% 2% 1% -2% 3% -4% 20% 40% 27% 25% Nov Feb Mar Jun Apr May Aug Jul Sep Oct Dec Jan Feb Mar Apr May Jun 1st round of stimulus 2nd round of stimulus Holiday pull- forward spend Mar–Aug 6-month YoY change: –8 Sep–Feb 6-month YoY change: 0 Comparison with pre-COVID-19 months2 vs. re- forecasted Jun 2020 spend if COVID-19 had not occurred3 vs. Jun 2020 actual spend Comparison with COVID-19-affected months Stimulus payments and holiday-influenced recovery in the 6 months prior Spend is normalizing, with solid growth for Mar-Jun vs. re-forecasted Mar-Jun 2020 spend had COVID-19 not occured3 Those who received stimulus money in Apr-May and Jan showed a 15-20% uplift in spend.4 Early holiday shopping in Oct and Nov helped support growth in those months Relative to Mar-Jun 2020 actual spend (start of pandemic in the US), spend is up 20% 3rd round of stimulus 5 5 4 7 1. Includes credit-card and some debit-card spending data among banked consumers. While card spending represents only a part of overall consumer spending (such as housing, utilities and other major categories excluded from credit-card spending), the changes in card data closely track changes in official consumption figures reported by the Bureau of Economic Analysis. This is because the share of unaffected categories in card spending is comparable with the share of categories not affected negatively by COVID-19 in overall consumption (which includes housing). Year-over- year growth in monthly sales during the current period (Feb 2020–Jun 2021) compared with monthly sales in prior period (Feb 2019–Jun 2020) 2. Year-over-year spend in Mar–Aug 2020 decreased by 8% compared with same period in previous year, whereas Sep 2020–Feb 2021 remained flat compared with same period in previous year 3. Re-forecasted Mar–Jun 2020 spend calculated by growing Feb–May 2020 spend by the same 1-month growth rate observed in Feb–May 2019 4. Year-over-year change in spend for stimulus recipients, vs those who did not receive stimulus payments Current as of June 2021
  • 3. McKinsey & Company 3 Confidence in own country’s economic recovery after COVID-191 % of US respondents 13 16 14 15 16 16 16 15 15 20 18 17 18 19 21 17 17 14 13 14 43 45 45 47 46 48 48 52 52 49 49 49 47 46 46 46 45 44 46 45 44 39 41 37 39 35 36 33 34 32 33 34 36 35 32 36 39 42 41 41 Oct 23–27 May 4–10 Mar 16–17 Mar 20–22 Mar 30– Apr 5 Apr 6–12 Apr 13–19 Apr 27– May 3 Apr 20–26 Jul 7–12 May 11–17 May 18–24 Jun 1–7 Jun 15–21 Jul 30– Aug 2 Aug 19–23 Sep 18–24 Nov 9–13 Feb 18–22 Mar 23–29 Mixed: The economy will be affected for 6–12 months or longer and will stagnate or show slow growth thereafter Pessimistic: COVID-19 will have lasting impact on the economy and show regression or fall into lengthy recession Optimistic: The economy will rebound within 2–3 months and grow just as strong as or stronger than before COVID-19 1. Spend recovery in the United States is driven by increased consumer optimism Signs of spend recovery Source: McKinsey & Company COVID-19 US Consumer Pulse Survey Feb 18–22, 2021, n = 2,076; Nov 9–13, 2020, n = 2,024; Oct 23–27, 2020, n = 2,021; Sep 18–24, 2020, n = 1,026; Aug 19–23, 2020, n = 2,026; Jul 30–Aug 2, 2020, n = 2,024; Jul 7–12, 2020, n = 1,923; Jun 15– 21, 2020, n = 2,006; Jun 1–7, 2020, n = 1,966; May 18–24, 2020, n = 1,975; May 11–17, 2020, n = 2,002; May 4–10, 2020, n = 1,993; Apr 27–May 3, 2020, n = 2,105; Apr 20–26, 2020, n = 1,052; Apr 13–19, 2020, n = 1,052; Apr 6–12, 2020, n = 1,063; Mar 30–Apr 5, 2020, n = 1,484; Mar 23–29, 2020, n = 1,119; Mar 20–22, 2020, n = 1,073; Mar 16–17, 2020, n = 1,042; sampled and weighted to match the US general population 18+ years 2020 2021 1. Q: What is your overall confidence level surrounding economic conditions after the coronavirus (COVID-19) crisis subsides (i.e., once there is herd immunity)? Rated from 1 “very optimistic” to 6 “very pessimistic” Figures may not sum to 100% because of rounding Current as of February 2021 Conducted before spring/summer 2021 surge in infections
  • 4. McKinsey & Company 4 Confidence in own country’s economic recovery after COVID-191 % of respondents 10 18 17 32 21 31 20 37 43 53 59 50 62 52 67 61 47 30 24 18 17 17 12 2 14 45 41 Mixed: The economy will be impacted for 6–12 months or longer and will stagnate or show slow growth thereafter Pessimistic: COVID-19 will have lasting impact on the economy and show regression/ fall into lengthy recession Optimistic: The economy will rebound within 2–3 months and grow just as strong as or stronger than before COVID-19 1. The United States is more optimistic than European countries but less so than China or Mexico Signs of spend recovery 1. Q: What is your overall confidence level surrounding economic conditions after the coronavirus (COVID-19) crisis subsides (i.e., once there is herd immunity)? Rate from 1 “very optimistic” to 6 “very pessimistic” Bars may not sum to 100 percent due to rounding 2. China’s increase in optimism was compared with Sep instead of Nov United States China Germany United Kingdom Spain Italy France Japan Feb 18 – Feb 22 Feb 20 – Mar 8 Feb 23 – Feb 27 Feb 23 – Feb 27 Feb 23 – Feb 27 Feb 23 – Feb 27 Feb 23 – Feb 27 Feb 23 – Feb 27 Source: McKinsey & Company COVID-19 Consumer Pulse Survey Mexico Feb 20 – Mar 2 0 9 3 13 1 7 4 3 5 X Increase in optimism since Nov 2020 percentage points2 Conducted before spring/summer 2021 surge in infections Current as of February 2021
  • 5. McKinsey & Company 5 1. Consumers’ optimism manifests in their excitement to splurge, especially among younger and wealthier consumers >70% <30% 50–70% 30–49% Source: McKinsey & Company COVID-19 US Consumer Pulse Survey Feb 8–22, 2021, n = 2,076, sampled and weighted to match the US general population 18+ years ~51% Plan to splurge or treat themselves 32 50 53 29 51 66 63 34 65 82 66 46 Expected leisure spend in 20211 % of respondents who plan to treat themselves or splurge Gen Z (18–24 years old) Millennials (25–40 years old) Gen X (41–56 years old) Generation 2 Middle Low High Baby boomers (57–75 years old) Household income ($50,000– $100,000/year) (<$50,000/year) (>$100,000/year) Signs of spend recovery 1. Q: With regard to products and services you will spend money on, do you plan to splurge/treat yourself in 2021? Figures may not sum to 100% because of rounding 2. Ages by generation as of 2021. Members of Gen Z were born in 1997–2012, millennials in 1981–96, Gen X in 1965–80, and baby boomers in 1946–64. The traditionalist/silent generation is not included, due to a low sample size Current as of February 2021
  • 6. McKinsey & Company 6 1. This extra spend is expected across categories, and more than half of consumers plan to treat themselves before COVID-19 subsides Expected leisure categories on which people plan to splurge or treat themselves in 20211 % of respondents who plan to splurge or treat themselves 46 44 43 37 32 30 28 28 27 Out-of-home entertainment Restaurants, dining out, bars ​Apparel, shoes, accessories Travel, lodging, vacation Beauty and personal care Electronics Items for your home Household essentials Fitness, sports, outdoors Trigger for when people plan to splurge or treat themselves2 % of respondents who plan to splurge or treat themselves on that category 24 16 32 29 32 37 15 26 20 22 26 23 26 21 20 27 22 28 15 13 13 12 14 10 14 18 17 40 45 32 34 33 34 44 34 36 Anytime When family is vaccinated When government restrictions lifted / COVID-19 stops spreading When I am vaccinated Source: McKinsey & Company COVID-19 US Consumer Pulse Survey Feb 18–22, 2021, n = 2,076, sampled and weighted to match the US general population 18+ years Signs of spend recovery 1. Q: You mentioned that you plan to splurge/treat yourself in 2021. Which categories do you intend to treat yourself to? Please select all that apply 2. Q: Which best describes when you will most likely splurge/treat yourself? Figures may not sum to 100% because of rounding Current as of February 2021
  • 7. McKinsey & Company 7 Estimated 2020 and Q1 2021 savings, ratio to corresponding 2019 savings 1. Spending restrictions during COVID-19 and stimulus payments boosted savings and ability to spend in 2021, especially in US Signs of spend recovery Source: BEA; Eurostat; Oxford Economics; McKinsey Global Institute analysis 2.3x US 3.1x UK 2.1x 1.7x 1.5x Germany 1.8x 1.6x France 1.7x 1.1x China 1.1x Q1 2021 vs Q1 2019 2020 vs 2019 2019 (base) Current as of Q1 2021
  • 8. McKinsey & Company 8 1. Spend by lower-income groups drove disproportionate growth until April 2021, when higher-income consumer spend outpaced others Signs of spend recovery Source: Affinity credit card spend data from Feb 2019 to Jun 2021 (spend samples cardholders and underrepresents highest- and lowest-income bands) Year-over-year credit card spend by population sub-segment,1 % −30 −20 −10 0 10 20 30 Feb Mar Apr May Jun May Jul Apr Aug Sep Oct Jan Nov Dec Feb Mar Jun Low ($0–35,000) High (≥$80,000) Medium ($35,000–$80,000) Stimulus payment 7 Lower-income consumers −2 −1 Higher-income consumers 10 Medium-income consumers 3 4 Cumulative year- over-year change Jun 2021 vs Jun 2020 year-over-year change Change in spend, by income level,1 % 2020 2021 1. Re-forecasted Mar–Jun 2020 spend calculated by growing Feb–Jun 2020 spend by the same 1-month growth rate observed for Feb–Jun 2019 Current as of June 2021
  • 9. McKinsey & Company 9 Source: Affinity Solutions credit-card and debit-card spend data for Feb 2019–Jun 2021; Facteus debit-card spend data for Feb 2019–Jun 2021; Stackline Amazon spend data for Feb 2019–Jun 2021 2. Online penetration shifted upward with COVID-19’s onset and has remained ~35 percent above pre-COVID-19 levels Omnichannel is here to stay ~35% Increase in online penetration since Mar 2020, based on credit-card and debit-card spend Retail-oriented online credit-card and debit-card spend as % of total1 19 20 27 27 25 26 25 25 25 29 30 27 26 26 25 24 26 Jun Apr May Last 12 months2 Mar 2020 Dec Aug Jul Apr Sep Oct Mar Nov Jan 2021 Feb May Jun ~+35% 1. Includes the following retailer categories: Amazon; apparel, software and electronics, cosmetics; pet shops; home stores; mass stores; club stores; restaurants; grocery stores; drugstores; discount stores 2. Average monthly online penetration from Mar 2019 to Feb 2020 Current as of June 2021
  • 10. McKinsey & Company 10 2. The trajectory of e-commerce penetration has differed by category and retailer Omnichannel is here to stay Source: Affinity Solutions credit-card and debit-card spend data for Jan 2019–Jun 2021; Facteus debit-card spend data for Jan 2019–Jun 2021; Stackline Amazon spend data, Jan 2019–Jun 2021 46% 83% 55% Apr 2020 spike Pre- COVID-19, last 12 months5 Jun 2021 +18% 13% 19% 20% Jun 2021 Apr 2020 spike Pre- COVID-19, last 12 months5 +63% 5% 9% 9% Pre- COVID-19, last 12 months5 Jun 2021 Apr 2020 spike +75% Online sales as a % of overall sales for credit-card and debit-card spend,1 by level of pre-COVID-19 penetration High penetration2 (>20%) Moderate penetration3 (7–20%) Low penetration4 (<7%) Categories with lower pre-COVID-19 online penetration saw higher e-commerce growth in March and may be more likely to sustain online penetration rates seen during the pandemic Categories with already high online penetration saw a dramatic spike during April’s lockdowns 1. Re-forecasted Mar–Jun 2020 spend calculated by growing Feb–May 2020 spend by the same 1-month growth rate observed for Feb–May 2019 2. High-online-penetration retail categories include those with >20% pre-COVID-19 internet penetration: apparel, software and electronics, cosmetics, pet shops 3. Medium-online-penetration retail categories include those with 7–20% pre-COVID-19 internet penetration: home stores, mass stores, club stores 4. Low-online-penetration retail categories include those with <7% pre-COVID-19 internet penetration: restaurants, grocery stores, drugstores, discount stores 5. Online penetration from Mar 2019 to Feb 2020 Current as of June 2021
  • 11. McKinsey & Company 11 2. On a year-over-year basis, e-commerce has grown by more than 40 percent while brick-and-mortar has remained flat Retail channel, year-over-year growth in spend,1 2019–21, % Total3 Brick-and- mortar sales4 E-commerce sales4 Source: Affinity Solutions credit-card spend data for Feb 2019–Jun 2021; Stackline Amazon spend data, Jan 2019–Jun 2021 Year-over-year change Last 12 months vs last 13–24 months 1 2 44 E- commerce acceleration Apr–May −13 −13 62 Early summer Jun–Jul −5 −3 52 Holiday Nov–Dec 0 −2 41 Early 2021 Jan–Feb −1 2 44 Fall Aug–Oct 0 3 49 May–Jun2 6 5 39 Early shelter in place Mar 1 27 −6 Pre- COVID-19 Feb 2020 7 24 10 Start of recovery2 Mar–Apr 5 5 48 Omnichannel is here to stay Current as of June 2021 1. Includes credit-card and some debit-card spending data among banked consumers. While card spending represents only a part of overall consumer spending (such as housing, utilities, and other major categories excluded from credit-card spending), the changes in card data closely track changes in official consumption figures reported by the Bureau of Economic Analysis. This is because the share of unaffected categories in card spending is comparable with the share of categories not affected negatively by COVID-19 in overall consumption (which includes housing). Year-over-year growth in monthly sales during current period (Feb 2020–Jun 2021) compared with monthly sales in prior period (Feb 2019–Jun 2020) 2. Year-over-year growth for Mar–Jun 2021 relative to estimate of Mar–Jun 2020 had COVID not occurred. Re-forecasted Mar–Jun 2020 spend calculated by growing Feb–May 2020 spend by the same 1-month growth rate observed for Feb– May 2019 3. Includes the following retail channels: Amazon; apparel, software and electronics, cosmetics; pet shops; home stores; mass stores; club stores; restaurants; grocery stores; drugstores; discount stores; auto and cable/telecom (not shown separately); and experiences, including out-of-home entertainment and travel 4. Includes the following retailer categories: Amazon; apparel, software and electronics, cosmetics; pet shops; home stores; mass stores; club stores; restaurants; grocery stores; drugstores; and discount stores Year-over-year sales growth, % −10 0 10 20 −20 < −30 > 30
  • 12. McKinsey & Company 12 2. Telecom has remained flat; experiences (travel and out-of-home entertainment) have yet to return to pre-Covid-19 levels Source: Affinity Solutions credit-card spend data for Feb 2019–Jun 2021 Omnichannel is here to stay Experiences (e.g., travel, out-of-home entertainment) Telecom and cable Fuel and other auto3 −46 −4 −21 −73 2 −41 −58 0 −22 −52 1 −16 −52 2 −18 −51 2 −8 −13 −1 −1 7 7 10 −41 1 −10 −32 2 −3 Current as of June 2021 1. Includes credit-card and some debit-card spending data among banked consumers. While card spending represents only a part of overall consumer spending (such as housing, utilities, and other major categories excluded from credit-card spending), the changes in card data closely track changes in official consumption figures reported by the Bureau of Economic Analysis. This is because the share of unaffected categories in card spending is comparable with the share of categories not affected negatively by COVID-19 in overall consumption (which includes housing). Year-over-year growth in monthly sales during current period (Feb 2020–Jun 2021) compared with monthly sales in prior period (Feb 2019–Jun 2020) 2. Year-over-year growth for Mar–Jun 2021 relative to estimate of Mar–Jun 2020 had COVID-19 not occurred. Re-forecasted Mar–Jun 2020 spend calculated by growing Feb–May 2020 spend by the same 1-month growth rate observed for Feb–May 2019 3. Includes automotive parts and accessories retailers (e.g., AutoZone, Napa), fuel dispensers (e.g., Chevron, CITGO), and service stations (e.g., BP, Shell, 76, Hess) Year-over-year change Last 12 months vs last 13–24 months E- commerce acceleration Apr–May Early summer Jun–Jul Holiday Nov–Dec Early 2021 Jan–Feb Fall Aug–Oct May–Jun Early shelter in place Mar Pre- COVID-19 Feb 2020 Start of recovery2 Mar–Apr Retail channel, year-over-year growth in spend,1 2019–21, % Year-over-year sales growth, % −10 0 10 20 −20 < −30 > 30
  • 13. McKinsey & Company 13 3. Channel and category performance has evolved into five distinct performance types over the course of the pandemic Disparate recovery Early pandemic May–Jul 2020 Later 2020 Aug–Dec Early 2021 Jan–May Description Categories/ channels A Robust year-over-year growth throughout, due to larger consumer shifts (e.g., homebody economy) Sustained elevation  Amazon  Software and electronics  Home  Pet shop  Sporting apparel  Cosmetics B Fast rise in early days of COVID-19, with growth subsiding over time / Normalizing growth  Grocery channels  Discount stores  Mass stores  Wholesale clubs  Drugstores and pharmacies C Steady demand, not affected by COVID-19 Unaffected  Telecom/cable D Significant declines at the outset of COVID-19, with quicker recovery Approaching recovery  Retail apparel  Fuel and other auto  Restaurants E Larger decline (−50% or more year over year), with slower path to recovery Larger decline  Out-of-home entertainment  Travel Current as of June 2021
  • 14. McKinsey & Company 14 3. Disparate recovery is observed among categories – some are experiencing sustained elevation, while others remain depressed Disparate recovery Source: Affinity credit card spend data for Feb 2019–Jun 2021; Stackline Amazon spend data for Feb 2019–Jun 2021 Year-over-year sales growth, % Amazon2 Software and electronics Home Pet shops Sporting apparel Restaurants Fuel and other auto Retail apparel Out-of-home entertainment Travel Total Pre- COVID-19 Feb 2020 Early shelter in place Mar Fall Aug–Oct E-commerce acceleration Apr–May Early summer Jun–Jul 2021 Jan–Feb Mar–Apr adjusted1 Holiday Nov–Dec Sustained elevation Normalizing growth Approaching recovery Larger decline Unaffected Discount stores Wholesale clubs Mass Drugstores and pharmacies Cosmetics Grocery stores Telecom/cable 30 13 15 15 6 9 10 5 30 5 10 4 15 10 7 14 9 7 38 9 2 24 −14 −24 −21 −43 −52 −46 −6 18 20 15 22 −9 36 −4 36 28 35 21 27 −1 −16 −9 −78 −49 0 13 13 8 10 8 10 1 45 29 24 18 −6 −26 −41 −53 −79 −72 −13 9 0 9 2 1 15 2 40 23 28 19 25 −10 −22 −15 −79 −56 −5 9 9 3 9 9 9 0 May–Jun adjusted1 34 25 21 22 36 5 −1 7 −28 −12 6 12 10 7 7 25 6 −1 30 22 30 22 21 −2 −8 −5 −75 −48 −1 13 12 10 1 14 9 2 40 26 34 24 36 3 −3 3 −62 −28 4 31 13 7 4 30 5 2 37 20 28 6 22 11 16 7 8 −6 −18 −12 5 −78 9 −48 0 2 15 30 −15 > 30 −30 < −45 1. Year-over-year growth for Mar–Jun 2021 relative to estimate of Mar–Jun 2020 had COVID not occurred. Re-forecasted Mar–Jun 2020 spend calculated by growing Feb–May 2020 spend by the same 1-month growth rate observed for Feb– May 2019 2. Excludes sales in automotive, beauty, grocery, home improvement, home and furniture, pet supplies, apparel and accessories, electronics, sports and outdoors, as these categories are embedded into subsequent rows Current as of June 2021
  • 15. McKinsey & Company 15 3. Sustained elevation: Some categories see continued increased demand, but lower-income consumers are starting to decelerate Disparate recovery Source: Affinity Solutions credit-card spend data for Feb 2019–Jun 2021; Stackline Amazon spend data for Jan 2019–Jun 2021 Year-over-year credit-card spend by income segment,1 % Home 60 −40 40 0 −20 20 80 Apr Mar Feb Mar Feb Apr May Jun Jul Aug Sep Oct Nov Dec Jan May Jun $0–35,000 $35,001–80,000 >$80,000 Sporting apparel 0 60 −40 −20 20 40 80 Feb Mar Apr May Jun Jul Aug Sep Oct Dec Nov Feb Jan Mar Apr May Jun Software and electronics 40 −40 80 20 0 −20 60 May May Jul Feb Mar Oct Apr Mar Jun Aug Sep Nov Dec Jan Feb Apr Jul 80 −20 −40 40 0 20 60 Mar Jul Feb Mar Apr May Jun Aug Jun Sep Oct Nov Dec Apr Jan Feb May Pet shops A. Sustained elevation Current as of June 2021 1. Mar–Jun figure is based on re-forecasted Mar–Jun 2020 spend to estimate Mar−Jun 2020 spend without COVID-19. Calculated by growing Feb−Jun 2020 spend by the same 1-month growth rate observed for Mar−Jun 2019. Note that not all panelists have income identified, so the stratified income view does not always match the total view
  • 16. McKinsey & Company 16 3. Normalizing growth: Initial surge subsided with higher-income consumers now starting to outpace others Disparate recovery Source: Affinity Solutions credit-card spend data from 2/2019–6/2021; Stackline Amazon spend data from 1/2019–6/2021 20 −10 −20 40 0 10 30 Apr Feb Jul Mar May Jun Aug Sep Oct Nov Dec Jan Feb Mar Apr May Jun −20 −10 40 0 10 20 30 May Jun Feb Mar Apr May Jul Aug Sep Oct Nov Dec Jan Apr Feb Mar Jun Discount stores −20 −10 0 10 30 20 40 Aug Nov Feb Mar Apr Apr May Jun Jul Dec Sep Mar Oct Jan Feb May Jun Wholesale clubs Mass stores2 40 −20 0 30 −10 10 20 Feb Apr Apr Mar May Aug Jun Jul Sep Oct Nov Jan Dec Feb Mar May Jun Grocery 30 −20 −10 0 10 20 40 Mar Feb Jun Mar Jun Nov Apr Oct May Jul Aug Sep Dec Jan Feb Apr May Drugstores and pharmacies $0–35,000 $35,001–80,000 >$80,000 B. Normalizing growth Year-over-year credit-card spend by income segment,1 % Current as of June 2021 1. Mar–May figure is based on re-forecasted Mar–Jun 2020 spend to estimate Mar–Jun 2020 spend without COVID-19. Calculated by growing Feb–Jun 2020 spend by the same 1-month growth rate observed for Mar–Jun 2019. Note that not all panelists have income identified, so the stratified income view does not always match the total view 2. Mass stores includes Target and Walmart
  • 17. McKinsey & Company 17 Year-over-year credit-card spend by income segment,1 % 3. Approaching recovery: After initial steep declines, some categories have seen recovery as consumers increase in-person spend Disparate recovery Source: Affinity Solutions credit-card spend data for Feb 2019–Jun 2021; Stackline Amazon spend data for Jan 2019–Jun 2021 20 −100 −20 −40 −80 −60 0 Feb Mar Mar Apr May Jun Jul Aug Sep Oct Nov Dec Jan Feb Apr May Jun 100 −50 0 50 150 200 Feb Mar Apr May Jun Jul Aug Sep Oct Nov Dec Jan Feb Mar Apr May Jun Online purchase Quick-service restaurants On-site Retail apparel In-store −100 20 −80 −60 −40 −20 0 Apr Feb Mar Apr Dec Jul May Jun Aug May Sep Oct Nov Jan Feb Mar Jun −50 150 200 100 0 50 Mar Feb Jan Sep Aug Nov Apr May Jun Jul Dec Oct Feb Mar Apr May Jun Online purchase $0–35,000 $35,001–80,000 >$80,000 D. Approaching recovery Current as of June 2021 1. Mar–Jun figure is based on re-forecasted Mar–Jun 2020 spend to estimate Mar–Jun 2020 spend without COVID-19. Calculated by growing Feb–May 2020 spend by the same 1-month growth rate observed for Feb–May 2019. Note that not all panelists have income identified, so the stratified income view does not always match the total view
  • 18. McKinsey & Company 18 Year-over-year credit-card spend by income segment,1 % −30 −90 −80 40 −70 −40 −60 −50 0 −20 −10 10 20 30 Jan Feb Sept Mar Mar Apr May June Jun Jul Aug Oct Nov Dec Feb Apr May 3. Larger declines seen in travel and out-of-home categories are starting to recover Disparate recovery Source: Affinity Solutions credit-card spend data for Feb 2019–Jun 2021; Stackline Amazon spend data for Jan 2019–Jun 2021 −50 −90 −30 −80 −70 −60 −20 −40 −10 0 10 20 30 40 Jun Dec Oct Mar June Feb Apr May Mar Jul Aug Sept Nov Jan Feb Apr May Travel $0–35,000 >$80,000 $35,001–80,000 Out-of-home entertainment E. Larger decline Current as of June 2021 1. Mar–Jun figure is based on re-forecasted Mar–Jun 2020 spend to estimate Mar–Jun 2020 spend without COVID-19. Calculated by growing Feb–May 2020 spend by the same 1-month growth rate observed for Feb–May 2019. Note that not all panelists have income identified, so the stratified income view does not always match the total view
  • 19. McKinsey & Company 19 3. In the online channel, consumers have been trading up since Q4 2020; categories are close to pre-COVID-19 prices −5 5 10 > 10 −10 < −15 Source: Stackline Amazon spend data, Jan 2019–1st half Jul 2021 Year-over-year growth of Amazon average selling price, by product category, 2019–21, % Home and furniture Apparel and accessories Beauty Power and hand tools Electronics Grocery Health Kitchen and dining Sports and outdoors Pet supplies Automotive Lawn and garden Home improvement Office and school supplies Shoes Household supplies Baby and nursery Toys and non-video games Jewelry Industrial hardware Overall Pre-COVID-19 Feb 2020 Early shelter in place Mar E-commerce acceleration, Apr–May Early summer, Jun–Jul Fall, Aug–Oct Holiday, Nov–Dec −3 0 2 −3 7 3 −7 −10 −11 −9 −9 −8 −7 −12 −8 −4 −2 −1 −5 −5 4 1 4 4 2 15 22 20 17 17 −9 −10 −9 −4 −1 1 −8 −10 −4 3 3 1 −5 −6 −1 2 3 7 −5 −8 −13 −11 0 −4 -6 −7 −1 0 2 4 5 1 3 5 4 1 −8 −9 −4 −4 13 6 −8 −11 −7 −6 −2 −1 −5 1 13 8 7 16 11 3 0 −2 6 3 −6 −9 −7 −7 −5 0 −5 −10 −5 −3 2 1 −7 −5 3 1 6 6 8 2 2 8 6 1 −9 −12 −7 −3 −4 −2 −5 −8 −8 −7 −1 3 20211 Jan–Feb 2 −1 −5 −1 2 12 4 7 18 2 5 7 6 14 3 9 1 5 1 1 −4 −4 7 7 0 6 10 7 −8 −10 −2 9 1 8 Mar 7 10 −1 3 −2 4 −1 8 −2 3 7 −1 −3 7 7 3 14 −4 0 0 3 0 −5 8 3 Apr–May 4 7 −1 7 2 −7 2 4 18 −1 10 8 6 −6 3 −4 −3 10 −6 4 −1 Jun–Jul2 7 13 −4 0 Current as of July 2021 Disparate recovery 1. Year-over-year growth in 2021 is calculated by using actual sales numbers in 2020 reflecting impact from COVID-19 2. Includes all of Jun-2021 and half of Jul-2021
  • 20. McKinsey & Company 20 What US consumers have done since COVID-19 started1 and intent to continue2 % of respondents 4. More than 75 percent of Americans have tried a new shopping behavior during the pandemic, and the trend continues in 2021 40 39 34 29 26 Private label/store brand New shopping method4 Different brand Different retailer/store/website New digital shopping method Source: McKinsey & Company COVID-19 US Consumer Pulse Survey, Feb 18–22, 2021, n = 2,076, sampled and weighted to match the US general population 18+ years Growth, Aug 2020–Feb 20213 44% of millennials and Gen Z have tried a new brand6 77% of consumers have tried a new shopping behavior 84% of millennials and Gen Z have tried a new shopping behavior6 Intent to continue 1x 1x 1.1x 1.2x 1.2x 76 78 79 81 81 Loyalty shakeup Have done 35% of baby boomers have tried a new brand6 Current as of February 2021 1. Q: Since the coronavirus (COVID-19) crisis started, which of the following have you done? 23% of consumers selected “none of these” 2. Q: Which best describes whether or not you plan to continue with these shopping changes once the coronavirus (COVID-19) crisis has subsided (i.e., once there is herd immunity)? Possible answers: “will go back to what I did before coronavirus”; ”will keep doing both this and what I did before coronavirus”; ”will keep doing this and NOT go back to what I did before coronavirus.” Includes respondents who selected “will keep doing both this and what I did before coronavirus” and “will keep doing this and NOT go back to what I did before coronavirus” 3. Growth is indicated by numbers greater than 1 (e.g., 1x indicates no growth, 1.1x indicates 10% growth) 4. Includes curbside pickup and delivery apps 5. Members of Gen Z were born in 1997–2012, millennials in 1981–96, Gen X in 19–80, and baby boomers in 1946–64. The traditionalist/silent generation is not included due to a low sample size
  • 21. McKinsey & Company 21 4. Value was the main reason why consumers switched brands, but they also switched for purpose, quality, and novelty 40% 38% 16% 13% 42% 17% 9% 11% 11% 24% 18% 24% 17% 19% 16% 26% 19% Products in stock Supporting local businesses Better shipping/delivery cost Better value Better prices/promotions More sustainable/better for the environment Larger package sizes The company treats its employees well Shares my values Better quality Natural or organic I wanted to try a new brand I found I wanted to try a type of product I’ve never tried before I wanted to treat myself I wanted variety or change from my normal routine Available where I’m shopping (i.e., in store or online) Cleaner or safer Reason for trying a new brand since COVID-19 began1 % of respondents selecting reason in top 3 Source: McKinsey & Company COVID-19 US Consumer Pulse Survey, Feb 18–22/2021, n = 2,076, sampled and weighted to match the US general population 18+ years 42% of millennials and Gen Z cite purpose as a primary reason2 44% of millennials and Gen Z cite quality/organic as a primary reason2 Net % of respondents per category X% Value 65% Quality/organic 34% Availability 42% Convenience 26% Purpose-driven 34% Novelty 33% Health/hygiene 16% Personal choice 28% Loyalty shakeup Current as of February 2021 1. Q: You mentioned you tried a new/different brand than what you normally buy. What were the main reasons that drove this decision? Select all that apply. “Brand” includes different brand, new private label/store brand 2. Members of Gen Z were born in 1997–2012, millennials in 1981–96
  • 22. McKinsey & Company 22 Source: McKinsey Global Sentiment Survey, 2020 and 2021 Trade-off behavior in a standard shopping basket, all consumers by income tier1 % of respondents, Sep 2019 and Sep 20202 >$100,000 $50,000–100,000 <$50,000 US income tiers, per household, annual 6 18 4 3 3 17 6 3 3 10 6 10 Total 4 16 5 5 3.65x 4. Trade-down increased across income groups; trade-up increased as well for consumers with household income over $100,000 2019 2020 Trade-down Trade-up Loyalty shakeup Current as of September 2020 1. Q: Please indicate how your buying behavior has changed in a standard shopping basket for the items shown in the past 12 months (since Sep 2019). Select all that apply, with option 7 being mutually exclusive and option 1 exclusive from option. Possible answers: “Switching to less expensive brands”; “Switching to more expensive/premium brands”; “Buying the same brand as I bought 12 months ago, but at stores with lower prices”; “Buying only when on sale or with coupon”; “Buying less frequently or lower quantity of the same brand”; “Have made some other change in how I buy these products”; “Have not made changes in how I buy these products” Trade-down reflects “Switching to less expensive brands” option as a percentage of all consumers, while trade-up reflects “Switching to more expensive brands” as a percentage of all consumers 2. For 2019, n = 4,507; for 2020, n = 1,030
  • 23. McKinsey & Company 23 Homebody economy 5. Consumers have made life changes that increase stickiness of the homebody economy 32% Work / study change Worked more from home Changed jobs Went back to school 28% Home renovation 26% Investments / Divestments Set up a specific work-from- home space Set up a gym at home Renovated/remodeled home Bought a car Reassessed my investment portfolio Bought / sold a property Changes made in the last 12 months as a result of COVID-191 % of respondents2 Current as of February 2021 1 Versus estimate for Mar 2020 spend if COVID-19 pandemic had not occurred. Revised Mar 2020 baseline calculated by increasing Feb 2020 spend by the same 1-month growth rate observed for Feb–Mar 2019 2 n = 2,076, sampled and weighted to match the US general population 18+ years Source: McKinsey & Company COVID-19 US Consumer Pulse Survey, Feb 18–22, 2021
  • 24. McKinsey & Company 24 Allowing work from home (WFH) full-time for selected staff 66 Allowing WFH part-time for selected staff Migration of training and related events to online models only Reducing time staff are expected to travel to sites other than their primary place of work 68 62 Subsidies for costs of setting up robust WFH capabilities 61 34 72% of executives say their organizations have started adopting permanent remote-working models 5. About 70 percent of companies plan to continue with some type of hybrid remote work even after the pandemic Homebody economy McKinsey survey of C-level executives (n = 278) Top 5 policy modifications % of respondents Source: McKinsey Corporate Business Functions Practice, Aug 2020 Current as of August 2020