McKinsey Survey: US consumer sentiment during the coronavirus crisis
•
0 j'aime•29,174 vues

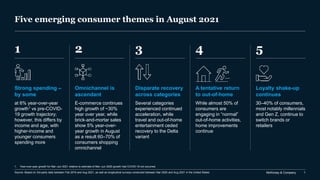
1. Consumer spending has remained strong, growing 6% year-over-year from March to June 2021 compared to estimated growth without COVID-19, though spending differs by income and age. 2. While under 30% say their routines are back to normal, most expect normalcy will return in 2022. Higher-income and younger consumers are more optimistic about recovery. 3. Around 40% of consumers say their finances will return to normal in 2022, while 40% say finances are already normal or not affected. Intent to splurge has moderated among older, middle-income consumers since early 2021.

Recommandé
Recommandé
Contenu connexe
Tendances
Tendances (20)
Similaire à McKinsey Survey: US consumer sentiment during the coronavirus crisis
Similaire à McKinsey Survey: US consumer sentiment during the coronavirus crisis (20)
Plus de McKinsey on Marketing & Sales
Plus de McKinsey on Marketing & Sales (17)
Dernier
Dernier (20)
McKinsey Survey: US consumer sentiment during the coronavirus crisis
- 1. McKinsey & Company 1 Five emerging consumer themes in August 2021 1 2 Source: Based on 3rd-party data between Feb 2019 and Aug 2021, as well as longitudinal surveys conducted between Mar 2020 and Aug 2021 in the United States 1. Year-over-year growth for Mar–Jun 2021 relative to estimate of Mar–Jun 2020 growth had COVID-19 not occurred. 5 4 3 Strong spending – by some at 6% year-over-year growth1 vs pre-COVID- 19 growth trajectory; however, this differs by income and age, with higher-income and younger consumers spending more Omnichannel is ascendant E-commerce continues high growth of ~30% year over year, while brick-and-mortar sales show 5% year-over- year growth in August as a result 60–70% of consumers shopping omnichannel Loyalty shake-up continues 30–40% of consumers, most notably millennials and Gen Z, continue to switch brands or retailers A tentative return to out-of-home While almost 50% of consumers are engaging in “normal” out-of-home activities, home improvements continue Disparate recovery across categories Several categories experienced continued acceleration, while travel and out-of-home entertainment ceded recovery to the Delta variant
- 2. McKinsey & Company 2 15 16 17 17 20 18 16 14 13 14 16 45 48 50 48 46 46 45 44 46 45 41 40 36 33 35 34 36 39 42 41 41 43 Mar 2020 Oct 2020 Apr 2020 May 2020June 2020July 2020 Sept 2020 Nov 2020 Feb 2021 Aug 2020 Aug 2021 1. Overall optimism has slowly increased in 2021, although pessimism has also increased slightly Spending remains strong | Current as of August 2021 Confidence in own country’s economic recovery after COVID-19,1 % of US respondents 1. Q: What is your overall confidence level surrounding economic conditions after the coronavirus (COVID-19) crisis subsides (ie, once there is herd immunity)? Rated from 1 “very optimistic” to 6 “very pessimistic.” Average of weekly pulse surveys shown for March through April 2020. Figures may not sum to 100% because of rounding. Optimistic: The economy will rebound within 2–3 months and grow just as strong as or stronger than before COVID-19 Mixed: The economy will be affected for 6–12 months or longer and will stagnate or show slow growth thereafter Pessimistic: COVID- 19 will have lasting impact on the economy and show regression / fall into lengthy recession Source: McKinsey & Company COVID-19 US Consumer Pulse Survey 8/25–8/31/2021, n = 2,004; 2/18–2/22/2021, n = 2,076; 11/9–11/13/2020, n = 2,024; 10/23–10/27/2020, n = 2,021; 9/18–9/24/2020, n = 1,026; 8/19–8/23/2020, n = 2,026; 7/30–8/2/2020, n = 2,024; 7/7–7/12/2020, n = 1,923; 6/15–6/21/2020, n = 2,006; 6/1–6/7/2020, n = 1,966; 5/18–5/24/2020, n = 1,975; 5/11–5/17/2020, n = 2,002; 5/4–5/10/2020, n = 1,993; 4/27–5/3/2020, n = 2,105; 4/20–4/26/2020, n = 1,052; 4/13–4/19/2020, n = 1,052; 4/6–4/12/2020, n = 1,063; 3/30–4/5/2020, n = 1,484; 3/23–3/29/2020, n = 1,119; 3/20–3/22/2020, n = 1,073; 3/16–3/17/2020, n = 1,042; sampled and weighted to match the US general population 18+ years
- 3. McKinsey & Company 3 1. Higher-income consumers are significantly more optimistic compared with lower-income groups Spending remains strong | Current as of August 2021 Confidence in own country’s economic recovery after COVID-19 by income level,1 % of respondents 30 30 35 36 32 41 38 39 45 48 54 57 25 0 30 5 35 10 20 15 40 45 50 55 60 Sept 2020 Aug 2021 July 2020 Feb 2021 Medium ($50,000–100,000) Low (<$50,000) High (>$100,000) 24 21 18 20 18 17 15 12 10 10 20 10 0 35 30 5 55 15 25 40 45 50 60 Aug 2021 14 Feb 2021 July 2020 16 Sept 2020 1. Q: What is your overall confidence level surrounding economic conditions after the coronavirus (COVID-19) crisis subsides (ie, once there is herd immunity)? Rated from 1 “very optimistic” to 6 “very pessimistic.” Optimism by income Pessimism by income Source: McKinsey & Company COVID-19 US Consumer Pulse Survey 8/25–8/31/2021, n = 2,004; 2/18–2/22/2021, n = 2,076; 9/18–9/24/2020, n = 1,026; 7/7– 7/12/2020, n = 1,923; sampled and weighted to match the US general population 18+ years
- 4. McKinsey & Company 4 1. Younger and vaccinated consumers also drive optimism Spending remains strong | Current as of August 2021 Confidence in own country’s economic recovery after COVID-191 % of respondents 36 46 17 40 14 Unvaccinated Vaccinated 47 1. Q: What is your overall confidence level surrounding economic conditions after the coronavirus (COVID-19) crisis subsides (ie, once there is herd immunity)? Rated from 1 “very optimistic” to 6 “very pessimistic.” 2. Baby boomers include Traditionalists Millennials 30 59 48 11 38 20 14 Gen Z 35 47 18 Gen X 35 45 Baby boomers2 Optimistic Mixed Pessimistic Source: McKinsey & Company COVID-19 US Consumer Pulse Survey 8/25–8/31/2021, n = 2,004, sampled and weighted to match the US general population 18+ years By generation By vaccination status
- 5. McKinsey & Company 5 1. While under 30 percent say their routines are back to normal, most expect that normalcy will return to routines only in 2022 Spending remains strong | Current as of August 2021 Expectations on routines returning to normal,1 % of respondents 23 21 30 29 21 28 15 12 56 51 55 59 Baby boomers3 Gen Z Millennials Gen X 21 36 20 16 59 48 Unvaccinated Vaccinated 27 18 55 Overall 1. Q: When do you expect your routines will return to normal? Figures may not sum to 100% because of rounding. 2. Q: Which best describes your vaccination status? 3. Baby boomers include Traditional or Silent Generation. Source: McKinsey & Company COVID-19 US Consumer Pulse Survey 8/25–8/31/2021, n = 2,004, sampled and weighted to match the US general population 18+ years In or after 2022 In 2021 Not affected/already returned By generation By vaccination status2 Younger generations are more optimistic about the return, while ~40% of older consumers expect longer lead time ~40% of unvaccinated consumers are engaging in normal routine, reflecting the highest confidence Key findings
- 6. McKinsey & Company 6 1. An increasing portion of consumers believe that their income, spending and savings are stable Spending remains strong | Current as of August 2021 Reduced slightly/a lot Increased slightly/a lot About the same 9 57 29 34 Past 2 weeks 60 Past 2 weeks 11 11 65 24 Past 2 weeks Past 2 weeks 20 45 14 Past 2 weeks 41 43 37 17 49 34 Past 2 weeks 37 42 21 Past 2 weeks 34 22 44 Past 2 weeks 23 50 27 Past 2 weeks Source: McKinsey & Company COVID-19 US Consumer Pulse Survey 8/25–8/31/2021, n = 2,004; 2/18–2/22/2021, n = 2,076; 11/9–11/13/2020, n = 2,024, sampled and weighted to match the US general population 18+ years 1. Q: How has the coronavirus (COVID-19) crisis affected your (household) income, overall household spending, and amount of income put away as savings over the past 2 weeks? Figures may not sum to 100% because of rounding. Aug 25–31 Feb 18–22 Nov 9–13 Feb 18–22 Aug 25–31 Nov 9–13 Aug 25–31 Nov 9–13 Feb 18–22 Household income1 % of respondents Household spending1 % of respondents Household savings1 % of respondents
- 7. McKinsey & Company 7 1. While ~40 percent of consumers say their finances are back to normal, another ~40 percent say it will take until 2022 Spending remains strong | Current as of August 2021 31 27 29 42 Millennials 28 44 30 Gen Z 45 17 38 Gen X 7 62 Baby boomers3 38 Vaccinated 16 38 20 42 46 Unvaccinated In or after 2022 Not affected/already returned In 2021 Overall 42 19 39 1. Q: When do you expect your personal/household finances will return to normal? Figures may not sum to 100% because of rounding. 2. Q: Which best describes your vaccination status? 3. Baby boomers include Traditional or Silent Generation. Source: McKinsey & Company COVID-19 US Consumer Pulse Survey 8/25–8/31/2021, n = 2,004, sampled and weighted to match the US general population 18+ years By generation By vaccination status2 ~60% of baby boomers say their finances were either not effected or are back to normal, vs ~30% for Gen Z and millennials Expectations on personal/household finances returning to normal,1 % of respondents
- 8. McKinsey & Company 8 1. While consumers still want to splurge, intent to spend moderated among older, middle-income consumers since early 2021 Spending remains strong | Current as of August 2021 1. Q: With regard to products and services you will spend money on, do you plan to splurge/treat yourself in 2021? For example, are there categories of products or services you have spent less on over the last year and half which you feel you will spend more on now? 2. Q: You mentioned that you plan to splurge/treat yourself in 2021. Which categories do you intend to treat yourself to? Please select all that apply. 3. Baby boomers include Traditional or Silent Generation. Source: McKinsey & Company COVID-19 US Consumer Pulse Survey 8/25–8/31/2021, n = 2,004, sampled and weighted to match the US general population 18+ years 58 42 Aug 2021 Do not plan on splurging 51 49 Feb 2021 Plan on splurging Millennials Gen X Baby boomers3 56 3 56 −7 Gen Z 64 −2 45 −5 57 −9 78 −2 17 −10 22 −11 33 −14 31 −1 37 −14 46 −19 Generation 2 Respondents who plan/do not plan to splurge/treat themselves in 2021,1 % of respondents Low (<$50,000/year) Middle ($50,000– $100,000/year) High (>$100,000/year) >70% <30% 50–70% 30–50% p.p. change from Feb 21 XX Respondents who plan to splurge, by household income, %
- 9. McKinsey & Company 9 1. Younger consumers have a strong desire to splurge on apparel and cosmetics, perhaps given more out-of-home activity Spending remains strong | Current as of August 2021 Categories where consumers intend to treat themselves1 % of all respondents with intent to splurge 1 Q: You mentioned that you plan to splurge/treat yourself in 2021. Which categories do you intend to treat yourself to? Please select all that apply. 2 Baby boomers include Traditional or Silent Generation. 41 39 35 33 30 26 26 25 24 23 22 18 15 Personal services Restaurants, dining out, bars Travel, lodging, vacation Apparel, shoes, accessories Out-of-home entertainment Pets Electronics Makeup, skin care products Items for your home Fitness, sports, outdoors Household essentials Sports apparel and equipment Outdoor living Millennials Gen X Gen Z Baby boomers2 37 40 39 52 50 45 33 24 25 37 33 45 38 40 28 18 32 35 27 19 26 30 25 19 45 30 21 8 26 25 22 27 21 34 19 6 Generational cut 22 28 23 12 21 29 20 10 21 22 17 10 9 19 18 6 Change from Feb 2021, percentage points Source: McKinsey & Company COVID-19 US Consumer Pulse Survey 8/25 – 8/31/2021, n=2,004; 2/18–2/22/2021, n = 2,076, sampled and weighted to match the US general population 18+ years Between −3 and +3 < −3 > +3 −5 −4 −9 −4 −2 −4 N/A −3 −3 −5 N/A N/A N/A Leisure categories Difference from all respondents, percentage points
- 10. McKinsey & Company 10 1. Despite intent to splurge moderating since February, consumer spending has maintained strong growth from March to August Spending remains strong | Current as of August 2021 Source: Affinity Solutions credit-card spend data from 2/2019–7/2021; Earnest research “Impact of Stimulus Payments on Consumer Spending,” February 2021 1. Includes credit-card and some debit-card spending data among banked consumers; does not include spending that is difficult to track (e.g., at small businesses) and/or for channels where non-credit card forms of payment (cash, check, banks transfers, etc.) are common (healthcare, insurance, utilities, housing, etc). Year-over-year growth in monthly sales during current period (2/2020–8/2021) compared with monthly sales in prior period (2/2019–8/2020). 2. Year-over-year spend in Mar–Aug 2020 decreased by 8% compared with same period in previous year, whereas Sept–Feb remained flat compared with same period in previous year. 3. Re-forecasted Mar–Aug 2020 spend calculated by growing Feb–Aug 2020 spend by the same 1-month growth rate observed between Feb–Aug 2019. 4. Year-over-year change in spend for stimulus recipients versus those who did not receive stimulus payments. Stimulus payments and holiday-influenced recovery in the 6 months prior Those who received stimulus money in April/May and January showed a 15–20% uplift in spend.4 Early holiday shopping in October and Nov helped support positive growth in those months Spend is normalizing, with solid growth for March–August vs. re- forecasted spend had COVID-19 not occured3 Relative to March–August 2020 actual spend (start of pandemic in the US), spend is up 20% 10 −6 −18 −9 −6 −5 −3 1 2 1 −2 3 −4 4 5%5 5 7 6 6 Mar Mar Feb Apr Aug May Feb Sept June June July Oct July Nov Dec Jan Apr May Aug 20 40 27 25 22 20 1st round of stimulus 2nd round of stimulus Holiday pull- forward spend 3rd round of stimulus vs re- forecasted Aug 2020 spend had COVID-19 not occurred3 vs Aug 2020 actual spend Comparison to pre-COVID-19 months Comparison to COVID-affected months Mar–Aug 6 month YoY: –8%2 Sept–Feb 6 month YoY: 0%2 Year-over-year credit-card spend,1 %
- 11. McKinsey & Company 11 1. Wealthier consumers have driven robust rise in spending, while lower-income consumers pulled back spending starting in May 2021 Spending remains strong | Current as of August 2021 Source: Affinity credit card spend data for 2/2019–8/2021; spend samples cardholders and underrepresents highest- and lowest-income bands Year-over-year credit card spend by population subsegment,1 % −20 −30 −10 30 0 10 20 Apr Feb May Dec June Mar May July Aug Sept Oct Nov Jan Feb Mar Apr June July Aug Low ($0–35,000) Medium ($35,000–80,000) High (≥$80,000) Stimulus payment 4 Lower- income consumers 2 Medium- income consumers 4 Cumulative year- over-year change3 Higher- income consumers Year-over-year change, Aug 2021 vs Aug 2020 Change in spend,1 by income level, % 2020 2021 1. Re-forecasted Mar–Aug 2020 spend calculated by growing Feb–Aug 2020 spend by the same 1-month growth rate observed between Feb–Aug 2019. 2. Cumulative year-over-year change compares the sum of the data for Sept 2020–Aug 2021 with Sept 2019–Aug 2020, with re-forecasted numbers for Mar–Aug 2020. −9 11 2 > 5% < −5%
- 12. McKinsey & Company 12 1. Millennial consumers have driven a robust rise in spending Signs of spend recovery | Current as of August 2021 Source: Affinity credit card spend data from 2/2019–8/2021; spend samples cardholders and underrepresents highest- and lowest-income bands 30 0 −10 −30 10 −20 20 Oct Mar Nov Feb Mar Apr May Jun Jul Aug Sep Dec Jan Feb Apr May Jun Jul Aug 18–37 (millennials) 38–51 (Gen X) 52+ (baby boomers) 1. Re-forecasted Mar-Aug 2020 spend calculated by growing Feb–Aug 2020 spend by the same 1-month growth rate observed for Feb–Aug 2019. 2. Age brackets: baby boomers (52+), Gen X (38–51), millennials (18–37). Data for lower-income consumers (<$35,000) underrepresented across all generational groups. 3. Cumulative year-over-year change compares the sum of the data for Sept 2020–Aug 2021 with Sept 2019–Aug 2020, with re-forecasted numbers for Mar–Aug 2020. Year-over-year credit-card spend by population subsegment,1 % Stimulus payment -2 Baby boomers 11 Gen X 6 Cumulative year- over-year change3 Millennials Year-over-year change, Aug 2021 vs Aug 2020 Change in spend,1 by age group,2 % 2020 2021 1 15 9 > 5% < −5%
- 13. McKinsey & Company 13 Source: Affinity Solutions credit-card and debit-card spend data for 2/2019–8/2021; Facteus debit-card spend data for 2/2019–8/2021; Stackline Amazon spend data for 2/2019–8/2021 1. Includes the following retailer categories: Amazon, apparel, software and electronics, cosmetic stores, pet supplies, home stores, mass stores, club stores, restaurants, grocery stores, drugstores, discount stores. 2. Last twelve months. 2. Online penetration shifted upward with COVID-19’s onset and has remained ~30 percent above pre-COVID-19 levels Omnichannel is ascendant | Current as of August 2021 ~30% Increase in online penetration since Mar 2020, based on credit- card and debit- card spend Retail-oriented online credit-card and debit-card spend as % of total1 19 20 27 27 25 26 25 25 25 29 30 27 26 26 25 24 26 24 25 Oct Sept June LTM2 July Mar 2020 Apr May Aug 2021 Aug Nov Dec Jan Feb Mar Apr May June July ~+30%
- 14. McKinsey & Company 14 2. Brick and mortar grew steadily at 5 percent in spring, summer 2021; e-commerce continued growth above 30 percent Omnichannel is ascendant | Current as of August 2021 Retail channel, year-over-year growth in spend,1 2019–21, % 1. Includes credit-card and some debit-card spending data among banked consumers. While card spending represents only a part of overall consumer spending (such as housing, utilities, and other major categories excluded from credit-card spending), the changes in card data closely track changes in official consumption figures reported by the Bureau of Economic Analysis. This is because the share of unaffected categories in card spending is comparable with the share of categories not affected negatively by COVID-19 in overall consumption (which includes housing). Year-over-year growth in monthly sales during current period (Feb 2020–Aug 2021) compared with monthly sales in prior period (Feb 2019– Aug 2020). 2. Year-over-year growth for Mar–Aug 2021 relative to estimate of Mar–Aug 2020 had COVID not occurred. Re-forecasted Mar–Aug 2020 spend calculated by growing Feb–Aug 2020 spend by the same 1-month growth rate observed for Feb– Aug 2019. 3. Includes the following retail channels: Amazon brick and mortar; apparel, software and electronics, cosmetics, pet supplies; home stores; mass stores; club stores, restaurants, grocery stores, drugstores, discount stores, auto and cable/telecom (not shown separately), and experiences, including out-of-home entertainment and travel. 4. Includes the following retailer categories: Amazon; apparel, software and electronics, cosmetics. pet supplies. home stores. mass stores. club stores. restaurants. grocery stores. drugstores. and discount stores Source: Affinity Solutions credit-card spend data from 2/2019 – 8/2021; Stackline Amazon spend data, 2/2019–8/2021 Year-over-year sales growth, % −10 0 10 20 −20 −30 30 Total3 Brick- and- mortar sales3 E- commerce sales4 Year-over- year change, last 12 mos vs last 13–24 mos E-com- merce accele- ration Apr–May Early summer June–July Holiday Nov–Dec Early 2021 Jan–Feb Fall Aug–Oct May2 Early shelter in place Mar Pre- COVID-19 Feb 2020 Start of recovery2 Mar–Apr June- July2 −13 −5 0 −1 0 3 −6 10 5 5 7 7 −13 −3 −2 2 3 3 1 7 5 6 5 5 62 52 41 44 49 41 27 24 48 34 32 32 Aug2
- 15. McKinsey & Company 15 3. Digital penetration has remained strong across all channels Omnichannel is ascendant | Current as of August 2021 E-commerce as a % of total retail sales1,2 Source: Affinity credit card spend data for 2/2019–8/2021; Stackline Amazon spend data for 2/2019–8/2021 1. Year-over-year growth for Mar–Aug 2021 relative to estimate of Mar–Aug 2020 had COVID not occurred. Re-forecasted Mar–Aug 2020 spend calculated by growing Feb–Aug 2020 spend by the same 1-month growth rate observed for Feb– Aug 2019. 2. Excludes sales in automotive, beauty, grocery, home improvement, home and furniture, pet supplies, apparel and accessories, electronics, sports and outdoors, as these categories are embedded into subsequent rows. 3. Includes Amazon sales. 2021 (May-June) 25 12 1 67 20 8 34 62 10 37 76 45 11 (July) 24 11 1 66 20 7 33 61 9 36 74 43 10 Current (Aug) 25 12 1 69 22 8 35 63 9 36 73 44 10 Total e-commerce penetration by retailer category Mass Discount stores Cosmetics3 Drugstores & pharmacies3 Grocery stores3 Home3 Pet supplies3 Restaurants Retail apparel3 Software & electronics3 Sporting apparel3 Wholesale clubs Year-over-year growth 20 30 40 50+ 10 0 19 6 1 53 16 5 30 55 4 33 68 38 8 Pre- COVID-19 (Feb) 20 8 0 68 19 6 32 60 7 43 78 49 8 Early Shelter in Place (Mar) 27 12 0 90 21 7 36 67 10 67 89 66 11 E- commerce acceleration (Apr−May) 25 11 0 72 20 7 34 61 9 43 82 50 10 Early summer (June−July) 25 11 1 67 20 7 35 60 9 41 79 47 10 Fall (Aug-Oct) 25 11 1 70 20 7 36 61 8 44 80 50 10 Holiday (Nov-Dec) 27 13 1 70 21 8 38 63 11 45 79 50 11 Early 2021 (Jan-Feb) 26 12 1 70 20 9 35 63 10 39 77 46 11 Start of recovery (Mar-Apr) Essentials Discretionary
- 16. McKinsey & Company 16 2. The trajectory of e-commerce penetration has differed by category and retailer Omnichannel is ascendant | Current as of August 2021 Online sales as % of overall sales for credit-card and debit-card spend,1 by level of pre-COVID-19 penetration Source: Affinity Solutions credit-card and debit-card spend data for 2/2019–8/2021; Facteus debit-card spend data for 2/2019–8/2021; Stackline Amazon spend data, 2/2019–8/2021 46 83 53 Pre- COVID-19, last 12 months5 Apr 2020 spike Aug 2021 +15% 13 19 20 Apr 2020 spike Pre- COVID-19, last 12 months5 Aug 2021 +54% 5 9 10 Pre- COVID-19, last 12 months5 Apr 2020 spike Aug 2021 +100% High penetration2 (>20%) Moderate penetration3 (7–20%) Low penetration4 (<7%) Categories with lower pre-COVID-19 online penetration saw higher e-commerce growth in March and may be more likely to sustain online penetration rates seen during the pandemic Categories with already high online penetration saw a dramatic spike during April’s lockdowns 1. Re-forecasted Mar–Aug 2020 spend calculated by growing Feb–Aug 2020 spend by the same 1-month growth rate observed for Feb–Aug 2019. 2. High-online-penetration retail categories include those with >20% pre-COVID-19 internet penetration: apparel, software and electronics, cosmetics, pet supplies. 3. Medium-online-penetration retail categories include those with 7–20% pre-COVID-19 internet penetration: home stores, mass stores, club stores. 4. Low-online-penetration retail categories include those with <7% pre-COVID-19 internet penetration: restaurants, grocery stores, drugstores, discount stores. 5. Online penetration from Mar 2019 to Feb 2020.
- 17. McKinsey & Company 17 0 50 −10 10 20 30 40 60 70 80 90 100 110 Timeline YoY growth, % 2. Since April of this year, Amazon’s growth has decelerated but is still higher versus pre-COVID-19 period Omnichannel is ascendant | Current as of August 2021 Year-over-year (YoY) growth for Amazon sales, 2019–21, % Source: Stackline Amazon spend data, 1/2019–8/2021 Pre- COVID-19 (Jan–Feb) Early shelter in place (Mar) E- commerce acceleration (Apr–May) Early summer (June–July) Holiday (Nov–Dec) +16 +14 +43 +46 +36 2020 2021 Fall (Aug–Oct) +39 2021 (Jan–Feb) +31 Thanksgiving July 4th Christmas Labor Day Stimulus New Year’s Day Stimulus 2021 (Apr–May) +28 2021 (June–July) +19 2021 (Mar) +61 XX YoY growth in given period, % Prime day Prime Day lapping Negative growth rate due to delayed Prime Day (Originally in week 29 in 2019) No data for 2021 1st week Negative growth due to accelerated July 4 (week 27 in 2021 vs week 28 in 2020) 2021 (Aug) +10
- 18. McKinsey & Company 18 1. Q: Which best described how you have researched the following categories over the last 3 months? 2. Q: Think about the purchases you have made in the following categories over the past 3 months. For which of these was a post on social media something that inspired or influenced the particular brand? 34 32 30 25 25 24 21 21 21 20 18 17 17 16 15 16 14 14 60 61 64 63 62 69 64 65 67 59 64 69 65 67 69 60 71 64 6 7 6 12 13 7 15 14 12 21 18 14 18 17 16 24 15 22 Skin care and makeup Home improvement, gardening supplies Vitamins, supplements, OTC medicine Groceries Household supplies Personal-care products Pet food and supplies Fitness and wellness services Kitchen and dining Footwear Jewelry Home decoration and furniture Apparel Accessories Toys and baby supplies Books, magazines, newspapers Sports and outdoors equipment, supplies Consumer electronics Research and purchase only in store Omnichannel Research and purchase only online 2. Six or seven in ten consumers shop in an omnichannel way, with 40 percent citing social media as an influence in certain categories Omnichannel is ascendant | Current as of August 2021 Product searches by channel over the last 3 months,1 % of respondents Influenced by social media,2 % of respondents Source: McKinsey & Company COVID-19 US Consumer Pulse Survey 8/25–8/31/2021, n = 2,004, sampled and weighted to match the US general population 18+ years >35% 19 17 22 19 39 37 27 31 40 36 35 40 34 20 25 30 36 32
- 19. McKinsey & Company 19 54 65 80 30 35 45 48 84 55 46 88 50 40 52 60 56 58 76 64 66 70 72 68 5 70 74 78 82 50 86 0 10 15 20 25 Downloaded/used a new store or restaurant app Downloaded/used deal-finding plug-ins and price comparison apps/sites Curbside pickup from a restaurant Grocery delivery Restaurant food delivery Purchased pre-owned products online Self-checkout or scan-and-go at a physical store Purchased directly from social media Meal kit delivery Drive-thru line for a fast-food restaurant Curbside pickup for a store Buy online, pickup in store Paid more for delivery within 2 hr/1 hr Paid more for same-day delivery 1. User growth is calculated as % of respondents who replied that they are new users over % of respondents who replied that they were using the product/service pre-COVID-19 (using more, using the same or using less) on Q: Which best describes when you have done or used each of these items? 2. Q: Compared to now, will you do or use the following more, less, or not at all, once the coronavirus (COVID-19) ) crisis subsides (i.e., once there is herd immunity)? Possible answers: “will stop this”; ”will reduce this”; “will keep doing what I am doing now”; “will increase this.” Number indicates percent who chose “will keep doing what I am doing now” and “will increase this” among new or increased users. 2. Alternatives to in-store shopping accelerated during COVID-19; 50 to 70 percent of consumers intend to continue their use Omnichannel is ascendant | Current as of August 2021 Source: McKinsey & Company COVID-19 US Consumer Pulse Survey 8/25–8/31/2021, n = 2,004, sampled and weighted to match the US general population 18+ years Intent to use after COVID-192 % of new or increased users who intend to keep doing activity after COVID-19 User growth since COVID-19 1
- 20. McKinsey & Company 20 1. User growth is calculated as % of respondents who replied that they are new users over % of respondents who replied that they were using the product/service pre-COVID-19 (using more, using the same or using less) on Q: Which best describes when you have done or used each of these items? 2. Q: Compared to now, will you do or use the following more, less, or not at all, once the coronavirus (COVID-19) ) crisis subsides (i.e., once there is herd immunity)? Possible answers: “will stop this”; ”will reduce this”; “will keep doing what I am doing now”; “will increase this.” Number indicates respondents who chose “will keep doing what I am doing now” and “will increase this” among new or increased users. 2. Digital and remote acquisition of services (wellness, education, communications) also increased with strong intent to continue Omnichannel is ascendant | Current as of August 2021 Source: McKinsey & Company COVID-19 US Consumer Pulse Survey 8/25–8/31/2021, n = 2,004, sampled and weighted to match the US general population 18+ years 41 100 73 57 78 86 40 140 81 76 50 64 58 42 0 53 43 44 62 45 46 47 48 49 84 82 50 51 52 88 54 55 74 56 59 0 60 61 68 63 65 66 70 67 87 69 71 72 75 79 77 80 83 85 Wellness app TikTok Remote learning for kids Online fitness Playing online games Watching e-sports Personal care, grooming at home Video conferencing: Professional use Virtual hangouts and video chats Digital exercise machine Telemedicine: Mental health Remote learning for myself Telemedicine: Physical health Intent to use after COVID-192 % of new or increased users who intend to keep doing activity after COVID-19 User growth since COVID-19 1
- 21. McKinsey & Company 21 3. Channel and category performance has evolved into five distinct performance types over the course of the pandemic Disparate category recovery | Current as of August 2021 Early pandemic May–July 2020 Later 2020 Aug–Dec YTD 2021 Jan–Aug Description A Robust year-over-year growth throughout, due to larger consumer shifts (e.g., homebody economy) Sustained elevation B Fast rise in early days of COVID-19, with growth subsiding over time Normalizing growth C Steady demand, not affected by COVID-19 Unaffected D Significant declines at the outset of COVID-19, with quicker recovery Approaching recovery E Larger decline (−50% or more year over year), with slower path to recovery / Larger decline Categories/channels Software and electronics Home Pet supplies Sporting apparel Cosmetics Grocery stores Discount stores Mass stores Wholesale clubs Drugstores and pharmacies Telecom/cable Retail apparel Fuel and other auto Restaurants Out-of-home entertainment Travel
- 22. McKinsey & Company 22 3. Spending growth in most categories other than out-of-home entertainment and travel is now at or past pre-COVID levels Disparate category recovery | Current as of August 2021 Year-over-year (YoY) sales growth,1 % −15 0 15 30+ YoY growth, % −30 < −45 Source: Affinity credit card spend data for 2/2019–8/2021; Stackline Amazon spend data for 2/2019–8/2021 Sustained elevation Normalizing growth Approaching recovery Larger decline Unaffected Software and electronics3 Home3 Pet supplies3 Sporting apparel3 Restaurants Auto Retail apparel3 Out-of-home entertainment Travel Total Discount stores Wholesale clubs Mass (Target, Walmart) Drugstores, pharmacies3 Cosmetics3 Grocery stores3 Telecom/cable 1 Excludes sales in automotive, beauty, grocery, home improvement, home and furniture, pet supplies, apparel and accessories, electronics, sports and outdoors, as these categories are embedded into subsequent rows. 2 YoY growth for Mar–Aug 2021 relative to estimate of Mar–Aug 2020 had COVID not occurred. Re-forecasted Mar–Aug 2020 spend calculated by growing Feb–Aug 2020 spend by the same 1-month growth rate observed for Feb– Aug 2019. 3 Includes Amazon sales. 13 15 15 6 9 10 5 30 5 10 4 15 10 7 14 9 7 Pre- COVID-19 Feb 2020 9 2 24 −14 −24 −21 −43 −52 −46 −6 18 20 15 22 −9 36 −4 Early shelter in place, Mar 28 35 21 27 −1 −16 −9 −78 −49 0 13 13 8 10 8 10 1 Fall Aug–Oct 29 24 18 −6 −26 −41 −53 −79 −72 −13 9 0 9 2 1 15 2 E- commerce acceleration Apr–May 23 28 19 25 −10 −22 −15 −79 56 −5 9 9 3 9 9 9 0 Early summer June–July 26 34 24 36 3 −3 3 −62 −28 4 31 13 7 4 30 5 2 Mar–Apr adjusted2 20 28 6 22 11 16 7 8 −6 −18 −12 5 −78 9 −48 0 2 Holiday Nov–Dec 25 21 22 36 5 −1 7 −28 −12 6 10 12 7 7 25 6 −1 May–June adjusted2 7 13 24 33 8 3 8 −23 −6 6 15 14 6 8 30 7 1 July adjusted2 22 30 22 21 −2 −8 −5 −75 −48 −1 13 12 10 1 14 9 2 2021 Jan–Feb 17 16 27 28 6 4 4 −28 −11 6 15 16 5 18 23 8 0 Aug adjusted2
- 23. McKinsey & Company 23 3. Spending growth year over year in most categories has been driven primarily by higher-income consumers Retail category, year-over-year growth in spend, Aug 2021 vs Aug 2020,1 % −5 0 15 30+ −15 < −30 Source: Affinity credit card spend data for 1/2019–8/2021; Stackline Amazon spend data for 1/2019–8/2021. Spend samples cardholders and underrepresents highest- and lowest-income bands 1. Re-forecasted Aug 2020 spend calculated by growing July 2020 spend by the same 1-month growth rate observed between July–Aug 2019. 2. Includes Amazon sales. Total Software and electronics stores2 Home2 Discount stores Wholesale clubs Grocery stores2 Sporting apparel2 Restaurants Auto parts and accessories and fuel Retail apparel2 Cosmetics2 Out-of-home entertainment (eg, theaters, amusement parks) Pet supplies2 Drugstores and pharmacies2 Telecom/cable service providers Travel (airlines, car rentals, hotels, cruises) Mass (Target and Walmart) 11 −9 0 0 −4 −1 −13 −11 −12 −10 24 −40 9 −1 −15 −18 −10 21 2 15 12 12 10 3 1 −2 −3 25 −34 23 14 −4 −10 0 30 11 23 19 23 18 15 8 6 −5 29 −26 33 21 7 −7 10 Low (<$35,000) Medium ($35,000–80,000) High (>$80,000) Change in spend, by annual income level Disparate category recovery | Current as of August 2021
- 24. McKinsey & Company 24 3. Spending growth year over year in most categories has been driven primarily by millennials Retail category, year-over-year growth in spend, Aug 2021 vs Aug 2020,1 % −5 0 15 30+ −15 < −30 Source: Affinity credit card spend data for 1/2019–8/2021; Stackline Amazon spend data for 1/2019–8/2021; spend samples cardholders and underrepresents highest- and lowest-income bands 1. Re-forecasted Aug 2020 spend calculated by growing Jul 2020 spend by the same 1-month growth rate observed between Jul–Aug 2019. 2. Includes Amazon sales. Total Software and electronics2 Home2 Discount stores Wholesale clubs Grocery stores2 Sporting apparel2 Restaurants Auto parts and accessories and fuel Retail apparel2 Cosmetics2 Out-of-home entertainment (eg, theaters, amusement parks) Pet supplies2 Drugstores and pharmacies2 Telecom/cable service providers Travel (airlines, car rentals, hotels, cruises) Mass (Target, Walmart) 42 15 26 27 15 30 16 10 6 16 17 −24 37 31 1 8 15 18–37 (millennials) 28 9 25 21 10 20 7 −8 4 4 23 −31 29 26 0 1 5 38–51 (Gen X) 16 1 12 9 6 9 6 −3 −2 −7 19 −39 20 11 1 −19 −2 52+ (baby boomers) Change in spend, by generation Disparate category recovery | Current as of August 2021
- 25. McKinsey & Company 25 3. Sustained elevation: Some categories see continued increased demand, with deceleration among lower-income consumers Disparate category recovery | Current as of August 2021 Source: Affinity Solutions credit-card spend data for 2/2019–8/2021; Stackline Amazon spend data for 2/2019–8/2021 Year-over-year credit-card spend by income segment,1 % 1. Mar–Jul figure is based on re-forecasted Mar–Aug 2020 spend to estimate Mar−Aug 2020 spend without COVID-19. Calculated by growing Feb−Aug 2020 spend by the same 1-month growth rate observed for Mar−Aug 2019. Note that not all panelists have income identified, so the stratified income view does not always match the total view. Home 80 40 0 −40 −20 20 60 Aug July Feb Feb Mar Apr Jan May June Aug June Sept Oct Nov Dec May Mar Apr July Sporting apparel 60 −40 −20 0 80 20 40 Feb Jan Feb Aug Mar Apr May June July Aug Sept Oct Nov Dec Mar July Apr May June Software and electronics 20 −40 40 −20 60 0 80 Feb Oct May Feb Mar Apr May June Apr July Aug Sept Nov Dec Jan Mar June July Aug 40 20 −40 0 −20 80 60 Dec Sept Mar Feb Apr May Oct June July Aug June Nov Jan Feb Mar Apr May July Aug Pet supplies $0–35,000 $35,001–80,000 $80,001+
- 26. McKinsey & Company 26 3. Normalizing growth: As initial surge has subsided, spend among higher-income consumers is starting to outpace others Disparate category recovery | Current as of August 2021 10 −20 20 −10 0 40 30 Mar June Feb Apr May June July Aug July Sept Oct Nov Dec Jan Feb Mar Apr May Aug 30 −20 20 −10 40 0 10 Feb Mar Feb Apr Apr May June July Aug Sept Oct Nov Dec Jan Mar May June July Aug Discount and dollar stores 1. Mar–July figure is based on re-forecasted Mar–Aug 2020 spend to estimate Mar–Aug 2020 spend without COVID-19. Calculated by growing Feb–Aug 2020 spend by the same 1-month growth rate observed for Mar–Aug 2019. Note that not all panelists have income identified, so the stratified income view does not always match the total view. 2. Mass stores include Target and Walmart. 10 10 −20 0 30 20 40 July Apr Oct Jan Feb Nov Mar Apr May May June Aug Sept July Dec Feb Mar June Aug Wholesale clubs Mass stores2 −20 −10 30 0 10 40 20 Dec Feb Nov Mar Apr May June July Aug Sept June Oct Jan Feb Mar Apr May July Aug Grocery −10 −20 0 10 20 30 40 Feb Aug Aug Mar Apr Dec May June July Sept Oct Nov Jan Feb Mar Apr May June July Drugstores and pharmacies $80,001+ $0–35,000 $35,001–80,000 Year-over-year credit-card spend by income segment,1 % Source: Affinity Solutions credit-card spend data for 2/2019–8/2021; Stackline Amazon spend data for 2/2019–8/2021
- 27. McKinsey & Company 27 3. Approaching recovery: After initial steep declines, some categories have seen recovery as consumers increase in-person spend Disparate category recovery | Current as of August 2021 1. Mar–Jul figure is based on re-forecasted Mar–Aug 2020 spend to estimate Mar–Aug 2020 spend without COVID-19. Calculated by growing Feb–Aug 2020 spend by the same 1-month growth rate observed between Feb–Aug 2019. Note that not all panelists have income identified, so the stratified income view does not always match the total view −60 0 −100 −20 −80 −40 20 Sept Mar Mar Feb Nov Feb Apr May June July Aug Oct Dec Jan Apr May June July Aug 0 −50 200 50 100 150 Mar Mar Feb Apr Sept May June July Aug Aug Oct Nov Dec Jan Feb Apr June May July Online purchase Quick-service restaurants On-site 0 −100 −80 −60 −40 −20 20 May Feb Feb Aug Mar Apr May July June Aug Sept Oct Nov Dec Jan Mar Apr June July 50 150 −50 0 100 200 June Apr May Mar Feb Feb Apr June July Aug Sept July Oct Nov Dec Jan Mar May Aug Online purchase $0–35,000 $35,001–80,000 $80,001+ Retail apparel In-store Year-over-year credit-card spend by income segment,1 % Source: Affinity Solutions credit-card spend data for 2/2019–8/2021; Stackline Amazon spend data for 2/2019–8/2021
- 28. McKinsey & Company 28 Year-over-year credit-card spend by income segment,1 % −70 −90 30 −80 −40 20 −50 −60 −30 −20 −10 0 10 40 Feb Apr Apr May Jan Aug Feb Mar May June Aug Oct Sept Nov Dec Mar June July July 3. Larger declines: while travel and out-of-home categories started to recover, levels declined again with the onset of the Delta variant Disparate category recovery | Current as of August 2021 Source: Affinity Solutions credit-card spend data for 2/2019–8/2021; Stackline Amazon spend data for 2/2019–8/2021 −30 −90 30 −70 −80 −60 −40 40 −20 −10 0 10 −50 20 Aug Jan Apr Feb Mar May June July Sept July Oct Nov Dec Feb Aug Mar Apr June May $0–35,000 $35,001–80,000 >$80,000 1. Mar–June figure is based on re-forecasted Mar–Aug 2020 spend to estimate Mar–Aug 2020 spend without COVID-19. Calculated by growing Feb–May 2020 spend by the same 1-month growth rate observed for Feb–May 2019. Note that not all panelists have income identified, so the stratified income view does not always match the total view. Travel Out-of-home entertainment
- 29. McKinsey & Company 29 4. Even with the Delta variant present, in August almost half of US consumers say they are engaging in ‘normal’ out-of-home activities Out-of-home/homebody economy | Current as of August 2021 Consumers engaging in ‘normal’ out-of-home activities,1 % of respondents 48 33 36 36 27 20 June 2020 Nov 2020 Feb 2021 Aug 2021 Sept 2020 May 2020 Overall 44 Vaccinated 50 Unvaccinated Gen Z 52 45 Millennials Baby boomers3 Gen X 48 45 48 Low (<$50,000) Medium ($50,000–100,000) High (>$100,000) 49 45 1. Q: Which best describes when you will regularly return to stores, restaurants, and other out-of-home activities? Chart shows those already participating in these activities. 2. Gen Z are people under 25 years old, millennials are 25–44 years old, Gen X are people 45–54 years old, baby boomers are 55 years old and above. 3. Baby boomers include Traditional or Silent Generation. Source: McKinsey & Company COVID-19 US Consumer Pulse Survey 8/25–8/31/2021, n = 2,004; 2/18–2/22/2021, n = 2,076; 11/9–11/13/2020, n = 2,024; 9/18–9/24/2020, n = 1,026; 6/15–6/21/2020, n = 2,006; 5/18–5/24/2020, n = 1,975; sampled and weighted to match the US general population 18+ years By generation2 By vaccination adoption By income ~52% of baby boomers are doing out-of-home activities ~49% of lower income households are doing out-of-home activities ~50% of people that are unvaccinated are doing out-of-home activities
- 30. McKinsey & Company 30 4. Consumers increased all out-of-home activity since February; social activities, indoor dining, and fitness increased most Out-of-home/homebody economy | Current as of August 2021 Out-of-home activities done in the past 2 weeks1 % of respondents Source: McKinsey & Company COVID-19 US Consumer Pulse Survey 8/25–8/31/2021, n = 2,004; 2/18–2/22/2021, n = 2,076, sampled and weighted to match the US general population 18+ years 1. Q: Did you leave your house for the following activities over the past 2 weeks? Social Personal care Entertain- ment 54 26 21 23 33 33 48 55 48 Attend an outdoor event Go out for family entertainment Dine indoors at a restaurant or bar Attend an indoor cultural event Go to a hair or nail salon Get together with family Visit a crowded outdoor public place Go to the gym or fitness studio Get together with friends 61 89 75 38 32 38 34 19 27 22 24 Work outside my home Use public transportation Shop for groceries/necessities Shop for nonnecessities Go to a shopping mall Travel more than 2 hr by car Travel by airplane Use a ride-sharing service Travel by train Stay in a hotel Rent a short-term home Work Shopping Transport/ travel 11 16 8 13 12 6 8 5 9 10 9 14 12 13 19 18 9 18 20 18 Change from Feb 2021, percentage points Change from Feb 2021, percentage points 50%+ <50% Change >10 pp
- 31. McKinsey & Company 31 1. Q: With the rise of the Delta variant of COVID-19, how, if at all, has your out-of-home behavior changed? Source: McKinsey & Company COVID-19 Consumer Pulse Surveys, conducted in the US on 8/25–8/31/2021; n = 2,004, sampled and weighted to match the US general population 18+ years 22 5 39 25 30 6 16 Low (<$50,000) 36 37 Medium ($50,000– 100,000) 39 6 39 High (>$100,000) 4. Roughly 70 percent of consumers have changed the way they engage in out-of-home activities because of the Delta variant Out-of-home/homebody economy | Current as of August 2021 Adjustments to out-of-home behavior due to prevalence of Delta variant,1 % of respondents 5 41 36 27 37 18 Vaccinated 30 6 Unvaccinated Engage less 39 Engage same as before Delta 34 Overall 21 6 Engage with adjusted behavior Engage more By income By vaccination status Higher-income consumers are more cautious when going out A third of unvaccinated consumers have not reduced or changed their out-of-home behavior despite the Delta variant Key findings
- 32. McKinsey & Company 32 4. Depending on the category, about 60 to 75 percent of consumers have modified their behavior when out of home Out-of-home/homebody economy | Current as of August 2021 Out-of-home activities engagement,1 % of respondents Source: McKinsey & Company COVID-19 US Consumer Pulse Survey 8/25–8/31/2021, n = 2,004, sampled and weighted to match the US general population 18+ years 1. Q: Which best describes how you are engaging in each of these activities? Possible answers: “Not doing this at all”; “Doing this in the same way as pre-COVID-19, but less often”; “Doing this in a modified way vs. pre-COVID-19”; “Doing this just as much and in the same way as I did pre-COVID-19.” Net intent is calculated from adding % of respondents stating they will do more or about the same and subtracting % of respondents stating they will do less or not at all. Work Shopping Transport/ Travel Social Personal care Entertain- ment 75 75 75 71 70 72 71 71 71 25 25 25 29 30 28 29 29 28 Attend an indoor cultural event Dine indoors at a restaurant or bar Visit a crowded outdoor public place Go out for family entertainment Go to a hair or nail salon Attend an outdoor event Go to the gym or fitness studio Get together with family Get together with friends 57 66 68 77 69 73 74 77 74 71 74 43 34 32 23 31 27 26 23 26 29 26 Go to a shopping mall Work outside my home Use a ride-sharing service Stay in a hotel Shop for groceries/necessities Travel more than 2 hr by car Shop for nonnecessities Use public transportation Travel by airplane Travel by train Rent a short-term home Doing less or in a modified way Doing as much as and in the same way as pre-COVID-19
- 33. McKinsey & Company 33 4. Even though consumers have increased out-of-home activity, they are still investing in their home environment due to COVID-19 Out-of-home/homebody economy | Current as of August 2021 Main life events done in the last 12 months as a result of COVID,1 % of respondents 1. Q: Which of the following have you done in the last 12 months as a result of the COVID-19 crisis? 2. Total percentage of people who choose option(s) in the category. 3. Not asked in Feb 2021 survey. Source: McKinsey & Company COVID-19 US Consumer Pulse Survey 8/25–8/31/2021, n = 2,004; 2/18–2/22/2021, n = 2,076, sampled and weighted to match the US general population 18+ years Change >3 pp Worked more from home Set up a specific work-from-home space Decided to change jobs Moved into a bigger home Started homeschooling children3 Set up a gym at home Renovated/remodeled my home Moved into a smaller home Got a new pet at home (eg, dog, cat) Bought a property Sold a property 28 11 8 15 15 14 15 6 5 6 4 Work/study change Aug 2021 Pet adoption House move Home renovation Investments/ divestments Total2 Change from Feb 2021, percentage points 2 2 1 2 5 −1 0 1 4 4 N/A 15 37 10 33 8
- 34. McKinsey & Company 34 4. Both C-suite executives and employees believe that remote work will increase post-pandemic Out-of-home/homebody economy | Current as of May 2021 Source: McKinsey CxO Survey on Return to Workplace, May 2021; McKinsey Reimagine Work: Employee Survey, January 2021 92 52 8 36 12 Pre-pandemic Post-pandemic 62 37 30 52 8 11 Pre-pandemic Post-pandemic ≤2 days ≥4 days 3 days Average share of workdays in office reported before and expected after COVID-19 pandemic % of C-suite respondents1 1. Based on responses from 504 C-suite executives. 2. Based on responses from 5,043 employees globally. Working model before COVID-19 pandemic and desired working model after COVID-19 pandemic % of employee respondents2 Hybrid Fully remote Fully on site
- 35. McKinsey & Company 35 75 39 39 34 30 29 Private label/store brand Different brand Any new shopping behavior New shopping method3 Different retailer/store/website New digital shopping method3 5. Consumer behavior change has been more extensive among younger and higher-income consumers Loyalty shake-up | Current as of August 2021 Behaviors since COVID-19 started1 % of respondents Source: McKinsey & Company COVID-19 US Consumer Pulse Survey 8/25–8/31/2021, n = 2,004; 2/18–2/22/2021, n = 2,076, sampled and weighted to match the US general population 18+ years 1. Q: Since the coronavirus (COVID-19) crisis started, which of the following have you done? 25% consumers selected “none of these.” 2. Q: Which best describes whether or not you plan to continue with these shopping changes once the coronavirus (COVID-19) crisis has subsided (i.e., once there is herd immunity)? Possible answers: “will go back to what I did before coronavirus”; ”will keep doing both this and what I did before coronavirus”; ”will keep doing this and NOT go back to what I did before coronavirus.” Intent to continue includes respondents who selected “will keep doing both this and what I did before coronavirus” and “will keep doing this and NOT go back to what I did before coronavirus.” 3. “New shopping method” includes curbside pickup and delivery apps. % of respondents Change from Feb 2021, percentage points 84 5 82 4 84 3 83 2 High (>$100,000/year) Gen Z Millennials 85 90 88 46 81 5 48 49 43 44 44 42 46 46 34 26 35 44 38 46 Income cut Generational cut All consumers Between −3 and +3 < −3 Difference from all consumers percentage points > +3 Intent to continue behavior2
- 36. McKinsey & Company 36 5. Value was a primary reason for brand switch among all; access came next for older consumers and purpose for younger consumers Loyalty shake-up | Current as of August 2021 Reason for trying a new brand since COVID-19 began1 % of respondents selecting reason in top 3 1. Q: You mentioned you tried a new/different brand than what you normally buy. What were the main reasons that drove this decision? Select up to 3 relevant reasons. “Brand” includes different brand and new private label or store brand. Overarching reason based on % of individual respondents responding to at least 1 reason in the group. 2. Baby boomers include Traditionalists or Silent Generation. Source: McKinsey & Company COVID-19 US Consumer Pulse Survey 8/25–8/31/2021, n = 2,004; 2/18–2/22/2021, n = 2,076, sampled and weighted to match the US general population 18+ years x Net % of respondents per category Supporting local businesses Better prices/promotions 9 Better quality Products are in-stock 10 Better shipping/delivery cost 32 Larger package sizes Is more sustainable, better for the environment Shares my values Wanted to treat myself The company treats its employees well Is natural or organic 7 Wanted to try a new brand I found Better value Wanted to try a type of product I’ve never tried before Wanted variety/change from my normal routine Is available where I’m shopping (ie, in store or online) Is cleaner or safer 30 9 10 30 11 6 6 17 15 13 14 20 11 Novelty Personal choice Purpose-driven Quality/organic Convenience Health/hygiene Availability 30 Value 60 26 25 26 20 9 22 Baby boomers2 Gen Z/ millennials Gen X 22 43 27 26 38 35 12 3 10 11 7 10 20 42 29 9 12 13 14 4 4 10 5 4 10 1 6 24 7 17 20 4 7 14 13 18 11 14 14 19 9 11 12 9 9 14 25 24 12 6 9 Between −3 and +3 < −3 > +3 All consumers Difference from all consumers, percentage points