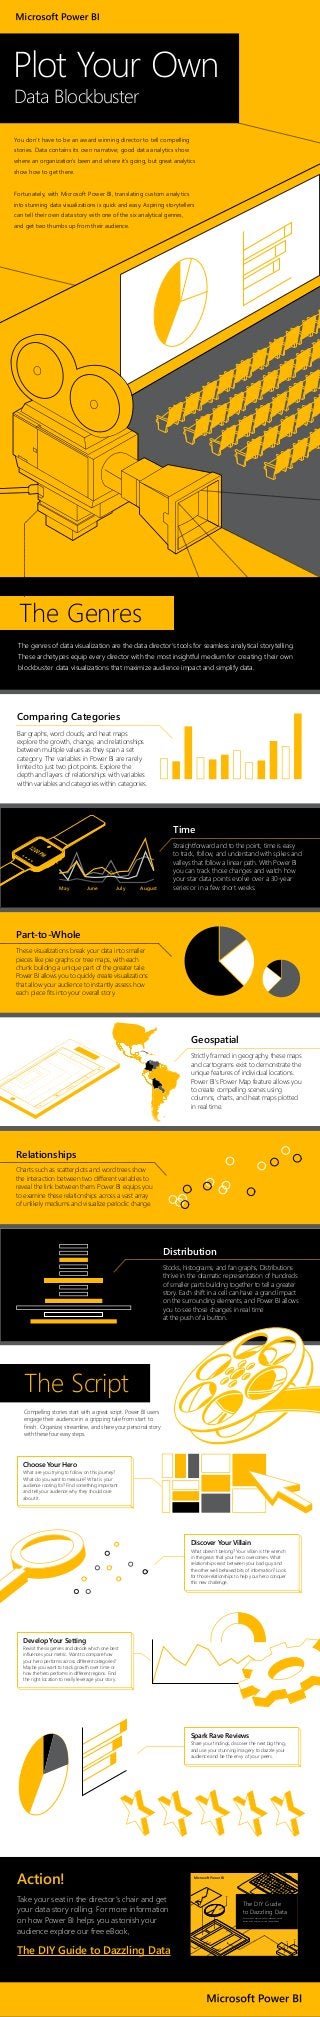
Plot Your Own Data Blockbuster
•
1 j'aime•5,408 vues

You don't have to be an award winning director to tell stories.
Recommandé

Recommandé
Contenu connexe
En vedette
En vedette (8)
Plus de Microsoft
Plus de Microsoft (20)
Dernier
Dernier (20)
Plot Your Own Data Blockbuster
- 1. The Script Compelling stories start with a great script. Power BI users engage their audience in a gripping tale from start to finish. Organize, streamline, and share your personal story with these four easy steps. Develop Your Setting Revisit the six genres and decide which one best influences your metric. Want to compare how your hero performs across different categories? Maybe you want to track growth over time or how the hero performs in different regions. Find the right location to really leverage your story. Choose Your Hero What are you trying to follow on this journey? What do you want to measure? What is your audience rooting for? Find something important and tell your audience why they should care about it. Discover Your Villain What doesn’t belong? Your villain is the wrench in the gears that your hero overcomes. What relationships exist between your bad guy and the other well behaved bits of information? Look for those relationships to help your hero conquer this new challenge. Spark Rave Reviews Share your findings, discover the next big thing, and use your stunning imagery to dazzle your audience and be the envy of your peers. The genres of data visualization are the data director’s tools for seamless analytical storytelling. These archetypes equip every director with the most insightful medium for creating their own blockbuster data visualizations that maximize audience impact and simplify data. The Genres Distribution Stocks, histograms, and fan graphs, Distributions thrive in the dramatic representation of hundreds of smaller parts building together to tell a greater story. Each shift in a cell can have a grand impact on the surrounding elements, and Power BI allows you to see those changes in real time at the push of a button. Relationships Charts such as scatterplots and word trees show the interaction between two different variables to reveal the link between them. Power BI equips you to examine these relationships across a vast array of unlikely mediums and visualize periodic change. Geospatial Strictly framed in geography, these maps and cartograms exist to demonstrate the unique features of individual locations. Power BI’s Power Map feature allows you to create compelling scenes using columns, charts, and heat maps plotted in real time. Part-to-Whole These visualizations break your data into smaller pieces like pie graphs or tree maps, with each chunk building a unique part of the greater tale. Power BI allows you to quickly create visualizations that allow your audience to instantly assess how each piece fits into your overall story. Time Straightforward and to the point, time is easy to track, follow, and understand with spikes and valleys that follow a linear path. With Power BI you can track those changes and watch how your star data points evolve over a 30-year series or in a few short weeks. Comparing Categories Bar graphs, word clouds, and heat maps explore the growth, change, and relationships between multiple values as they span a set category. The variables in Power BI are rarely limited to just two plot points. Explore the depth and layers of relationships with variables within variables and categories within categories. Data Blockbuster Plot Your Own May June July August You don’t have to be an award winning director to tell compelling stories. Data contains its own narrative; good data analytics show where an organization’s been and where it’s going, but great analytics show how to get there. Fortunately, with Microsoft Power BI, translating custom analytics into stunning data visualizations is quick and easy. Aspiring storytellers can tell their own data story with one of the six analytical genres, and get two thumbs up from their audience. Action! Take your seat in the director’s chair and get your data story rolling. For more information on how Power BI helps you astonish your audience explore our free eBook, The DIY Guide to Dazzling Data ��� �� � � � � � � �� � The DIY Guide to Dazzling Data It’s never been easier to delight colleagues, dazzle bosses, and boost your value in the workplace.