
Recommended
Recommended
More Related Content
Similar to Water-Digest-Magazine-XVI-VI-Issue-Article.pdf
Similar to Water-Digest-Magazine-XVI-VI-Issue-Article.pdf (20)
Recently uploaded
Recently uploaded (20)
Water-Digest-Magazine-XVI-VI-Issue-Article.pdf
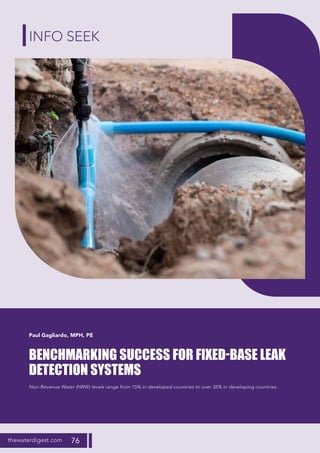
- 1. thewaterdigest.com 76 BENCHMARKING SUCCESS FOR FIXED-BASE LEAK DETECTION SYSTEMS Non-Revenue Water (NRW) levels range from 15% in developed countries to over 35% in developing countries. Paul Gagliardo, MPH, PE INFO SEEK
- 2. thewaterdigest.com 77 INFO SEEK BENCHMARKING SUCCESS FOR FIXED-BASE LEAK DETECTION SYSTEMS T he Energy and Water Department (EWD) of the World Bank published a report in 2006 titled “The Challenge of Reducing Non-Revenue Water (NRW) in Developing Countries”. In it, they conservatively estimate that non-revenue water levels range from 15% in developed countries to over 35% in developing countries. See Table 1. Non-Revenue Water is the difference between the volume of water put into a water distribution system and the volume that is billed to customers. NRW comprises two main components: real and apparent losses. Real water loss is actual leakage from pipelines and storage tanks. Apparent water losses are caused by customer meter under registration, data-handling errors, and theft of water in various forms. As can be seen from Table 1, real water losses are more of a concern in developed countries and apparent water losses are more of a contributor in developing countries. There are many reasons for utilities to reduce NRW in addition to managing a dwindling critical resource. It provides improved water service and customer satisfaction. It decreases energy needs for treatment and pumping, saving money and reducing the generation of GHG’s (Greenhouse Gas). It increases operational revenues, thus allowing for lower pricing of the commodity. Leaking water pipes are ubiquitous and increasing as the age of the underground linear assets increase. There are a number of techniques that utilities can use to detect leaks before they surface and can be repaired without causing catastrophic damage. They range from all OPEX (Operating Expenditure) to majority CAPEX (Capital Expenditure). Many utilities employ a traditional Boots-On-The-Ground (BOTG), point to point, leak detection program. This survey occurs with field crews only using specialised acoustic monitoring equipment to detect leaks by listening at specific points along the pipeline route. It is all OPEX. Some utilities use a pre-location methodology to direct the BOTG to likely leak locations so that the time spent in the field is more effective and efficient. The pre-location can be a remote sensing technique or using advanced, machine- learning algorithms. Field crews are still needed to pinpoint the leaks but labour is reduced. Another method is to use some type of in-situ monitoring of the pipeline to locate leaks. This tends to be a service provider business model and can be placed on the Operating or Capital budget ledger. Fixed-base equipment can be used in two ways; lift and shift or permanent installation. Fixed base sensors such as hydrophones or accelerometers are installed on the pipeline either above or below ground. The lift and shift method reduces CAPEX because the number of sensors is reduced; only a small portion of the system is covered at any one time. The equipment is placed and collects information for a period of time to detect ongoing leaks. The equipment is then moved to the next location and the process is repeated. When the equipment is permanently installed it remains in place and collects data over long periods of time and can detect existing and new leaks. This is the most capital-intensive type program, but can yield the best results. Aquarius Spectrum deploys a fixed-base leak detection solution that has all the necessary components to make it stand out in the field. The attributes that make them unique include: • A full suite of sensors, hydrophones, and accelerometers, which use propriety knowledge and are patented. • The sensors are very sensitive so they can be installed further apart in systems thus reducing costs. • The data is collected continuously and used to train the algorithm to increase leak alert efficacy. • Alert signals are continuously monitored to see if they are getting worse. Leaks can be pinpointed based on alert signal strength, duration and change. • All data is recorded and is given a unique ID so they can be tracked from initial identification to repair. Table 1: Estimates of Worldwide NRW Volumes Non Revenue Water % Real Water Loss Apparent Water Loss Developed Countries 15 80% 20% Eurasia 30 70% 30% Developing Countries 35 60% 40% Years to Reach Parity 16 Years 13 Years 50 Years
- 3. thewaterdigest.com 78 INFO SEEK BENCHMARKING SUCCESS FOR FIXED-BASE LEAK DETECTION SYSTEMS • The algorithm can detect and differentiate multiple leaks between two sensor points. • An analytic team is employed to monitor all the systems on a regular basis and assist customers in using the knowledge. The last bullet point given above may be one of the most important success factors for a fixed base system. Figure 1 shows a dashboard that is continuously monitored by in-house analytical staff and analysed for new alerts and trends. The colour coding and mapping of the alerts assists in the prioritising of field activities based on probability and intensity analyses. A bi-weekly briefing is held to review trends and provide insight to the operator, along with consequence of failure analysis, to schedule investigation and leak repair work. But it all comes down to performance and how to accurately measure that performance. The concept of benchmarking is one in which a standard can be developed so that operational performance of an alternative technique can be compared. The standard metric must be some defined feature of the ecosystem that is commonly accepted as a valid performance measure. In addition, an ultimate goal can be established so there is a maximum performance to gauge against. For fixed base systems that are permanently installed for an extended period of time the ultimate goal would be to identify all leaks within the portion of the pipeline monitored by the sensors. Therefore, one benchmark would be the number of leaks per pipe section. This is difficult to estimate accurately because leaks are not uniformly distributed in potable water systems. One section of pipe may experience very few leaks and one may experience many leaks. An average number of leaks per pipe section length can be estimated based on average size of leaks and real water loss levels, but no definitive work has been performed and published in the area. A second benchmark that could be used is non-revenue water reduction. When a leak monitoring system is installed for an extended period of time and the utility repairs the leaks it identifies, the NRW should be reduced. A third metric is to compare pipe burst rates per length of pipe to some standard. It is easy for utilities to collect data on surfacing pipe bursts. A 2018 study published by Utah State University, “Water Main Break Rates in the USA and Canada: A Comprehensive Study” reported that there is an average of 14 main breaks per 100 miles of pipe length (8.7 breaks per 100 km) per year. When a system identifies leaking pipes they are most likely to be non-visible and thus not surfacing. When these leaks are found and repaired pipe bursts should be reduced. Continuous monitoring
- 4. thewaterdigest.com 79 INFO SEEK BENCHMARKING SUCCESS FOR FIXED-BASE LEAK DETECTION SYSTEMS Table 2 shows results from the two case studies of deployments. These are systems where the solution was operating over multiple years. The results show that NRW was reduced by between 18 and 20% within the service area where the solution was implemented. The number of leaks found in each example correlates to the length of pipeline monitored and time over which solution was operating. This documents a significant improvement against the NRW reduction performance metric that is of interest to utilities. When looking at the results from the Haighon Case Study in more detail it has been reported that they experienced between 9.8 and 8.7 pipe bursts per 100 km per year. See Figure 2. This compares very well to the data from the Utah State University study of 8.7 bursts per 100 km per year. Equipment was installed in year 3 of the time period shown in this figure. The rate of pipe bursts has generally declined since that time in accordance with finding and fixing non-surfacing leaks. This data reinforces the success of the fixed base leak detection system installed at this location. More work needs to be done to create viable performance metrics and benchmarks for fixed base leak detection systems. A clear requirement is for customers to collect performance data that includes: • Date of installation • System coverage • Demand profile • Water loss data • Leaks found and repaired Hagihon pipe burst rate Hagihon pipe burst rate Table 2: Case Study Results Non-Revenue Water (NRW) % Reduction NRW Leaks Found Suez New Jersey 20% 500 Hagihon - Jerusalem Water 18% 170 • Leaks defined by subtype • Percent non-surfacing leaks The more comprehensive the historical data collection the more accurate an evaluation of the efficacy of the leak detection intervention will be. This will allow the comparison of various equipment manufacturers to one standard so they can be compared from a technical efficacy and value proposition perspective. ABOUT THE AUTHOR Paul Gagliardo is an independent consultant assisting and advising innovative water sector startup companies. He has held leadership positions in the water and wastewater business for over 30 years at the city of San Diego, American Water and multi-national consulting companies. Paul has been a judge for the Imagine H2O Accelerator since its inception in 2009. He is a registered engineer in the state of California and has a Master’s Degree in Public Health. To know more about the author, kindly write to us at info@thewaterdigest.com