Toronto Real Estate Board's MARKET WATCH - JANUARY 2017
•
1 j'aime•122 vues

The Toronto Real Estate Board's monthly statistical analysis of all real estate transactions within the Toronto and area issued at the first of each month for the preceding month.

Recommandé
Recommandé
Contenu connexe
Tendances
Tendances (15)
Similaire à Toronto Real Estate Board's MARKET WATCH - JANUARY 2017
Similaire à Toronto Real Estate Board's MARKET WATCH - JANUARY 2017 (15)
Plus de Shawn Venasse
Plus de Shawn Venasse (20)
Dernier
Dernier (20)
Toronto Real Estate Board's MARKET WATCH - JANUARY 2017
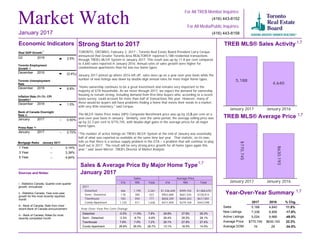
- 1. Toronto Employment Growth December 2016 (0.4%) Month January 2017 1 Year 3 Year 5 Year 3.14% 3.39% 4.64% January 2017 1 Year 3 Year 5 Year -- -- -- Market Watch For All TREB Member Inquiries: (416) 443-8158 For All Media/Public Inquiries: (416) 443-8152 Strong Start to 2017 TORONTO, ONTARIO, February 3, 2017 - Toronto Real Estate Board President Larry Cerqua announced that Greater Toronto Area REALTORS® reported 5,188 residential transactions through TREB's MLS® System in January 2017. This result was up by 11.8 per cent compared to 4,640 sales reported in January 2016. Annual rates of sales growth were higher for condominium apartments than for low-rise home types. January 2017 picked up where 2016 left off: sales were up on a year-over-year basis while the number of new listings was down by double-digit annual rates for most major home types. "Home ownership continues to be a great investment and remains very important to the majority of GTA households. As we move through 2017, we expect the demand for ownership housing to remain strong, including demand from first-time buyers who, according to a recent Ipsos survey, could account for more than half of transactions this year. However, many of these would-be buyers will have problems finding a home that meets their needs in a market with very little inventory," said Cerqua. The MLS® Home Price Index (HPI) Composite Benchmark price was up by 21.8 per cent on a year-over-year basis in January. Similarly, over the same period, the average selling price was up by 22.3 per cent to $770,745, with double-digit gains in the average prices for all major home types. “The number of active listings on TREB’s MLS® System at the end of January was essentially half of what was reported as available at the same time last year. That statistic, on its own, tells us that there is a serious supply problem in the GTA – a problem that will continue to play itself out in 2017. The result will be very strong price growth for all home types again this year,” said Jason Mercer, TREB’s Director of Market Analysis. TREB MLS® Sales Activity 5,188 4,640 January 2017 January 2016 TREB MLS® Average Price $770,745 $630,193 January 2017 January 2016 Year-Over-Year Summary 2017 2016 % Chg. Sales New Listings Active Listings Average Price Average DOM 5,188 4,640 11.8% 7,338 8,906 -17.6% 5,034 9,966 -49.5% $770,745 $630,193 22.3% 19 29 -34.5% Sources and Notes: i - Statistics Canada, Quarter-over-quarter growth, annualized ii - Statistics Canada, Year-over-year growth for the most recently reported month iii - Bank of Canada, Rate from most recent Bank of Canada announcement iv - Bank of Canada, Rates for most recently completed month Real GDP Growth Q3 2016 3.5% Toronto Unemployment Rate December 2016 6.8% Inflation Rate (Yr./Yr. CPI Growth) December 2016 1.5% Bank of Canada Overnight Rate January 2017 -- 0.50% Prime Rate January 2017 -- 2.70% Economic Indicators Metrics Sales Average Price 416 905 Total 416 905 Total 2017 Detached Semi - Detached Townhouse Condo Apartment 466 1,795 2,261 $1,336,640 $999,102 $1,068,670 118 305 423 $902,688 $661,545 $728,814 183 594 777 $658,349 $604,263 $617,001 1,125 511 1,636 $471,409 $379,169 $442,598 Sales & Average Price By Major Home Type January 2017 January 2017 i ii ii iii iv Detached Semi - Detached Townhouse Condo Apartment 26.8% 27.8% 26.3% 26.4% 28.5% 28.1% 26.1% 27.8% 27.4% 13.1% 18.5% 14.5% Detached Semi - Detached Townhouse Condo Apartment -5.5% 11.9% 7.8% -3.3% -6.7% -5.8% 7.6% 7.0% 7.2% 26.8% 26.5% 26.7% 1,7 1,7 1,7 1,7 Year-Over-Year Per Cent Change Mortgage Rates
- 2. Toronto Real Estate Board Market Watch, January 2017 SALES BY PRICE RANGE AND HOUSE TYPE JANUARY 2017 2 Price Range Detached Semi-Detached Att/Row/Twnhouse Condo Townhouse Condo Apt Link Co-op Apt Det Condo Co-ownership Apt Total $0 to $99,999 $100,000 to $199,999 $200,000 to $299,999 $300,000 to $399,999 $400,000 to $499,999 $500,000 to $599,999 $600,000 to $699,999 $700,000 to $799,999 $800,000 to $899,999 $900,000 to $999,999 $1,000,000 to $1,249,999 $1,250,000 to $1,499,999 $1,500,000 to $1,749,999 $1,750,000 to $1,999,999 $2,000,000+ 0 0 0 0 5 0 0 0 0 5 1 0 0 4 41 0 1 0 1 48 10 0 0 25 237 0 1 0 2 275 36 13 11 63 582 2 1 0 1 709 115 17 57 100 358 11 0 0 1 659 200 84 106 76 189 16 0 0 0 671 281 121 86 41 96 14 0 2 0 641 303 73 60 14 51 6 0 0 0 507 250 49 35 14 31 13 0 0 0 392 192 27 32 4 9 11 0 0 0 275 273 25 24 6 15 5 0 0 0 348 225 8 7 5 11 2 0 0 0 258 140 3 2 3 6 0 0 0 0 154 77 2 1 0 0 0 0 0 0 80 158 1 0 1 5 1 0 0 0 166 Price Range Detached Semi-Detached Att/Row/Twnhouse Condo Townhouse Condo Apt Link Co-op Apt Det Condo Co-ownership Apt Total $0 to $99,999 $100,000 to $199,999 $200,000 to $299,999 $300,000 to $399,999 $400,000 to $499,999 $500,000 to $599,999 $600,000 to $699,999 $700,000 to $799,999 $800,000 to $899,999 $900,000 to $999,999 $1,000,000 to $1,249,999 $1,250,000 to $1,499,999 $1,500,000 to $1,749,999 $1,750,000 to $1,999,999 $2,000,000+ 0 0 0 0 5 0 0 0 0 5 1 0 0 4 41 0 1 0 1 48 10 0 0 25 237 0 1 0 2 275 36 13 11 63 582 2 1 0 1 709 115 17 57 100 358 11 0 0 1 659 200 84 106 76 189 16 0 0 0 671 281 121 86 41 96 14 0 2 0 641 303 73 60 14 51 6 0 0 0 507 250 49 35 14 31 13 0 0 0 392 192 27 32 4 9 11 0 0 0 275 273 25 24 6 15 5 0 0 0 348 225 8 7 5 11 2 0 0 0 258 140 3 2 3 6 0 0 0 0 154 77 2 1 0 0 0 0 0 0 80 158 1 0 1 5 1 0 0 0 166 SALES BY PRICE RANGE AND HOUSE TYPE YEAR-TO-DATE, 2017 Total Sales Share of Total Sales Average Price 2,261 423 421 356 1,636 81 3 2 5 5,188 43.6% 8.2% 8.1% 6.9% 31.5% 1.6% 0.1% 0.0% 0.1% 100.0% $1,068,670 $728,814 $688,111 $532,909 $442,598 $828,837 $228,300 $640,000 $294,600 $770,745 Total Sales Share of Total Sales Average Price 2,261 423 421 356 1,636 81 3 2 5 5,188 43.6% 8.2% 8.1% 6.9% 31.5% 1.6% 0.1% 0.0% 0.1% 100.0% $1,068,670 $728,814 $688,111 $532,909 $442,598 $828,837 $228,300 $640,000 $294,600 $770,745 1,7 1,7
- 3. Toronto Real Estate Board Market Watch, January 2017 Number of Sales Dollar Volume Average Price Median Price New Listings SNLR (Trend) Active Listings Mos. Inv. (Trend) Avg. SP / LP Avg. DOM TREB Total Halton Region Burlington Halton Hills Milton Oakville Peel Region Brampton Caledon Mississauga City of Toronto Toronto West Toronto Central Toronto East York Region Aurora E. Gwillimbury Georgina King Markham Newmarket Richmond Hill Vaughan Whitchurch-Stouffville Durham Region Ajax Brock Clarington Oshawa Pickering Scugog Uxbridge Whitby Dufferin County Orangeville Simcoe County Adjala-Tosorontio Bradford West GwillimburyEssa Innisfil New Tecumseth 5,188 $3,998,625,580 770,745 $631,000 7,338 74.4% 5,034 1.1 104% 19 465 $394,011,451 847,336 $750,000 640 79.9% 474 1.0 102% 20 123 $93,820,630 762,769 $700,000 140 81.1% 119 1.1 100% 24 57 $36,957,090 648,370 $569,900 65 83.0% 50 1.1 100% 22 108 $76,026,289 703,947 $664,050 142 83.1% 77 0.7 103% 15 177 $187,207,442 1,057,669 $940,000 293 76.6% 228 1.1 102% 20 1,081 $746,328,156 690,405 $630,000 1,387 75.7% 838 0.9 103% 17 531 $355,811,193 670,078 $635,000 642 76.0% 309 0.7 102% 16 41 $34,029,100 829,978 $711,000 67 70.9% 81 1.6 99% 33 509 $356,487,863 700,369 $585,000 678 76.1% 448 1.0 104% 17 1,904 $1,385,975,556 727,928 $539,900 2,886 71.5% 2,230 1.3 104% 20 471 $301,529,762 640,191 $548,000 753 72.4% 640 1.3 103% 22 963 $781,929,240 811,972 $518,000 1,533 69.5% 1,235 1.5 103% 21 470 $302,516,554 643,652 $640,250 600 75.0% 355 0.9 106% 18 956 $999,082,368 1,045,065 $930,000 1,420 71.6% 932 1.1 106% 17 53 $53,760,594 1,014,351 $881,800 97 74.2% 63 0.8 105% 13 16 $13,637,788 852,362 $832,500 31 74.6% 37 1.5 104% 21 77 $45,647,727 592,828 $545,000 86 76.0% 59 1.1 101% 21 34 $43,777,276 1,287,567 $1,155,000 55 61.3% 76 2.6 97% 33 240 $246,047,156 1,025,196 $952,950 378 70.5% 224 1.0 107% 15 91 $80,813,306 888,058 $843,000 105 80.7% 38 0.6 107% 15 200 $243,741,397 1,218,707 $1,134,444 287 69.1% 160 1.1 110% 17 211 $232,319,236 1,101,039 $980,000 340 70.4% 240 1.1 105% 17 34 $39,337,888 1,156,997 $947,500 41 75.0% 35 1.1 100% 30 595 $362,008,066 608,417 $570,000 735 81.8% 351 0.7 105% 15 109 $71,573,485 656,637 $645,000 119 80.4% 38 0.5 106% 14 5 $2,426,500 485,300 $425,000 6 76.5% 12 2.4 99% 64 103 $55,749,131 541,254 $505,500 132 83.2% 67 0.7 105% 16 186 $97,706,076 525,301 $499,063 218 83.6% 77 0.5 107% 12 69 $46,790,476 678,123 $675,000 85 80.3% 45 0.7 104% 13 14 $10,396,300 742,593 $552,500 25 77.2% 24 1.4 99% 35 14 $12,990,400 927,886 $789,500 20 76.7% 32 1.8 98% 46 95 $64,375,698 677,639 $626,000 130 82.5% 56 0.5 105% 14 29 $14,842,619 511,814 $480,000 38 89.0% 19 0.7 100% 23 29 $14,842,619 511,814 $480,000 38 89.0% 19 0.7 100% 23 158 $96,377,364 609,983 $559,000 232 80.5% 190 1.2 100% 23 9 $6,086,000 676,222 $525,000 11 83.6% 21 2.0 96% 46 53 $37,524,863 708,016 $650,000 69 78.9% 40 0.9 101% 19 21 $9,445,300 449,776 $455,000 43 79.4% 36 1.3 99% 12 36 $21,492,400 597,011 $548,750 51 77.4% 47 1.4 100% 29 39 $21,828,801 559,713 $525,000 58 85.8% 46 1.1 100% 24 SUMMARY OF EXISTING HOME TRANSACTIONS ALL HOME TYPES, JANUARY 2017 ALL TREB AREAS 3 1 1 1 2 5498 3
- 4. Toronto Real Estate Board Market Watch, January 2017 SUMMARY OF EXISTING HOME TRANSACTIONS ALL HOME TYPES, JANUARY 2017 CITY OF TORONTO MUNICIPAL BREAKDOWN 4 Number of Sales Dollar Volume Average Price Median Price New Listings SNLR (Trend) Active Listings Mos. Inv. (Trend) Avg. SP / LP Avg. DOM TREB Total City of Toronto Total Toronto West Toronto W01 Toronto W02 Toronto W03 Toronto W04 Toronto W05 Toronto W06 Toronto W07 Toronto W08 Toronto W09 Toronto W10 Toronto Central Toronto C01 Toronto C02 Toronto C03 Toronto C04 Toronto C06 Toronto C07 Toronto C08 Toronto C09 Toronto C10 Toronto C11 Toronto C12 Toronto C13 Toronto C14 Toronto C15 Toronto East Toronto E01 Toronto E02 Toronto E03 Toronto E04 Toronto E05 Toronto E06 Toronto E07 Toronto E08 Toronto E09 Toronto E10 Toronto E11 5,188 $3,998,625,580 $770,745 $631,000 7,338 74.4% 5,034 1.1 104% 19 1,904 $1,385,975,556 $727,928 $539,900 2,886 71.5% 2,230 1.3 104% 20 471 $301,529,762 $640,191 $548,000 753 72.4% 640 1.3 103% 22 28 $23,333,699 $833,346 $529,500 35 77.6% 28 1.1 103% 26 36 $31,803,953 $883,443 $915,000 53 76.8% 30 0.8 105% 17 29 $19,533,817 $673,580 $650,000 47 75.5% 29 0.9 106% 15 39 $22,381,688 $573,889 $508,500 60 69.7% 58 1.4 101% 25 68 $32,817,725 $482,614 $416,000 104 69.1% 117 1.7 101% 29 77 $42,863,830 $556,673 $462,600 166 66.1% 168 1.8 101% 28 16 $19,349,700 $1,209,356 $1,130,000 20 74.9% 13 1.0 108% 19 89 $62,545,059 $702,753 $425,000 147 75.5% 111 1.3 105% 17 31 $20,710,211 $668,071 $751,111 36 76.1% 17 1.1 106% 20 58 $26,190,080 $451,553 $347,250 85 72.9% 69 1.2 101% 21 963 $781,929,240 $811,972 $518,000 1,533 69.5% 1,235 1.5 103% 21 332 $190,741,978 $574,524 $477,400 494 69.4% 378 1.6 103% 22 38 $47,892,571 $1,260,331 $954,009 110 55.6% 133 2.4 104% 28 18 $17,513,380 $972,966 $980,000 50 65.8% 49 1.5 104% 15 31 $44,933,718 $1,449,475 $1,400,000 63 66.9% 68 1.2 102% 26 18 $14,844,700 $824,706 $459,000 24 73.9% 17 1.1 108% 16 90 $76,088,831 $845,431 $545,000 110 70.7% 73 1.3 102% 19 92 $51,302,438 $557,635 $513,750 181 69.9% 171 1.5 101% 22 6 $8,859,000 $1,476,500 $1,192,500 15 69.5% 22 1.7 100% 13 38 $33,515,450 $881,986 $640,000 67 70.5% 49 1.2 105% 20 23 $16,648,100 $723,830 $377,000 26 78.4% 15 1.0 109% 22 24 $66,980,800 $2,790,867 $2,929,000 55 65.9% 64 2.0 103% 15 35 $44,092,626 $1,259,789 $550,000 65 76.3% 41 1.0 109% 21 111 $93,179,250 $839,453 $480,000 141 70.4% 85 1.5 103% 18 107 $75,336,398 $704,078 $452,000 132 72.1% 70 1.3 103% 17 470 $302,516,554 $643,652 $640,250 600 75.0% 355 0.9 106% 18 33 $30,682,720 $929,779 $829,000 45 79.7% 23 0.6 114% 17 18 $16,452,443 $914,025 $869,000 26 76.7% 26 0.8 111% 15 35 $29,777,367 $850,782 $890,000 60 76.6% 40 0.7 108% 21 62 $36,651,988 $591,161 $675,400 67 74.3% 33 0.9 107% 19 61 $39,817,440 $652,745 $483,000 76 73.9% 51 0.9 107% 20 19 $14,674,014 $772,317 $730,000 26 67.7% 16 0.8 104% 18 42 $18,575,588 $442,276 $325,750 75 70.3% 50 1.2 106% 14 37 $30,446,599 $822,881 $730,000 46 76.8% 25 0.9 102% 14 70 $33,351,085 $476,444 $359,000 81 77.3% 34 1.0 104% 16 42 $28,231,200 $672,171 $683,750 47 71.8% 30 1.0 104% 24 51 $23,856,110 $467,767 $440,500 51 77.4% 27 0.9 103% 20 1 1 1 2 8 3 9 4 5
- 5. Toronto Real Estate Board Market Watch, January 2017 SUMMARY OF EXISTING HOME TRANSACTIONS ALL HOME TYPES, YEAR-TO-DATE 2017 ALL TREB AREAS 5 Number of Sales Dollar Volume Average Price Median Price New Listings Avg. SP / LP Avg. DOM TREB Total Halton Region Burlington Halton Hills Milton Oakville Peel Region Brampton Caledon Mississauga City of Toronto Toronto West Toronto Central Toronto East York Region Aurora E. Gwillimbury Georgina King Markham Newmarket Richmond Hill Vaughan Whitchurch-Stouffville Durham Region Ajax Brock Clarington Oshawa Pickering Scugog Uxbridge Whitby Dufferin County Orangeville Simcoe County Adjala-Tosorontio Bradford West GwillimburyEssa Innisfil New Tecumseth 5,188 $3,998,625,580 $770,745 $631,000 7,338 104% 19 465 $394,011,451 $847,336 $750,000 640 102% 20 123 $93,820,630 $762,769 $700,000 140 100% 24 57 $36,957,090 $648,370 $569,900 65 100% 22 108 $76,026,289 $703,947 $664,050 142 103% 15 177 $187,207,442 $1,057,669 $940,000 293 102% 20 1,081 $746,328,156 $690,405 $630,000 1,387 103% 17 531 $355,811,193 $670,078 $635,000 642 102% 16 41 $34,029,100 $829,978 $711,000 67 99% 33 509 $356,487,863 $700,369 $585,000 678 104% 17 1,904 $1,385,975,556 $727,928 $539,900 2,886 104% 20 471 $301,529,762 $640,191 $548,000 753 103% 22 963 $781,929,240 $811,972 $518,000 1,533 103% 21 470 $302,516,554 $643,652 $640,250 600 106% 18 956 $999,082,368 $1,045,065 $930,000 1,420 106% 17 53 $53,760,594 $1,014,351 $881,800 97 105% 13 16 $13,637,788 $852,362 $832,500 31 104% 21 77 $45,647,727 $592,828 $545,000 86 101% 21 34 $43,777,276 $1,287,567 $1,155,000 55 97% 33 240 $246,047,156 $1,025,196 $952,950 378 107% 15 91 $80,813,306 $888,058 $843,000 105 107% 15 200 $243,741,397 $1,218,707 $1,134,444 287 110% 17 211 $232,319,236 $1,101,039 $980,000 340 105% 17 34 $39,337,888 $1,156,997 $947,500 41 100% 30 595 $362,008,066 $608,417 $570,000 735 105% 15 109 $71,573,485 $656,637 $645,000 119 106% 14 5 $2,426,500 $485,300 $425,000 6 99% 64 103 $55,749,131 $541,254 $505,500 132 105% 16 186 $97,706,076 $525,301 $499,063 218 107% 12 69 $46,790,476 $678,123 $675,000 85 104% 13 14 $10,396,300 $742,593 $552,500 25 99% 35 14 $12,990,400 $927,886 $789,500 20 98% 46 95 $64,375,698 $677,639 $626,000 130 105% 14 29 $14,842,619 $511,814 $480,000 38 100% 23 29 $14,842,619 $511,814 $480,000 38 100% 23 158 $96,377,364 $609,983 $559,000 232 100% 23 9 $6,086,000 $676,222 $525,000 11 96% 46 53 $37,524,863 $708,016 $650,000 69 101% 19 21 $9,445,300 $449,776 $455,000 43 99% 12 36 $21,492,400 $597,011 $548,750 51 100% 29 39 $21,828,801 $559,713 $525,000 58 100% 24 1 1 1 2 4 5
- 6. Toronto Real Estate Board Market Watch, January 2017 SUMMARY OF EXISTING HOME TRANSACTIONS ALL HOME TYPES, YEAR-TO-DATE 2017 CITY OF TORONTO MUNICIPAL BREAKDOWN 6 Number of Sales Dollar Volume Average Price Median Price New Listings Avg. SP / LP Avg. DOM TREB Total City of Toronto Total Toronto West Toronto W01 Toronto W02 Toronto W03 Toronto W04 Toronto W05 Toronto W06 Toronto W07 Toronto W08 Toronto W09 Toronto W10 Toronto Central Toronto C01 Toronto C02 Toronto C03 Toronto C04 Toronto C06 Toronto C07 Toronto C08 Toronto C09 Toronto C10 Toronto C11 Toronto C12 Toronto C13 Toronto C14 Toronto C15 Toronto East Toronto E01 Toronto E02 Toronto E03 Toronto E04 Toronto E05 Toronto E06 Toronto E07 Toronto E08 Toronto E09 Toronto E10 Toronto E11 5,188 $3,998,625,580 $770,745 $631,000 7,338 104% 19 1,904 $1,385,975,556 $727,928 $539,900 2,886 104% 20 471 $301,529,762 $640,191 $548,000 753 103% 22 28 $23,333,699 $833,346 $529,500 35 103% 26 36 $31,803,953 $883,443 $915,000 53 105% 17 29 $19,533,817 $673,580 $650,000 47 106% 15 39 $22,381,688 $573,889 $508,500 60 101% 25 68 $32,817,725 $482,614 $416,000 104 101% 29 77 $42,863,830 $556,673 $462,600 166 101% 28 16 $19,349,700 $1,209,356 $1,130,000 20 108% 19 89 $62,545,059 $702,753 $425,000 147 105% 17 31 $20,710,211 $668,071 $751,111 36 106% 20 58 $26,190,080 $451,553 $347,250 85 101% 21 963 $781,929,240 $811,972 $518,000 1,533 103% 21 332 $190,741,978 $574,524 $477,400 494 103% 22 38 $47,892,571 $1,260,331 $954,009 110 104% 28 18 $17,513,380 $972,966 $980,000 50 104% 15 31 $44,933,718 $1,449,475 $1,400,000 63 102% 26 18 $14,844,700 $824,706 $459,000 24 108% 16 90 $76,088,831 $845,431 $545,000 110 102% 19 92 $51,302,438 $557,635 $513,750 181 101% 22 6 $8,859,000 $1,476,500 $1,192,500 15 100% 13 38 $33,515,450 $881,986 $640,000 67 105% 20 23 $16,648,100 $723,830 $377,000 26 109% 22 24 $66,980,800 $2,790,867 $2,929,000 55 103% 15 35 $44,092,626 $1,259,789 $550,000 65 109% 21 111 $93,179,250 $839,453 $480,000 141 103% 18 107 $75,336,398 $704,078 $452,000 132 103% 17 470 $302,516,554 $643,652 $640,250 600 106% 18 33 $30,682,720 $929,779 $829,000 45 114% 17 18 $16,452,443 $914,025 $869,000 26 111% 15 35 $29,777,367 $850,782 $890,000 60 108% 21 62 $36,651,988 $591,161 $675,400 67 107% 19 61 $39,817,440 $652,745 $483,000 76 107% 20 19 $14,674,014 $772,317 $730,000 26 104% 18 42 $18,575,588 $442,276 $325,750 75 106% 14 37 $30,446,599 $822,881 $730,000 46 102% 14 70 $33,351,085 $476,444 $359,000 81 104% 16 42 $28,231,200 $672,171 $683,750 47 104% 24 51 $23,856,110 $467,767 $440,500 51 103% 20 1 1 1 2 4 5
- 7. Toronto Real Estate Board Market Watch, January 2017 SUMMARY OF EXISTING HOME TRANSACTIONS DETACHED HOUSES, JANUARY 2017 ALL TREB AREAS 7 Sales Dollar Volume Average Price Median Price New Listings Active Listings Avg. SP / LP Avg. DOM TREB Total Halton Region Burlington Halton Hills Milton Oakville Peel Region Brampton Caledon Mississauga City of Toronto Toronto West Toronto Central Toronto East York Region Aurora E. Gwillimbury Georgina King Markham Newmarket Richmond Hill Vaughan Whitchurch-Stouffville Durham Region Ajax Brock Clarington Oshawa Pickering Scugog Uxbridge Whitby Dufferin County Orangeville Simcoe County Adjala-Tosorontio Bradford West GwillimburyEssa Innisfil New Tecumseth 2,261 $2,416,262,400 $1,068,670 $869,900 3,244 2,306 104% 19 253 $270,915,278 $1,070,811 $950,000 368 318 101% 23 60 $61,336,700 $1,022,278 $890,000 79 83 99% 27 40 $28,375,690 $709,392 $612,500 45 45 99% 27 46 $40,580,000 $882,174 $816,250 69 57 103% 19 107 $140,622,888 $1,314,233 $1,230,000 175 133 102% 20 470 $439,170,809 $934,406 $829,000 614 442 102% 19 281 $220,794,527 $785,746 $745,000 338 186 101% 18 25 $24,632,500 $985,300 $900,000 53 73 99% 40 164 $193,743,782 $1,181,365 $980,051 223 183 103% 16 466 $622,874,101 $1,336,640 $1,007,000 719 543 105% 19 149 $150,370,430 $1,009,198 $883,000 225 187 105% 22 128 $297,547,931 $2,324,593 $1,980,000 256 232 105% 18 189 $174,955,740 $925,692 $802,100 238 124 107% 18 532 $717,988,730 $1,349,603 $1,270,000 824 564 105% 17 23 $32,995,568 $1,434,590 $1,361,000 46 31 104% 14 15 $13,177,788 $878,519 $835,000 31 37 104% 21 71 $42,903,577 $604,276 $550,000 82 54 101% 20 24 $35,857,500 $1,494,063 $1,410,250 42 70 96% 42 103 $156,697,714 $1,521,337 $1,366,000 182 101 107% 13 54 $59,714,306 $1,105,820 $1,065,000 72 28 108% 8 101 $169,214,629 $1,675,392 $1,500,000 161 93 107% 14 113 $172,213,260 $1,524,011 $1,364,888 180 126 105% 16 28 $35,214,388 $1,257,657 $1,067,500 28 24 99% 34 406 $278,698,945 $686,451 $655,500 510 253 105% 16 75 $53,977,056 $719,694 $705,000 87 22 106% 12 5 $2,426,500 $485,300 $425,000 6 12 99% 64 64 $39,874,662 $623,042 $590,000 90 53 102% 20 134 $78,509,340 $585,891 $540,144 157 53 107% 12 40 $33,207,788 $830,195 $787,750 51 32 104% 13 14 $10,396,300 $742,593 $552,500 24 23 99% 35 13 $12,658,900 $973,762 $810,000 16 27 97% 49 61 $47,648,399 $781,121 $710,000 79 31 105% 13 18 $10,347,419 $574,857 $580,460 24 13 99% 32 18 $10,347,419 $574,857 $580,460 24 13 99% 32 116 $76,267,118 $657,475 $606,500 185 173 100% 25 9 $6,086,000 $676,222 $525,000 11 21 96% 46 35 $27,667,918 $790,512 $750,000 51 36 101% 19 13 $6,211,900 $477,838 $501,100 33 33 99% 16 29 $18,382,400 $633,876 $580,000 44 44 100% 33 30 $17,918,900 $597,297 $581,500 46 39 100% 24 1 2 3 4 51 1 1
- 8. Toronto Real Estate Board Market Watch, January 2017 SUMMARY OF EXISTING HOME TRANSACTIONS DETACHED HOUSES, JANUARY 2017 CITY OF TORONTO MUNICIPAL BREAKDOWN 8 Sales Dollar Volume Average Price Median Price New Listings Active Listings Avg. SP / LP Avg. DOM TREB Total City of Toronto Total Toronto West Toronto W01 Toronto W02 Toronto W03 Toronto W04 Toronto W05 Toronto W06 Toronto W07 Toronto W08 Toronto W09 Toronto W10 Toronto Central Toronto C01 Toronto C02 Toronto C03 Toronto C04 Toronto C06 Toronto C07 Toronto C08 Toronto C09 Toronto C10 Toronto C11 Toronto C12 Toronto C13 Toronto C14 Toronto C15 Toronto East Toronto E01 Toronto E02 Toronto E03 Toronto E04 Toronto E05 Toronto E06 Toronto E07 Toronto E08 Toronto E09 Toronto E10 Toronto E11 2,261 $2,416,262,400 $1,068,670 $869,900 3,244 2,306 104% 19 466 $622,874,101 $1,336,640 $1,007,000 719 543 105% 19 149 $150,370,430 $1,009,198 $883,000 225 187 105% 22 4 $8,555,000 $2,138,750 $2,022,500 7 11 102% 29 10 $11,405,500 $1,140,550 $1,180,000 19 10 103% 20 12 $8,971,600 $747,633 $677,000 18 13 103% 23 20 $15,747,388 $787,369 $675,000 30 27 101% 27 9 $8,636,500 $959,611 $845,000 18 26 101% 28 12 $11,103,750 $925,313 $841,750 22 21 103% 46 14 $18,130,700 $1,295,050 $1,185,000 16 10 108% 20 26 $35,454,581 $1,363,638 $1,300,000 53 51 108% 14 17 $15,414,111 $906,712 $860,000 17 3 106% 17 25 $16,951,300 $678,052 $680,000 25 15 103% 18 128 $297,547,931 $2,324,593 $1,980,000 256 232 105% 18 1 $1,921,000 $1,921,000 $1,921,000 5 5 120% 4 9 $17,078,018 $1,897,558 $1,600,000 12 8 113% 13 4 $5,100,000 $1,275,000 $1,150,000 20 18 101% 18 16 $35,501,000 $2,218,813 $2,074,500 37 38 101% 18 7 $10,521,800 $1,503,114 $1,400,000 12 6 112% 16 22 $39,972,375 $1,816,926 $1,700,000 31 22 102% 21 0 $0 - $0 1 2 - - 1 $3,800,000 $3,800,000 $3,800,000 5 10 99% 8 3 $5,650,000 $1,883,333 $1,880,000 6 4 122% 7 3 $5,981,000 $1,993,667 $1,861,000 3 1 111% 30 15 $59,671,800 $3,978,120 $3,450,000 40 55 102% 11 10 $31,684,638 $3,168,464 $2,523,000 23 14 111% 25 19 $47,081,300 $2,477,963 $2,326,000 37 39 103% 20 18 $33,585,000 $1,865,833 $1,782,500 24 10 103% 18 189 $174,955,740 $925,692 $802,100 238 124 107% 18 8 $9,464,658 $1,183,082 $1,193,889 6 2 112% 32 6 $7,712,043 $1,285,341 $1,055,000 9 5 114% 2 18 $19,705,288 $1,094,738 $1,095,500 32 24 107% 23 32 $24,561,500 $767,547 $764,000 34 13 109% 20 16 $19,589,840 $1,224,365 $1,265,440 18 10 110% 20 17 $13,885,014 $816,766 $750,000 18 7 105% 17 6 $5,911,000 $985,167 $941,500 20 13 113% 11 24 $23,758,600 $989,942 $810,500 28 16 101% 16 25 $18,813,397 $752,536 $750,000 31 10 106% 12 26 $22,714,600 $873,638 $805,000 32 18 105% 18 11 $8,839,800 $803,618 $728,500 10 6 104% 26 1 1 1 1 2 3 4 5
- 9. Toronto Real Estate Board Market Watch, January 2017 SUMMARY OF EXISTING HOME TRANSACTIONS SEMI-DETACHED HOUSES, JANUARY 2017 ALL TREB AREAS 9 Sales Dollar Volume Average Price Median Price New Listings Active Listings Avg. SP / LP Avg. DOM TREB Total Halton Region Burlington Halton Hills Milton Oakville Peel Region Brampton Caledon Mississauga City of Toronto Toronto West Toronto Central Toronto East York Region Aurora E. Gwillimbury Georgina King Markham Newmarket Richmond Hill Vaughan Whitchurch-Stouffville Durham Region Ajax Brock Clarington Oshawa Pickering Scugog Uxbridge Whitby Dufferin County Orangeville Simcoe County Adjala-Tosorontio Bradford West GwillimburyEssa Innisfil New Tecumseth 423 $308,288,318 $728,814 $678,000 543 211 108% 12 27 $18,433,701 $682,730 $665,000 32 7 105% 8 7 $4,768,900 $681,271 $685,000 8 2 107% 8 2 $1,140,000 $570,000 $570,000 2 0 105% 3 13 $8,399,801 $646,139 $645,000 16 2 106% 6 5 $4,125,000 $825,000 $880,000 6 3 99% 17 176 $115,696,328 $657,366 $643,500 190 56 105% 13 105 $64,362,538 $612,977 $615,000 110 31 103% 13 7 $4,438,000 $634,000 $627,000 6 4 100% 22 64 $46,895,790 $732,747 $727,500 74 21 107% 11 118 $106,517,220 $902,688 $832,125 190 102 111% 13 50 $39,622,846 $792,457 $689,500 71 38 107% 12 33 $38,581,050 $1,169,123 $1,039,000 67 40 113% 13 35 $28,313,324 $808,952 $760,000 52 24 114% 15 48 $40,368,576 $841,012 $855,750 69 26 110% 8 7 $5,593,300 $799,043 $815,400 10 4 114% 7 0 - - - 0 0 - - 0 - - - 1 1 - - 0 - - - 1 2 - - 7 $6,827,288 $975,327 $915,000 11 5 111% 6 8 $5,202,000 $650,250 $642,500 12 4 106% 7 8 $7,463,800 $932,975 $896,500 10 3 113% 7 17 $14,532,188 $854,835 $860,000 22 6 108% 10 1 $750,000 $750,000 $750,000 2 1 118% 6 43 $21,385,537 $497,338 $478,000 49 18 108% 16 10 $6,145,550 $614,555 $610,000 10 7 107% 16 0 - - - 0 0 - - 6 $2,732,500 $455,417 $477,500 8 2 114% 7 17 $6,794,487 $399,676 $397,500 23 6 114% 8 6 $3,509,000 $584,833 $573,000 5 1 104% 15 0 - - - 0 0 - - 0 - - - 1 1 - - 4 $2,204,000 $551,000 $565,000 2 1 95% 71 3 $1,267,500 $422,500 $435,000 4 1 102% 6 3 $1,267,500 $422,500 $435,000 4 1 102% 6 8 $4,619,456 $577,432 $629,278 9 1 104% 3 0 - - - 0 0 - - 6 $3,849,455 $641,576 $641,500 7 1 104% 3 1 $370,000 $370,000 $370,000 1 0 103% 1 0 - - - 0 0 - - 1 $400,001 $400,001 $400,001 1 0 111% 2 1 1 1 1 2 3 4 5
- 10. Toronto Real Estate Board Market Watch, January 2017 SUMMARY OF EXISTING HOME TRANSACTIONS SEMI-DETACHED HOUSES, JANUARY 2017 CITY OF TORONTO MUNICIPAL BREAKDOWN 10 Sales Dollar Volume Average Price Median Price New Listings Active Listings Avg. SP / LP Avg. DOM TREB Total City of Toronto Total Toronto West Toronto W01 Toronto W02 Toronto W03 Toronto W04 Toronto W05 Toronto W06 Toronto W07 Toronto W08 Toronto W09 Toronto W10 Toronto Central Toronto C01 Toronto C02 Toronto C03 Toronto C04 Toronto C06 Toronto C07 Toronto C08 Toronto C09 Toronto C10 Toronto C11 Toronto C12 Toronto C13 Toronto C14 Toronto C15 Toronto East Toronto E01 Toronto E02 Toronto E03 Toronto E04 Toronto E05 Toronto E06 Toronto E07 Toronto E08 Toronto E09 Toronto E10 Toronto E11 423 $308,288,318 $728,814 $678,000 543 211 108% 12 118 $106,517,220 $902,688 $832,125 190 102 111% 13 50 $39,622,846 $792,457 $689,500 71 38 107% 12 3 $2,929,300 $976,433 $999,300 5 2 117% 6 13 $12,747,524 $980,579 $940,000 18 7 110% 6 11 $7,719,217 $701,747 $675,000 15 7 107% 9 1 $825,000 $825,000 $825,000 2 1 104% 10 18 $11,603,825 $644,657 $631,000 27 19 102% 21 3 $3,142,980 $1,047,660 $1,229,990 3 2 101% 8 0 - - - 0 0 - - 0 - - - 0 0 - - 1 $655,000 $655,000 $655,000 1 0 101% 9 0 - - - 0 0 - - 33 $38,581,050 $1,169,123 $1,039,000 67 40 113% 13 8 $9,609,000 $1,201,125 $1,180,500 16 9 121% 23 3 $3,545,000 $1,181,667 $1,195,000 14 14 113% 15 2 $2,495,000 $1,247,500 $1,247,500 4 2 110% 0 0 - - - 2 2 - - 0 - - - 0 0 - - 4 $3,621,250 $905,313 $852,125 2 1 104% 22 1 $980,000 $980,000 $980,000 2 0 99% 19 1 $1,850,000 $1,850,000 $1,850,000 1 1 109% 4 4 $7,039,000 $1,759,750 $1,552,500 8 4 105% 5 3 $3,248,000 $1,082,667 $1,078,000 4 1 121% 5 0 - - - 0 0 - - 3 $2,511,000 $837,000 $796,000 6 2 117% 7 0 - - - 0 1 - - 4 $3,682,800 $920,700 $955,900 8 3 113% 6 35 $28,313,324 $808,952 $760,000 52 24 114% 15 12 $11,026,525 $918,877 $767,500 16 7 119% 12 6 $5,142,000 $857,000 $869,000 11 6 113% 16 7 $5,724,999 $817,857 $890,000 12 5 115% 5 4 $2,561,000 $640,250 $651,500 6 3 100% 35 0 - - - 1 1 - - 0 - - - 0 0 - - 2 $1,560,800 $780,400 $780,400 2 0 126% 5 0 - - - 0 0 - - 0 - - - 1 1 - - 2 $1,165,000 $582,500 $582,500 1 0 104% 25 2 $1,133,000 $566,500 $566,500 2 1 96% 34 1 1 1 1 2 3 4 5
- 11. Toronto Real Estate Board Market Watch, January 2017 SUMMARY OF EXISTING HOME TRANSACTIONS CONDOMINIUM TOWNHOUSES, JANUARY 2017 ALL TREB AREAS 11 Sales Dollar Volume Average Price Median Price New Listings Active Listings Avg. SP / LP Avg. DOM TREB Total Halton Region Burlington Halton Hills Milton Oakville Peel Region Brampton Caledon Mississauga City of Toronto Toronto West Toronto Central Toronto East York Region Aurora E. Gwillimbury Georgina King Markham Newmarket Richmond Hill Vaughan Whitchurch-Stouffville Durham Region Ajax Brock Clarington Oshawa Pickering Scugog Uxbridge Whitby Dufferin County Orangeville Simcoe County Adjala-Tosorontio Bradford West GwillimburyEssa Innisfil New Tecumseth 356 $189,715,551 $532,909 $485,500 473 289 106% 17 29 $14,603,621 $503,573 $458,000 48 30 104% 17 10 $5,621,633 $562,163 $489,667 13 9 105% 18 3 $1,290,100 $430,033 $415,000 6 3 105% 8 3 $1,267,000 $422,333 $440,000 4 3 105% 16 13 $6,424,888 $494,222 $466,000 25 15 103% 18 111 $54,039,145 $486,839 $478,000 141 66 106% 15 28 $12,122,186 $432,935 $415,500 43 26 104% 12 0 - - - 0 0 - - 83 $41,916,959 $505,024 $500,570 98 40 107% 16 135 $80,352,797 $595,206 $540,000 192 142 106% 18 37 $16,728,317 $452,117 $416,000 63 60 104% 18 48 $38,763,992 $807,583 $678,250 63 43 106% 16 50 $24,860,488 $497,210 $501,500 66 39 107% 20 48 $29,340,900 $611,269 $580,400 46 25 105% 21 13 $7,696,500 $592,038 $355,000 15 8 101% 17 0 - - - 0 0 - - 0 - - - 0 1 - - 0 - - - 0 0 - - 17 $11,957,600 $703,388 $720,000 17 9 107% 19 8 $3,984,300 $498,038 $496,000 5 2 105% 25 4 $2,659,000 $664,750 $645,500 5 2 118% 10 5 $2,640,000 $528,000 $455,000 4 3 98% 38 1 $403,500 $403,500 $403,500 0 0 98% 15 31 $10,637,088 $343,132 $351,000 43 25 107% 16 2 $745,000 $372,500 $372,500 5 3 100% 13 0 - - - 0 0 - - 3 $1,089,100 $363,033 $364,100 2 0 105% 24 16 $4,616,000 $288,500 $307,550 18 7 109% 15 5 $2,273,688 $454,738 $440,000 8 6 107% 18 0 - - - 0 0 - - 0 - - - 0 1 - - 5 $1,913,300 $382,660 $417,500 10 8 109% 14 1 $312,000 $312,000 $312,000 1 1 96% 9 1 $312,000 $312,000 $312,000 1 1 96% 9 1 $430,000 $430,000 $430,000 2 0 102% 3 0 - - - 0 0 - - 1 $430,000 $430,000 $430,000 2 0 102% 3 0 - - - 0 0 - - 0 - - - 0 0 - - 0 - - - 0 0 - - 1 1 1 1 2 3 4 5
- 12. Toronto Real Estate Board Market Watch, January 2017 SUMMARY OF EXISTING HOME TRANSACTIONS CONDOMINIUM TOWNHOUSES, JANUARY 2017 CITY OF TORONTO MUNICIPAL BREAKDOWN 12 Sales Dollar Volume Average Price Median Price New Listings Active Listings Avg. SP / LP Avg. DOM TREB Total City of Toronto Total Toronto West Toronto W01 Toronto W02 Toronto W03 Toronto W04 Toronto W05 Toronto W06 Toronto W07 Toronto W08 Toronto W09 Toronto W10 Toronto Central Toronto C01 Toronto C02 Toronto C03 Toronto C04 Toronto C06 Toronto C07 Toronto C08 Toronto C09 Toronto C10 Toronto C11 Toronto C12 Toronto C13 Toronto C14 Toronto C15 Toronto East Toronto E01 Toronto E02 Toronto E03 Toronto E04 Toronto E05 Toronto E06 Toronto E07 Toronto E08 Toronto E09 Toronto E10 Toronto E11 356 $189,715,551 $532,909 $485,500 473 289 106% 17 135 $80,352,797 $595,206 $540,000 192 142 106% 18 37 $16,728,317 $452,117 $416,000 63 60 104% 18 1 $496,500 $496,500 $496,500 2 1 99% 8 5 $3,027,929 $605,586 $650,000 5 5 104% 13 1 $624,000 $624,000 $624,000 2 1 118% 9 2 $762,000 $381,000 $381,000 3 4 98% 7 12 $4,158,000 $346,500 $374,500 24 32 99% 31 1 $518,000 $518,000 $518,000 3 2 121% 1 0 - - - 0 0 - - 7 $4,117,888 $588,270 $560,000 7 2 105% 10 2 $1,240,000 $620,000 $620,000 4 4 115% 19 6 $1,784,000 $297,333 $294,500 13 9 103% 16 48 $38,763,992 $807,583 $678,250 63 43 106% 16 15 $12,896,001 $859,733 $690,000 19 13 104% 14 2 $1,768,443 $884,222 $884,222 3 5 99% 33 2 $2,120,000 $1,060,000 $1,060,000 3 1 103% 12 0 - - - 2 2 - - 0 - - - 0 0 - - 5 $3,019,500 $603,900 $600,000 8 7 112% 5 1 $415,000 $415,000 $415,000 1 1 92% 23 1 $1,650,000 $1,650,000 $1,650,000 0 0 97% 45 2 $2,677,750 $1,338,875 $1,338,875 1 0 112% 24 3 $2,899,900 $966,633 $630,000 5 3 106% 21 3 $2,480,000 $826,667 $869,000 4 2 105% 26 1 $852,000 $852,000 $852,000 3 2 109% 5 4 $2,765,000 $691,250 $570,000 3 0 111% 15 9 $5,220,398 $580,044 $600,000 11 7 110% 13 50 $24,860,488 $497,210 $501,500 66 39 107% 20 3 $1,679,000 $559,667 $540,000 7 6 99% 33 1 $595,000 $595,000 $595,000 1 2 112% 6 0 - - - 0 0 - - 7 $3,745,988 $535,141 $522,888 6 4 107% 12 14 $7,367,000 $526,214 $524,000 16 11 108% 30 0 - - - 0 0 - - 2 $1,060,000 $530,000 $530,000 3 1 118% 4 4 $2,170,500 $542,625 $546,250 4 0 113% 10 7 $2,538,200 $362,600 $388,000 10 4 104% 16 2 $1,040,500 $520,250 $520,250 5 4 101% 19 10 $4,664,300 $466,430 $459,500 14 7 105% 18 1 1 1 1 2 3 4 5
- 13. Toronto Real Estate Board Market Watch, January 2017 SUMMARY OF EXISTING HOME TRANSACTIONS CONDOMINIUM APARTMENT, JANUARY 2017 ALL TREB AREAS 13 Sales Dollar Volume Average Price Median Price New Listings Active Listings Avg. SP / LP Avg. DOM TREB Total Halton Region Burlington Halton Hills Milton Oakville Peel Region Brampton Caledon Mississauga City of Toronto Toronto West Toronto Central Toronto East York Region Aurora E. Gwillimbury Georgina King Markham Newmarket Richmond Hill Vaughan Whitchurch-Stouffville Durham Region Ajax Brock Clarington Oshawa Pickering Scugog Uxbridge Whitby Dufferin County Orangeville Simcoe County Adjala-Tosorontio Bradford West GwillimburyEssa Innisfil New Tecumseth 1,636 $724,091,091 $442,598 $387,250 2,418 1,946 101% 22 60 $25,919,700 $431,995 $372,000 97 94 99% 28 29 $11,432,900 $394,238 $325,000 23 22 98% 31 3 $1,067,500 $355,833 $338,500 5 2 102% 12 8 $2,999,000 $374,875 $372,500 12 7 102% 22 20 $10,420,300 $521,015 $419,500 57 63 99% 29 220 $74,397,432 $338,170 $324,000 307 227 101% 20 34 $10,270,001 $302,059 $289,500 50 36 100% 18 2 $877,000 $438,500 $438,500 2 1 99% 42 184 $63,250,431 $343,752 $326,500 255 190 101% 21 1,125 $530,335,493 $471,409 $420,000 1,698 1,387 101% 22 223 $87,606,270 $392,853 $355,000 376 338 100% 25 737 $390,464,267 $529,802 $461,000 1,116 897 101% 22 165 $52,264,956 $316,757 $308,000 206 152 101% 20 189 $80,637,776 $426,655 $386,000 267 206 100% 24 1 $294,000 $294,000 $294,000 13 10 109% 17 0 - - - 0 0 - - 1 $324,000 $324,000 $324,000 2 2 100% 3 4 $1,786,888 $446,722 $446,944 4 2 98% 19 67 $27,613,288 $412,139 $380,000 95 73 100% 26 9 $3,705,900 $411,767 $429,900 8 2 104% 22 50 $21,384,300 $427,686 $397,000 59 43 100% 27 56 $24,854,400 $443,829 $422,250 82 68 99% 23 1 $675,000 $675,000 $675,000 4 6 98% 18 37 $11,434,800 $309,049 $300,500 46 27 105% 16 5 $1,414,500 $282,900 $280,000 3 3 99% 38 0 - - - 0 0 - - 10 $2,971,400 $297,140 $295,000 8 7 103% 13 3 $475,000 $158,333 $160,000 6 6 107% 13 11 $3,747,900 $340,718 $305,000 13 2 104% 12 0 - - - 0 0 - - 1 $331,500 $331,500 $331,500 3 2 111% 9 7 $2,494,500 $356,357 $330,000 13 7 109% 15 1 $162,000 $162,000 $162,000 1 2 98% 29 1 $162,000 $162,000 $162,000 1 2 98% 29 4 $1,203,890 $300,973 $294,495 2 3 99% 54 0 - - - 0 0 - - 2 $548,990 $274,495 $274,495 0 1 100% 66 0 - - - 0 0 - - 0 - - - 0 1 - - 2 $654,900 $327,450 $327,450 2 1 99% 42 1 1 1 1 2 3 4 5
- 14. Toronto Real Estate Board Market Watch, January 2017 SUMMARY OF EXISTING HOME TRANSACTIONS CONDOMINIUM APARTMENT, JANUARY 2017 CITY OF TORONTO MUNICIPAL BREAKDOWN 14 Sales Dollar Volume Average Price Median Price New Listings Active Listings Avg. SP / LP Avg. DOM TREB Total City of Toronto Total Toronto West Toronto W01 Toronto W02 Toronto W03 Toronto W04 Toronto W05 Toronto W06 Toronto W07 Toronto W08 Toronto W09 Toronto W10 Toronto Central Toronto C01 Toronto C02 Toronto C03 Toronto C04 Toronto C06 Toronto C07 Toronto C08 Toronto C09 Toronto C10 Toronto C11 Toronto C12 Toronto C13 Toronto C14 Toronto C15 Toronto East Toronto E01 Toronto E02 Toronto E03 Toronto E04 Toronto E05 Toronto E06 Toronto E07 Toronto E08 Toronto E09 Toronto E10 Toronto E11 1,636 $724,091,091 $442,598 $387,250 2,418 1,946 101% 22 1,125 $530,335,493 $471,409 $420,000 1,698 1,387 101% 22 223 $87,606,270 $392,853 $355,000 376 338 100% 25 18 $9,376,900 $520,939 $445,950 19 13 101% 28 7 $3,805,000 $543,571 $480,000 9 6 101% 32 4 $1,707,000 $426,750 $383,500 9 5 102% 10 16 $5,047,300 $315,456 $311,500 25 26 99% 26 26 $7,039,400 $270,746 $325,250 32 36 98% 35 58 $26,459,200 $456,193 $414,100 133 140 99% 25 2 $1,219,000 $609,500 $609,500 4 2 107% 6 56 $22,972,590 $410,225 $361,750 86 57 102% 19 9 $2,525,100 $280,567 $220,500 12 9 99% 29 27 $7,454,780 $276,103 $285,800 47 44 98% 25 737 $390,464,267 $529,802 $461,000 1,116 897 101% 22 302 $160,369,977 $531,026 $460,400 447 345 101% 22 23 $23,751,110 $1,032,657 $650,000 75 101 98% 36 10 $7,798,380 $779,838 $551,500 21 24 104% 18 13 $8,132,718 $625,594 $565,000 18 23 107% 38 11 $4,322,900 $392,991 $359,900 12 11 100% 17 57 $27,762,706 $487,065 $460,000 66 42 101% 20 88 $48,762,438 $554,119 $513,750 174 167 101% 23 3 $1,559,000 $519,667 $439,000 9 11 99% 6 28 $16,798,700 $599,954 $557,500 51 40 100% 23 14 $4,519,200 $322,800 $322,150 14 10 100% 23 6 $4,829,000 $804,833 $671,000 10 7 107% 19 21 $9,044,988 $430,714 $365,000 32 22 101% 22 86 $40,877,950 $475,325 $453,350 99 44 102% 18 75 $31,935,200 $425,803 $382,000 88 50 100% 19 165 $52,264,956 $316,757 $308,000 206 152 101% 20 3 $1,769,000 $589,667 $580,000 9 6 107% 9 4 $2,653,500 $663,375 $567,750 5 12 101% 32 8 $3,183,080 $397,885 $383,550 12 9 103% 29 16 $4,293,500 $268,344 $276,500 17 10 101% 18 27 $9,603,700 $355,693 $365,000 35 27 102% 18 2 $789,000 $394,500 $394,500 8 9 98% 22 32 $10,043,788 $313,868 $310,000 48 33 99% 16 5 $1,750,000 $350,000 $263,000 10 9 100% 13 38 $11,999,488 $315,776 $317,500 39 19 101% 19 10 $1,880,100 $188,010 $198,000 5 6 97% 46 20 $4,299,800 $214,990 $191,250 18 12 100% 19 1 1 1 1 2 3 4 5
- 15. Toronto Real Estate Board Market Watch, January 2017 SUMMARY OF EXISTING HOME TRANSACTIONS LINK, JANUARY 2017 ALL TREB AREAS 15 Sales Dollar Volume Average Price Median Price New Listings Active Listings Avg. SP / LP Avg. DOM TREB Total Halton Region Burlington Halton Hills Milton Oakville Peel Region Brampton Caledon Mississauga City of Toronto Toronto West Toronto Central Toronto East York Region Aurora E. Gwillimbury Georgina King Markham Newmarket Richmond Hill Vaughan Whitchurch-Stouffville Durham Region Ajax Brock Clarington Oshawa Pickering Scugog Uxbridge Whitby Dufferin County Orangeville Simcoe County Adjala-Tosorontio Bradford West GwillimburyEssa Innisfil New Tecumseth 81 $67,135,788 $828,837 $658,000 91 25 122% 10 9 $5,897,000 $655,222 $622,000 7 1 106% 10 3 $1,795,100 $598,367 $600,000 3 0 111% 4 1 $434,900 $434,900 $434,900 1 0 100% 6 1 $620,000 $620,000 $620,000 0 0 96% 39 4 $3,047,000 $761,750 $792,500 3 1 107% 9 7 $4,182,000 $597,429 $604,000 7 2 100% 20 7 $4,182,000 $597,429 $604,000 3 0 100% 20 0 - - - 0 0 - - 0 - - - 4 2 - - 4 $3,612,900 $903,225 $893,000 5 3 108% 6 0 - - - 0 1 - - 3 $2,626,000 $875,333 $873,000 3 0 108% 7 1 $986,900 $986,900 $986,900 2 2 110% 5 31 $37,751,488 $1,217,790 $926,000 39 11 141% 8 0 - - - 2 2 - - 0 - - - 0 0 - - 0 - - - 0 0 - - 0 - - - 0 0 - - 18 $17,408,988 $967,166 $935,500 23 7 110% 6 2 $1,480,000 $740,000 $740,000 2 0 116% 4 6 $14,380,000 $2,396,667 $985,000 7 1 277% 6 5 $4,482,500 $896,500 $845,000 5 1 101% 18 0 - - - 0 0 - - 18 $9,738,000 $541,000 $556,500 21 6 106% 6 0 - - - 0 0 - - 0 - - - 0 0 - - 4 $2,136,000 $534,000 $543,000 4 1 112% 8 4 $1,631,000 $407,750 $410,500 3 0 103% 11 2 $1,235,000 $617,500 $617,500 2 1 104% 4 0 - - - 1 1 - - 0 - - - 0 0 - - 8 $4,736,000 $592,000 $572,500 11 3 105% 4 0 - - - 0 0 - - 0 - - - 0 0 - - 12 $5,954,400 $496,200 $470,000 12 2 101% 14 0 - - - 0 0 - - 6 $3,293,000 $548,833 $545,000 5 0 102% 17 4 $1,753,400 $438,350 $454,250 5 2 99% 11 1 $475,000 $475,000 $475,000 1 0 99% 8 1 $433,000 $433,000 $433,000 1 0 104% 12 1 1 1 1 2 3 4 5
- 16. Toronto Real Estate Board Market Watch, January 2017 SUMMARY OF EXISTING HOME TRANSACTIONS LINK, JANUARY 2017 CITY OF TORONTO MUNICIPAL BREAKDOWN 16 Sales Dollar Volume Average Price Median Price New Listings Active Listings Avg. SP / LP Avg. DOM TREB Total City of Toronto Total Toronto West Toronto W01 Toronto W02 Toronto W03 Toronto W04 Toronto W05 Toronto W06 Toronto W07 Toronto W08 Toronto W09 Toronto W10 Toronto Central Toronto C01 Toronto C02 Toronto C03 Toronto C04 Toronto C06 Toronto C07 Toronto C08 Toronto C09 Toronto C10 Toronto C11 Toronto C12 Toronto C13 Toronto C14 Toronto C15 Toronto East Toronto E01 Toronto E02 Toronto E03 Toronto E04 Toronto E05 Toronto E06 Toronto E07 Toronto E08 Toronto E09 Toronto E10 Toronto E11 81 $67,135,788 $828,837 $658,000 91 25 122% 10 4 $3,612,900 $903,225 $893,000 5 3 108% 6 0 - - - 0 1 - - 0 - - - 0 0 - - 0 - - - 0 0 - - 0 - - - 0 0 - - 0 - - - 0 0 - - 0 - - - 0 1 - - 0 - - - 0 0 - - 0 - - - 0 0 - - 0 - - - 0 0 - - 0 - - - 0 0 - - 0 - - - 0 0 - - 3 $2,626,000 $875,333 $873,000 3 0 108% 7 0 - - - 0 0 - - 0 - - - 0 0 - - 0 - - - 0 0 - - 0 - - - 0 0 - - 0 - - - 0 0 - - 2 $1,713,000 $856,500 $856,500 2 0 111% 7 0 - - - 0 0 - - 0 - - - 0 0 - - 0 - - - 0 0 - - 0 - - - 0 0 - - 0 - - - 0 0 - - 0 - - - 0 0 - - 0 - - - 0 0 - - 1 $913,000 $913,000 $913,000 1 0 102% 7 1 $986,900 $986,900 $986,900 2 2 110% 5 0 - - - 0 0 - - 0 - - - 0 0 - - 0 - - - 0 0 - - 0 - - - 0 0 - - 1 $986,900 $986,900 $986,900 1 0 110% 5 0 - - - 0 0 - - 0 - - - 0 1 - - 0 - - - 0 0 - - 0 - - - 0 0 - - 0 - - - 1 1 - - 0 - - - 0 0 - - 1 1 1 1 2 3 4 5
- 17. Toronto Real Estate Board Market Watch, January 2017 SUMMARY OF EXISTING HOME TRANSACTIONS ATTACHED/ROW/TOWNHOUSE, JANUARY 2017 ALL TREB AREAS 17 Sales Dollar Volume Average Price Median Price New Listings Active Listings Avg. SP / LP Avg. DOM TREB Total Halton Region Burlington Halton Hills Milton Oakville Peel Region Brampton Caledon Mississauga City of Toronto Toronto West Toronto Central Toronto East York Region Aurora E. Gwillimbury Georgina King Markham Newmarket Richmond Hill Vaughan Whitchurch-Stouffville Durham Region Ajax Brock Clarington Oshawa Pickering Scugog Uxbridge Whitby Dufferin County Orangeville Simcoe County Adjala-Tosorontio Bradford West GwillimburyEssa Innisfil New Tecumseth 421 $289,694,532 $688,111 $630,000 547 230 106% 13 87 $58,242,151 $669,450 $626,666 88 23 104% 14 14 $8,865,397 $633,243 $594,250 14 2 105% 13 8 $4,648,900 $581,113 $555,000 6 0 103% 16 37 $22,160,488 $598,932 $605,500 41 8 104% 12 28 $22,567,366 $805,977 $770,725 27 13 104% 17 96 $58,242,442 $606,692 $594,950 128 45 103% 12 76 $44,079,941 $579,999 $585,000 98 30 103% 13 7 $4,081,600 $583,086 $580,000 6 3 102% 14 13 $10,080,901 $775,454 $770,001 24 12 105% 5 48 $40,125,145 $835,941 $733,750 67 34 107% 14 9 $6,536,899 $726,322 $605,000 14 11 105% 20 11 $12,923,000 $1,174,818 $1,085,000 21 13 106% 26 28 $20,665,246 $738,045 $705,500 32 10 107% 8 108 $92,994,898 $861,064 $857,500 173 99 108% 12 9 $7,181,226 $797,914 $796,800 11 8 108% 7 1 $460,000 $460,000 $460,000 0 0 100% 23 5 $2,420,150 $484,030 $460,450 1 1 103% 39 6 $6,132,888 $1,022,148 $1,085,000 8 2 102% 6 28 $25,542,278 $912,224 $869,995 48 28 112% 4 10 $6,726,800 $672,680 $668,500 6 2 104% 42 31 $28,639,668 $923,860 $931,500 45 18 108% 12 15 $13,596,888 $906,459 $938,000 47 36 105% 4 3 $2,295,000 $765,000 $750,000 7 4 104% 12 60 $30,113,696 $501,895 $510,000 66 21 108% 10 17 $9,291,379 $546,552 $545,000 14 3 106% 14 0 - - - 0 0 - - 16 $6,945,469 $434,092 $435,750 20 4 114% 6 12 $5,680,249 $473,354 $473,000 11 5 104% 13 5 $2,817,100 $563,420 $570,000 6 3 110% 13 0 - - - 0 0 - - 0 - - - 0 0 - - 10 $5,379,499 $537,950 $534,500 15 6 104% 8 6 $2,753,700 $458,950 $464,000 8 2 105% 5 6 $2,753,700 $458,950 $464,000 8 2 105% 5 16 $7,222,500 $451,406 $432,500 17 6 100% 18 0 - - - 0 0 - - 3 $1,735,500 $578,500 $597,500 4 2 99% 31 3 $1,110,000 $370,000 $355,000 4 1 99% 1 6 $2,635,000 $439,167 $443,000 6 2 101% 16 4 $1,742,000 $435,500 $410,500 3 1 99% 23 1 1 1 1 2 3 4 5
- 18. Toronto Real Estate Board Market Watch, January 2017 SUMMARY OF EXISTING HOME TRANSACTIONS ATTACHED/ROW/TOWNHOUSE, JANUARY 2017 CITY OF TORONTO MUNICIPAL BREAKDOWN 18 Sales Dollar Volume Average Price Median Price New Listings Active Listings Avg. SP / LP Avg. DOM TREB Total City of Toronto Total Toronto West Toronto W01 Toronto W02 Toronto W03 Toronto W04 Toronto W05 Toronto W06 Toronto W07 Toronto W08 Toronto W09 Toronto W10 Toronto Central Toronto C01 Toronto C02 Toronto C03 Toronto C04 Toronto C06 Toronto C07 Toronto C08 Toronto C09 Toronto C10 Toronto C11 Toronto C12 Toronto C13 Toronto C14 Toronto C15 Toronto East Toronto E01 Toronto E02 Toronto E03 Toronto E04 Toronto E05 Toronto E06 Toronto E07 Toronto E08 Toronto E09 Toronto E10 Toronto E11 421 $289,694,532 $688,111 $630,000 547 230 106% 13 48 $40,125,145 $835,941 $733,750 67 34 107% 14 9 $6,536,899 $726,322 $605,000 14 11 105% 20 2 $1,975,999 $988,000 $988,000 2 1 101% 41 1 $818,000 $818,000 $818,000 2 2 97% 45 1 $512,000 $512,000 $512,000 3 3 128% 11 0 - - - 0 0 - - 2 $1,205,000 $602,500 $602,500 2 2 98% 16 2 $1,424,900 $712,450 $712,450 2 0 111% 5 0 - - - 0 0 - - 0 - - - 1 1 - - 1 $601,000 $601,000 $601,000 2 1 114% 2 0 - - - 0 1 - - 11 $12,923,000 $1,174,818 $1,085,000 21 13 106% 26 5 $5,638,000 $1,127,600 $1,085,000 7 6 113% 46 1 $1,750,000 $1,750,000 $1,750,000 5 4 103% 7 0 - - - 0 0 - - 1 $820,000 $820,000 $820,000 2 1 103% 12 0 - - - 0 0 - - 0 - - - 1 1 - - 1 $910,000 $910,000 $910,000 3 0 98% 1 0 - - - 0 0 - - 1 $1,350,000 $1,350,000 $1,350,000 1 1 104% 7 0 - - - 0 0 - - 0 - - - 1 0 - - 0 - - - 0 0 - - 2 $2,455,000 $1,227,500 $1,227,500 1 0 98% 17 0 - - - 0 0 - - 28 $20,665,246 $738,045 $705,500 32 10 107% 8 7 $6,743,537 $963,362 $890,500 7 2 117% 4 0 - - - 0 1 - - 2 $1,164,000 $582,000 $582,000 4 2 97% 20 2 $1,370,000 $685,000 $685,000 1 0 104% 7 3 $2,270,000 $756,667 $765,000 5 2 101% 5 0 - - - 0 0 - - 0 - - - 2 2 - - 4 $2,767,499 $691,875 $687,500 4 0 105% 7 0 - - - 0 0 - - 2 $1,431,000 $715,500 $715,500 2 0 110% 5 8 $4,919,210 $614,901 $634,850 7 1 104% 12 1 1 1 1 2 3 4 5
- 19. Toronto Real Estate Board Market Watch, January 2017 SUMMARY OF EXISTING HOME TRANSACTIONS CO-OP APARTMENT, JANUARY 2017 ALL TREB AREAS 19 Sales Dollar Volume Average Price Median Price New Listings Active Listings Avg. SP / LP Average DOM TREB Total Halton Region Burlington Halton Hills Milton Oakville Peel Region Brampton Caledon Mississauga City of Toronto Toronto West Toronto Central Toronto East York Region Aurora E. Gwillimbury Georgina King Markham Newmarket Richmond Hill Vaughan Whitchurch-Stouffville Durham Region Ajax Brock Clarington Oshawa Pickering Scugog Uxbridge Whitby Dufferin County Orangeville Simcoe County Adjala-Tosorontio Bradford West GwillimburyEssa Innisfil New Tecumseth 3 $684,900 $228,300 $215,000 10 12 98% 42 0 - - - 0 1 - - 0 - - - 0 1 - - 0 - - - 0 0 - - 0 - - - 0 0 - - 0 - - - 0 0 - - 0 - - - 0 0 - - 0 - - - 0 0 - - 0 - - - 0 0 - - 0 - - - 0 0 - - 3 $684,900 $228,300 $215,000 10 11 98% 42 1 $215,000 $215,000 $215,000 3 4 96% 84 0 - - - 3 3 - - 2 $469,900 $234,950 $234,950 4 4 99% 22 0 - - - 0 0 - - 0 - - - 0 0 - - 0 - - - 0 0 - - 0 - - - 0 0 - - 0 - - - 0 0 - - 0 - - - 0 0 - - 0 - - - 0 0 - - 0 - - - 0 0 - - 0 - - - 0 0 - - 0 - - - 0 0 - - 0 - - - 0 0 - - 0 - - - 0 0 - - 0 - - - 0 0 - - 0 - - - 0 0 - - 0 - - - 0 0 - - 0 - - - 0 0 - - 0 - - - 0 0 - - 0 - - - 0 0 - - 0 - - - 0 0 - - 0 - - - 0 0 - - 0 - - - 0 0 - - 0 - - - 0 0 - - 0 - - - 0 0 - - 0 - - - 0 0 - - 0 - - - 0 0 - - 0 - - - 0 0 - - 0 - - - 0 0 - - 1 1 1 1 2 3 4 5
- 20. Toronto Real Estate Board Market Watch, January 2017 SUMMARY OF EXISTING HOME TRANSACTIONS CO-OP APARTMENT, JANUARY 2017 CITY OF TORONTO MUNICIPAL BREAKDOWN 20 Sales Dollar Volume Average Price Median Price New Listings Active Listings Avg. SP / LP Avg. DOM TREB Total City of Toronto Total Toronto West Toronto W01 Toronto W02 Toronto W03 Toronto W04 Toronto W05 Toronto W06 Toronto W07 Toronto W08 Toronto W09 Toronto W10 Toronto Central Toronto C01 Toronto C02 Toronto C03 Toronto C04 Toronto C06 Toronto C07 Toronto C08 Toronto C09 Toronto C10 Toronto C11 Toronto C12 Toronto C13 Toronto C14 Toronto C15 Toronto East Toronto E01 Toronto E02 Toronto E03 Toronto E04 Toronto E05 Toronto E06 Toronto E07 Toronto E08 Toronto E09 Toronto E10 Toronto E11 3 $684,900 $228,300 $215,000 10 12 98% 42 3 $684,900 $228,300 $215,000 10 11 98% 42 1 $215,000 $215,000 $215,000 3 4 96% 84 0 - - - 0 0 - - 0 - - - 0 0 - - 0 - - - 0 0 - - 0 - - - 0 0 - - 0 - - - 0 0 - - 1 $215,000 $215,000 $215,000 3 3 96% 84 0 - - - 0 1 - - 0 - - - 0 0 - - 0 - - - 0 0 - - 0 - - - 0 0 - - 0 - - - 3 3 - - 0 - - - 0 0 - - 0 - - - 1 1 - - 0 - - - 1 1 - - 0 - - - 1 1 - - 0 - - - 0 0 - - 0 - - - 0 0 - - 0 - - - 0 0 - - 0 - - - 0 0 - - 0 - - - 0 0 - - 0 - - - 0 0 - - 0 - - - 0 0 - - 0 - - - 0 0 - - 0 - - - 0 0 - - 0 - - - 0 0 - - 2 $469,900 $234,950 $234,950 4 4 99% 22 0 - - - 0 0 - - 1 $349,900 $349,900 $349,900 0 0 100% 19 0 - - - 0 0 - - 1 $120,000 $120,000 $120,000 3 3 96% 24 0 - - - 0 0 - - 0 - - - 0 0 - - 0 - - - 0 0 - - 0 - - - 0 0 - - 0 - - - 0 0 - - 0 - - - 1 1 - - 0 - - - 0 0 - - 1 1 1 1 2 3 4 5
- 21. Toronto Real Estate Board Market Watch, January 2017 SUMMARY OF EXISTING HOME TRANSACTIONS DETACHED CONDOMINIUM, JANUARY 2017 ALL TREB AREAS 21 Sales Dollar Volume Average Price Median Price New Listings Active Listings Avg. SP / LP Avg. DOM TREB Total Halton Region Burlington Halton Hills Milton Oakville Peel Region Brampton Caledon Mississauga City of Toronto Toronto West Toronto Central Toronto East York Region Aurora E. Gwillimbury Georgina King Markham Newmarket Richmond Hill Vaughan Whitchurch-Stouffville Durham Region Ajax Brock Clarington Oshawa Pickering Scugog Uxbridge Whitby Dufferin County Orangeville Simcoe County Adjala-Tosorontio Bradford West GwillimburyEssa Innisfil New Tecumseth 2 $1,280,000 $640,000 $640,000 7 7 102% 22 0 - - - 0 0 - - 0 - - - 0 0 - - 0 - - - 0 0 - - 0 - - - 0 0 - - 0 - - - 0 0 - - 1 $600,000 $600,000 $600,000 0 0 99% 28 0 - - - 0 0 - - 0 - - - 0 0 - - 1 $600,000 $600,000 $600,000 0 0 99% 28 0 - - - 0 0 - - 0 - - - 0 0 - - 0 - - - 0 0 - - 0 - - - 0 0 - - 0 - - - 2 1 - - 0 - - - 0 0 - - 0 - - - 0 0 - - 0 - - - 0 0 - - 0 - - - 0 0 - - 0 - - - 2 1 - - 0 - - - 0 0 - - 0 - - - 0 0 - - 0 - - - 0 0 - - 0 - - - 0 0 - - 0 - - - 0 1 - - 0 - - - 0 0 - - 0 - - - 0 0 - - 0 - - - 0 0 - - 0 - - - 0 0 - - 0 - - - 0 0 - - 0 - - - 0 0 - - 0 - - - 0 1 - - 0 - - - 0 0 - - 0 - - - 0 0 - - 0 - - - 0 0 - - 1 $680,000 $680,000 $680,000 5 5 105% 16 0 - - - 0 0 - - 0 - - - 0 0 - - 0 - - - 0 0 - - 0 - - - 0 0 - - 1 $680,000 $680,000 $680,000 5 5 105% 16 1 1 1 1 2 3 4 5
- 22. Toronto Real Estate Board Market Watch, January 2017 SUMMARY OF EXISTING HOME TRANSACTIONS DETACHED CONDOMINIUM, JANUARY 2017 CITY OF TORONTO MUNICIPAL BREAKDOWN 22 Sales Dollar Volume Average Price Median Price New Listings Active Listings Avg. SP / LP Avg. DOM TREB Total City of Toronto Total Toronto West Toronto W01 Toronto W02 Toronto W03 Toronto W04 Toronto W05 Toronto W06 Toronto W07 Toronto W08 Toronto W09 Toronto W10 Toronto Central Toronto C01 Toronto C02 Toronto C03 Toronto C04 Toronto C06 Toronto C07 Toronto C08 Toronto C09 Toronto C10 Toronto C11 Toronto C12 Toronto C13 Toronto C14 Toronto C15 Toronto East Toronto E01 Toronto E02 Toronto E03 Toronto E04 Toronto E05 Toronto E06 Toronto E07 Toronto E08 Toronto E09 Toronto E10 Toronto E11 2 $1,280,000 $640,000 $640,000 7 7 102% 22 0 - - - 0 0 - - 0 - - - 0 0 - - 0 - - - 0 0 - - 0 - - - 0 0 - - 0 - - - 0 0 - - 0 - - - 0 0 - - 0 - - - 0 0 - - 0 - - - 0 0 - - 0 - - - 0 0 - - 0 - - - 0 0 - - 0 - - - 0 0 - - 0 - - - 0 0 - - 0 - - - 0 0 - - 0 - - - 0 0 - - 0 - - - 0 0 - - 0 - - - 0 0 - - 0 - - - 0 0 - - 0 - - - 0 0 - - 0 - - - 0 0 - - 0 - - - 0 0 - - 0 - - - 0 0 - - 0 - - - 0 0 - - 0 - - - 0 0 - - 0 - - - 0 0 - - 0 - - - 0 0 - - 0 - - - 0 0 - - 0 - - - 0 0 - - 0 - - - 0 0 - - 0 - - - 0 0 - - 0 - - - 0 0 - - 0 - - - 0 0 - - 0 - - - 0 0 - - 0 - - - 0 0 - - 0 - - - 0 0 - - 0 - - - 0 0 - - 0 - - - 0 0 - - 0 - - - 0 0 - - 0 - - - 0 0 - - 0 - - - 0 0 - - 1 1 1 1 2 3 4 5
- 23. Toronto Real Estate Board Market Watch, January 2017 SUMMARY OF EXISTING HOME TRANSACTIONS CO-OWNERSHIP APARTMENT, JANUARY 2017 ALL TREB AREAS 23 Sales Dollar Volume Average Price Median Price New Listings Active Listings Avg. SP / LP Avg. DOM TREB Total Halton Region Burlington Halton Hills Milton Oakville Peel Region Brampton Caledon Mississauga City of Toronto Toronto West Toronto Central Toronto East York Region Aurora E. Gwillimbury Georgina King Markham Newmarket Richmond Hill Vaughan Whitchurch-Stouffville Durham Region Ajax Brock Clarington Oshawa Pickering Scugog Uxbridge Whitby Dufferin County Orangeville Simcoe County Adjala-Tosorontio Bradford West GwillimburyEssa Innisfil New Tecumseth 5 $1,473,000 $294,600 $275,000 5 8 99% 17 0 - - - 0 0 - - 0 - - - 0 0 - - 0 - - - 0 0 - - 0 - - - 0 0 - - 0 - - - 0 0 - - 0 - - - 0 0 - - 0 - - - 0 0 - - 0 - - - 0 0 - - 0 - - - 0 0 - - 5 $1,473,000 $294,600 $275,000 5 8 99% 17 2 $450,000 $225,000 $225,000 1 1 98% 16 3 $1,023,000 $341,000 $308,000 4 7 99% 18 0 - - - 0 0 - - 0 - - - 0 0 - - 0 - - - 0 0 - - 0 - - - 0 0 - - 0 - - - 0 0 - - 0 - - - 0 0 - - 0 - - - 0 0 - - 0 - - - 0 0 - - 0 - - - 0 0 - - 0 - - - 0 0 - - 0 - - - 0 0 - - 0 - - - 0 0 - - 0 - - - 0 0 - - 0 - - - 0 0 - - 0 - - - 0 0 - - 0 - - - 0 0 - - 0 - - - 0 0 - - 0 - - - 0 0 - - 0 - - - 0 0 - - 0 - - - 0 0 - - 0 - - - 0 0 - - 0 - - - 0 0 - - 0 - - - 0 0 - - 0 - - - 0 0 - - 0 - - - 0 0 - - 0 - - - 0 0 - - 0 - - - 0 0 - - 0 - - - 0 0 - - 1 1 1 1 2 3 4 5
- 24. Toronto Real Estate Board Market Watch, January 2017 SUMMARY OF EXISTING HOME TRANSACTIONS CO-OWNERSHIP APARTMENT, JANUARY 2017 CITY OF TORONTO MUNICIPAL BREAKDOWN 24 Sales Dollar Volume Average Price Median Price New Listings Active Listings Avg. SP / LP Avg. DOM TREB Total City of Toronto Total Toronto West Toronto W01 Toronto W02 Toronto W03 Toronto W04 Toronto W05 Toronto W06 Toronto W07 Toronto W08 Toronto W09 Toronto W10 Toronto Central Toronto C01 Toronto C02 Toronto C03 Toronto C04 Toronto C06 Toronto C07 Toronto C08 Toronto C09 Toronto C10 Toronto C11 Toronto C12 Toronto C13 Toronto C14 Toronto C15 Toronto East Toronto E01 Toronto E02 Toronto E03 Toronto E04 Toronto E05 Toronto E06 Toronto E07 Toronto E08 Toronto E09 Toronto E10 Toronto E11 5 $1,473,000 $294,600 $275,000 5 8 99% 17 5 $1,473,000 $294,600 $275,000 5 8 99% 17 2 $450,000 $225,000 $225,000 1 1 98% 16 0 - - - 0 0 - - 0 - - - 0 0 - - 0 - - - 0 0 - - 0 - - - 0 0 - - 1 $175,000 $175,000 $175,000 1 1 103% 2 0 - - - 0 0 - - 0 - - - 0 0 - - 0 - - - 0 0 - - 1 $275,000 $275,000 $275,000 0 0 95% 30 0 - - - 0 0 - - 3 $1,023,000 $341,000 $308,000 4 7 99% 18 1 $308,000 $308,000 $308,000 0 0 103% 34 0 - - - 0 0 - - 0 - - - 1 3 - - 1 $480,000 $480,000 $480,000 1 1 99% 15 0 - - - 0 0 - - 0 - - - 0 0 - - 1 $235,000 $235,000 $235,000 0 1 96% 6 0 - - - 0 0 - - 0 - - - 0 0 - - 0 - - - 0 0 - - 0 - - - 0 0 - - 0 - - - 1 1 - - 0 - - - 1 1 - - 0 - - - 0 0 - - 0 - - - 0 0 - - 0 - - - 0 0 - - 0 - - - 0 0 - - 0 - - - 0 0 - - 0 - - - 0 0 - - 0 - - - 0 0 - - 0 - - - 0 0 - - 0 - - - 0 0 - - 0 - - - 0 0 - - 0 - - - 0 0 - - 0 - - - 0 0 - - 0 - - - 0 0 - - 1 1 1 1 2 3 4 5
- 25. Toronto Real Estate Board Market Watch, January 2017 FOCUS ON THE MLS HOME PRICE INDEX INDEX AND BENCHMARK PRICE, JANUARY 2017 ALL TREB AREAS 25 Composite Single-Family Detached Single-Family Attached Townhouse Apartment Index Benchmark Yr./Yr. % Chg. Index Benchmark Yr./Yr. % Chg. Index Benchmark Yr./Yr. % Chg. Index Benchmark Yr./Yr. % Chg. Index Benchmark Yr./Yr. % Chg. TREB Total Halton Region Burlington Halton Hills Milton Oakville Peel Region Brampton Caledon Mississauga City of Toronto York Region Aurora East Gwillimbury Georgina King Markham Newmarket Richmond Hill Vaughan Whitchurch-Stouffville Durham Region Ajax Brock Clarington Oshawa Pickering Scugog Uxbridge Whitby Dufferin County Orangeville Simcoe County Adjala-Tosorontio Bradford West GwillimburyEssa Innisfil New Tecumseth 226.1 $681,400 21.82% 244.5 $914,200 25.32% 244.5 $693,700 22.74% 222.6 $500,900 22.71% 199.3 $400,600 18.70% 244.4 $809,800 22.63% 246.2 $937,100 22.85% 245.1 $639,900 23.54% 238.8 $511,000 21.53% - - - 236.2 $712,400 21.13% 236.8 $830,500 21.06% 233.8 $571,500 20.39% 236.2 $486,700 22.00% - - - 229.7 $681,100 22.12% 226.1 $758,100 22.41% 231.0 $571,500 23.07% 240.5 $434,700 21.34% - - - 228.6 $672,800 20.76% 227.4 $796,200 20.96% 236.1 $590,400 22.33% 217.0 $380,300 20.49% - - - 257.7 $948,900 23.83% 260.6 $1,104,000 24.04% 262.9 $719,900 26.52% 242.8 $595,700 20.86% - - - 219.8 $618,800 22.66% 227.5 $800,500 23.17% 231.3 $588,300 24.76% 218.2 $476,700 22.58% 192.4 $332,600 20.63% 218.7 $556,700 23.56% 218.8 $638,500 23.83% 224.6 $527,100 24.92% 210.7 $391,300 23.94% 165.6 $259,200 18.88% 203.5 $726,300 25.23% 203.1 $747,300 25.06% 237.2 $586,500 30.62% - - - - - - 221.4 $648,600 21.98% 241.8 $965,700 23.12% 237.9 $655,100 23.52% 221.2 $503,700 23.16% 195.4 $343,800 20.84% 217.3 $712,100 16.33% 247.2 $1,075,200 23.54% 247.2 $820,600 20.41% 222.3 $538,000 21.28% 201.2 $414,700 20.99% 256.4 $880,700 21.34% 276.0 $1,085,300 29.03% 272.4 $789,400 26.23% 223.5 $568,300 18.69% 191.0 $414,300 13.89% 263.2 $847,200 30.17% 265.4 $986,000 31.13% 268.2 $693,500 29.19% 242.4 $613,900 47.45% 199.7 $413,000 19.08% 230.0 $745,500 27.49% 230.3 $759,000 25.71% 239.0 $506,000 25.72% - - - - - - 231.6 $480,900 30.63% 241.3 $497,300 29.11% 245.5 $483,800 28.33% - - - - - - 233.9 $991,600 24.48% 234.5 $989,500 24.01% 244.0 $571,400 22.12% - - - - - - 262.7 $906,100 19.74% 301.1 $1,237,800 31.77% 281.6 $842,200 25.83% 215.8 $538,000 9.16% 193.1 $445,100 16.54% 242.4 $714,900 25.01% 249.1 $838,600 29.54% 253.4 $597,500 26.64% 229.9 $464,200 20.05% 204.1 $343,800 19.50% 272.1 $986,700 21.69% 316.5 $1,345,300 32.32% 294.5 $895,000 29.74% 212.7 $595,400 21.61% 182.1 $379,300 13.25% 242.0 $875,700 17.19% 245.9 $1,023,600 24.25% 262.2 $794,400 23.91% 247.0 $671,900 28.71% 195.2 $433,400 9.54% 265.5 $1,001,000 25.12% 265.2 $1,017,700 25.45% 231.6 $636,100 21.26% - - - - - - 220.5 $518,900 26.43% 218.5 $569,700 26.30% 231.5 $463,600 26.16% 218.3 $356,700 35.34% 200.0 $359,500 25.94% 228.7 $565,200 23.49% 227.8 $610,100 24.07% 238.6 $513,100 23.12% 227.9 $416,500 30.23% 184.4 $313,100 22.04% 170.9 $322,900 19.76% 171.8 $325,300 19.80% - - - - - - - - - 214.0 $452,800 24.27% 206.4 $496,000 22.57% 220.1 $420,300 21.13% 225.7 $404,100 40.45% 207.2 $293,200 30.31% 222.3 $425,800 30.30% 219.6 $467,800 29.56% 234.2 $392,500 30.04% 205.7 $275,300 46.93% 190.2 $256,600 21.69% 226.0 $611,000 26.75% 224.7 $702,200 26.73% 236.1 $550,000 28.04% 228.1 $409,500 27.36% 215.0 $421,000 29.99% 195.4 $509,800 21.44% 201.2 $520,900 22.01% 194.4 $406,800 22.88% - - - - - - 201.8 $617,000 22.15% 200.2 $620,100 21.19% 197.2 $483,900 22.94% - - - - - - 221.9 $580,000 28.79% 226.4 $650,400 30.72% 230.5 $507,800 29.42% 203.9 $370,200 25.79% 189.5 $369,600 22.89% 220.4 $505,100 24.80% 230.6 $525,500 24.99% 208.3 $390,400 21.18% - - - - - - 220.4 $505,100 24.80% 230.6 $525,500 24.99% 208.3 $390,400 21.18% - - - - - - 221.2 $471,600 28.46% 213.0 $471,900 28.16% 235.0 $451,000 29.91% - - - - - - 180.7 $641,300 21.68% 180.7 $641,300 21.68% - - - - - - - - - 244.6 $607,900 23.35% 222.6 $681,800 23.67% 247.9 $515,400 23.52% - - - - - - 213.9 $501,000 25.38% 209.2 $529,000 25.04% 218.7 $372,600 28.42% - - - - - - 215.7 $399,000 31.44% 216.6 $401,400 32.07% 240.9 $374,700 35.11% - - - - - - 201.2 $464,700 26.46% 195.0 $502,300 25.73% 210.3 $401,500 26.53% - - - - - -
- 26. Toronto Real Estate Board Market Watch, January 2017 FOCUS ON THE MLS HOME PRICE INDEX INDEX AND BENCHMARK PRICE, JANUARY 2017 CITY OF TORONTO 26 Composite Single-Family Detached Single-Family Attached Townhouse Apartment Index Benchmark Yr./Yr. % Chg. Index Benchmark Yr./Yr. % Chg. Index Benchmark Yr./Yr. % Chg. Index Benchmark Yr./Yr. % Chg. Index Benchmark Yr./Yr. % Chg. TREB Total City of Toronto Toronto W01 Toronto W02 Toronto W03 Toronto W04 Toronto W05 Toronto W06 Toronto W07 Toronto W08 Toronto W09 Toronto W10 Toronto C01 Toronto C02 Toronto C03 Toronto C04 Toronto C06 Toronto C07 Toronto C08 Toronto C09 Toronto C10 Toronto C11 Toronto C12 Toronto C13 Toronto C14 Toronto C15 Toronto E01 Toronto E02 Toronto E03 Toronto E04 Toronto E05 Toronto E06 Toronto E07 Toronto E08 Toronto E09 Toronto E10 Toronto E11 226 $681,400 21.82% 245 $914,200 25.32% 245 $693,700 22.74% 223 $500,900 22.71% 199 $400,600 18.70% 217 $712,100 16.33% 247 $1,075,200 23.54% 247 $820,600 20.41% 222 $538,000 21.28% 201 $414,700 20.99% 180 $735,100 8.16% 211 $1,087,500 20.23% 230 $886,300 21.79% 204 $419,800 7.43% 162 $378,500 10.18% 215 $776,200 6.16% 238 $978,500 13.58% 272 $834,100 14.46% 173 $477,500 6.52% 163 $659,900 12.52% 241 $625,500 18.24% 251 $683,200 19.90% 248 $634,100 17.08% 147 $355,600 10.22% 174 $331,900 21.32% 215 $563,700 19.42% 229 $723,300 21.14% 220 $638,900 16.61% 187 $453,700 4.77% 198 $291,200 30.67% 200 $476,300 19.10% 222 $739,400 21.40% 205 $599,900 21.71% 203 $333,200 15.64% 179 $235,100 26.06% 165 $480,800 3.79% 257 $814,100 25.43% 210 $637,600 20.58% 228 $670,300 34.06% 135 $340,800 13.27% 209 $889,000 16.47% 235 $1,014,400 23.98% 209 $858,600 16.72% 160 $587,800 32.59% 121 $491,900 12.31% 178 $725,800 12.98% 203 $1,061,300 17.35% 192 $730,300 8.89% 193 $470,600 34.05% 163 $327,700 13.69% 204 $523,500 16.29% 214 $801,700 15.09% 190 $531,200 12.73% 215 $556,600 15.88% 183 $234,100 20.45% 203 $465,500 19.95% 223 $669,400 20.84% 224 $579,100 23.78% 186 $393,300 25.83% 183 $254,600 19.74% 228 $564,300 18.41% 252 $890,600 24.29% 251 $874,800 13.56% 221 $657,200 21.61% 227 $472,500 21.08% 226 $1,074,500 13.55% 213 $1,689,900 14.19% 248 $1,302,800 15.70% 215 $1,004,000 9.43% 222 $618,200 16.50% 246 $1,267,100 16.35% 243 $1,461,500 17.04% 258 $953,600 17.41% - - - 243 $641,400 15.95% 225 $1,396,500 16.97% 236 $1,646,300 18.28% 235 $1,122,000 17.94% 210 $784,900 29.05% 189 $449,400 18.79% 247 $985,700 22.02% 285 $1,218,600 33.60% 211 $788,200 11.46% - - - 216 $476,700 13.59% 217 $744,600 12.62% 313 $1,431,500 33.69% 226 $806,300 22.00% 200 $587,300 22.46% 182 $427,500 12.87% 213 $531,500 20.16% 252 $1,472,600 15.41% 251 $1,219,900 14.49% 239 $723,300 37.15% 211 $466,300 20.87% 151 $1,117,600 9.14% 126 $1,586,500 0.00% 137 $1,116,500 -5.96% 184 $948,800 15.31% 162 $536,700 10.35% 227 $886,300 11.92% 246 $1,507,100 16.07% 237 $1,171,000 13.23% 232 $532,100 0.17% 222 $531,900 13.15% 212 $758,200 13.82% 192 $1,284,100 6.57% 214 $947,900 5.53% 155 $247,500 23.08% 226 $322,300 17.67% 219 $1,876,000 26.60% 210 $2,253,700 26.55% 290 $1,242,600 47.63% 267 $902,700 26.90% 207 $650,700 16.24% 227 $837,500 27.53% 276 $1,480,400 41.26% 263 $842,900 42.93% 252 $716,400 32.28% 184 $363,000 19.70% 218 $741,200 17.51% 320 $1,737,700 37.23% 247 $1,205,000 21.38% 255 $860,000 16.69% 195 $491,400 19.80% 209 $698,100 10.59% 325 $1,521,100 39.69% 276 $897,600 30.48% 242 $595,200 21.35% 167 $389,100 15.54% 268 $834,200 16.77% 283 $977,100 18.86% 291 $913,700 19.93% 262 $529,000 29.44% 222 $527,300 15.36% 250 $930,200 18.47% 214 $943,300 12.97% 257 $859,200 16.18% 281 $899,100 38.57% 250 $684,300 15.49% 239 $735,200 16.10% 256 $859,600 20.09% 226 $735,600 12.95% - - - 177 $264,000 9.42% 231 $579,700 20.57% 245 $722,800 24.58% 240 $582,100 22.84% 219 $473,600 14.65% 210 $318,400 13.62% 230 $614,000 22.32% 268 $944,500 28.61% 261 $719,900 29.60% 234 $508,300 17.96% 186 $364,500 17.41% 242 $683,900 19.02% 249 $710,500 22.16% 250 $594,800 22.55% 224 $552,700 11.08% 198 $436,600 -1.49% 230 $567,000 14.96% 270 $883,300 18.95% 257 $672,300 18.63% 239 $516,900 17.13% 200 $342,300 18.14% 222 $544,100 19.21% 240 $748,300 21.24% 211 $540,700 17.47% 208 $425,000 10.10% 199 $317,100 26.26% 207 $498,900 14.97% 241 $687,000 21.00% 231 $567,600 24.69% 228 $420,900 23.53% 182 $342,100 17.00% 237 $670,700 20.62% 233 $745,900 17.44% 226 $587,000 19.73% 261 $457,000 29.54% 188 $303,700 33.62% 212 $467,800 15.83% 243 $673,400 20.89% 233 $527,300 21.08% 189 $372,000 23.00% 191 $285,700 20.23%
- 27. Toronto Real Estate Board Market Watch, January 2017 HISTORIC ANNUAL STATISTICS 27 Year Sales Average Price 2005 2006 2007 2008 2009 2010 2011 2012 2013 2014 2015 84,145 $335,907 83,084 $351,941 93,193 $376,236 74,552 $379,347 87,308 $395,460 85,545 $431,276 89,096 $465,014 85,496 $497,130 87,049 $522,958 92,782 $566,624 101,213 $622,121 2016 MONTHLY STATISTICS NOTES 1 - Sales, dollar volume, average sale prices and median sale prices are based on firm transactions entered into the TREB MLS® system between the first and last day of the month/period being reported. 2 - New listings entered into the TREB MLS® system between the first and last day of the month/period being reported. 3 - Active listings at the end of the last day of the month/period being reported. 4 - Ratio of the average selling price to the average listing price for firm transactions entered into the TREB MLS® system between the first and last day of the month/period being reported. 5 - Average number of days on the market for firm transactions entered into the TREB MLS® system between the first and last day of the month/period being reported. 6 - Due to past changes to TREB's service area, caution should be exercised when making historical comparisons. 7 - Past monthly and year-to-date figures are revised on a monthly basis. 8 - SNLR = Sales-to-New Listings Ratio. Calculated using a 12-month moving average (sales/new listings). 9 - Mos. Inv. = Months of Inventory. Calculated using a 12-month moving average (active listings/sales). 2017 MONTHLY STATISTICS *For historic annual sales and average price data over a longer time frame go to: January February March April May June July August September October November December Year to Date 5,188 $770,745 - - - - - - - - - - - - - - - - - - - - - - 5,188 $770,745 January February March April May June July August September October November December Annual 4,640 $630,193 7,583 $685,738 10,260 $688,011 12,017 $739,767 12,792 $752,323 12,729 $746,965 9,932 $710,556 9,750 $711,001 9,833 $756,218 9,722 $762,767 8,514 $777,031 5,319 $730,537 113,091 $729,917 1,6,7 1,7 1,7 http://www.torontorealestateboard.com/market_news/market_watch/historic_stats/p df/TREB_historic_statistics.pdf Copyright® 2017 Toronto Real Estate Board $770,7455,188