Security Hands-On - Splunklive! Houston
•Download as DOCX, PDF•
2 likes•1,162 views

Hands On Instructions for attendees at SplunkLive! Houston

Recommended
Recommended
More Related Content
What's hot
What's hot (20)
Viewers also liked
Viewers also liked (17)
Similar to Security Hands-On - Splunklive! Houston
Similar to Security Hands-On - Splunklive! Houston (20)
More from Splunk
More from Splunk (20)
Recently uploaded
Recently uploaded (20)
Security Hands-On - Splunklive! Houston
- 1. splunklive! Security Hands-On Handout May, 2015 1 Hands-On with Splunk: Security Analytics Session May 5th: SplunkLive! Houston Introduction A strong security posture and disruption of the adversary kill chain depends on four categories of data sources that have to be combined and integrated. The sources are: Network, Endpoint, Asset and Identity Management and Threat Intelligence. For the purposes of this session, our log sources will be a small data set already loaded in our Splunk demo instance containing: Network: Web portal logs, web proxy logs, dns logs, email events; Endpoint Threat Detection & Response: Windows Sysmon; Asset/Identity Management: Via an asset lookup; and Threat Intelligence: Via a threat intel lookup. We are playing the role of a security analyst employed by a video gaming company called “Buttercup Games.” Analysts and incident investigators can use Splunk as a security analytics platform, to leverage these disparate data sources to disrupt the adversary kill chain. This hands-on exercise shows a real world investigation scenario for the Zeus malware. We begin the investigation by searching for events for new threat intelligence and investigate the infection and identify the complete adversary kill chain. The key points in this exercise are:
- 2. splunklive! Security Hands-On Handout May, 2015 2 Splunk is used to discover and disrupt the attackers kill chain; Splunk is used to produce new threat intelligence; and Splunk is used for incident investigation across the security stack. Accessing the session servers We will all be accessing the same Splunk servers, behind a load balancer, for this hands-on session. We will all use the same username and password. The URL and credentials can be found below. URL: (Will be provided during session) Username: splunklive Password: splunksecurity1 Please be kind to your fellow session-mates and do not run Splunk searches that will affect the systems negatively. Document Conventions Descriptive Text Instructive Text: Description of what to do in the GUI Search text: What to type Click text: What to click on
- 3. splunklive! Security Hands-On Handout May, 2015 3 Exercise 1: Finding IOC (C&C communication) and Actions on Intent Step What to click Description Display 1a Log in to Splunk using the credentials above. The Search page in the Zeus Demo app should be displayed. Splunk helps organizations drastically reduce the time to respond to cyber attacks, helping identify the initial threats, investigate the impact, and ultimately discover the root cause of each attack, so action can be taken. A strong security posture depends on analyzing four categories of data sources: Network, Endpoint, Asset & Identity Management and Threat Intelligence. Without a solution like Splunk, many organizations struggle to gain the visibility needed to protect their organization from current and future attacks, with investigators spending hours, days, or even weeks to find and accurately identify a single threat. Splunk is the only security analytics platform that enables analysts and incident investigators to find correlations across these disparate sources in real-time, enabling organizations to not only detect attacks, but to identify and disrupt the adversary’s kill chain. In this hands-on exercise, we will be using
- 4. splunklive! Security Hands-On Handout May, 2015 4 Step What to click Description Display anonymous data from a real world investigation of a Zeus attack, to show you how Splunk drastically reduces the time to respond. We will use Splunk to detect a new threat, investigate the impact, and discover the root cause. Once we determine the adversary’s kill chain, we can create our own threat intelligence to disrupt the adversary’s kill chain and secure our organization in the future. 1b In the Splunk search bar, type (or copy/paste) the search below and click the magnifying glass to the far right OR press Enter. index=zeus_demo3 In this scenario, we just received new threat intelligence from one of our sources, and want to see if any systems in our environment are impacted by this new threat intelligence. We will begin our investigation with a simple search of all security data. 1c The Splunk Fields Sidebar appears to the left of the browser window. Clicking on any of the sourcetypes pulls up the Field Summary for that field. Bring up the Field Summary for the sourcetype field. Click and expand sourcetype field. In this hands-on environment, we have a variety of security relevant data being consumed by Splunk including web logs, Sysmon endpoint visibility, DNS, proxy, and messaging infrastructure. This is static data, by the way – just to keep things simple.
- 5. splunklive! Security Hands-On Handout May, 2015 5 Step What to click Description Display 1d Click on XmlWinEventLog:Micros oft-Windows- Sysmon/Operational Next, we will explore the events coming to Splunk from endoints. 1e Scroll down and click on tag field ‘tag’ We have endpoint visibility into all network communication and can map each connection back to a process. We also have detailed info on each process and can map it back to the user and parent process. 1f Click on Threat Intelligence Overview in the menu Lets get our day started by looking using threat intel to prioritize our efforts and focus on communication with known high risk entities.
- 6. splunklive! Security Hands-On Handout May, 2015 6 Step What to click Description Display 1g This dashboard is based on the same type of search we just ran, but enriches the data with additional threat intel lists, CMDB systems and identity data. With this enhanced data, we can graphically show potential compromises. Having this capability is key as it enables us to prioritize investigations not just based on the threat criticality, but also based on what will have the greatest value or impact to the business. We can now see who is the owner of the system at IP 192.168.56.102 (Chris Gilbert) and that it isn’t part of our PII or PCI assets, so there are no immediate business implications that would require informing agencies or external customers within a certain timeframe. This information comes from a “lookup” defined within Splunk.
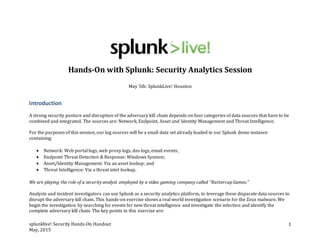
- 7. splunklive! Security Hands-On Handout May, 2015 7 Recap: Finding IOC (C&C communication) and Actions on Intent Figure1 - Finding IOC and Actions on Intent
- 8. splunklive! Security Hands-On Handout May, 2015 8 Exercise 2: Endpoint Behavior and Method of Exploitation Step What to click Description Display 2a Click on the firs IP address in the table Let’s drill down into the system we saw communicating with the Zeus botnet to see if we can get to the root cause of this compromise as well as understand what other related risks might exist. We see multiple threat intel related events across multiple source types associated with the IP Address of Chris Gilbert. Let’s take closer look at the IP Address. 2b Scroll down on the page and view the All Threat Events panel. It’s worth mentioning that at this point you could create a ticket to have someone re-image the machine to prevent further damage as we continue our investigation within Splunk. We can see events correlated from Sysmon and Bluecoat proxy events. Sysmon is used here as an Endpoint Threat Detection and Response technology (ETDR). Sysmon is a Windows system service that logs system activity to the Windows Event
- 9. splunklive! Security Hands-On Handout May, 2015 9 Step What to click Description Display Log. This exercise uses Sysmon events, but similar information can come from other ETDR tools you may be using. 2c Click on ‘>’ next to the second event from the top The initial goal of the investigation is to determine whether this communication is malicious or a potential false positive. Expand the endpoint event to continue the investigation. We immediately see the outbound communication with 115.29.46.99 via https is associated with the svchost.exe process on the windows endpoint. The process id is 4768. There is a great deal more information from the endpoint as you scroll down such as the user ID that started the process and the associated CMDB enrichment information. Exfiltration of data is a serious concern and outbound communication to external entity that has a known threat intel indicator, especially when it is
- 10. splunklive! Security Hands-On Handout May, 2015 10 Step What to click Description Display encrypted as in this case. Another clue. We also see that svchost.exe should be located in a Windows system directory but this is being run in the user space. Not good. 2d Click on ‘Event Actions’ and then on ‘Explore Process: 4768’ Lets continue the investigation. We have a workflow action that will link us to a Process Explorer dashboard and populate it with the process id extracted from the event (4768).
- 11. splunklive! Security Hands-On Handout May, 2015 11 Step What to click Description Display 2e This has brought us to the Process Explorer dashboard which lets us view Windows Sysmon endpoint data. This process calls itself “svchost.exe,” a common Windows process, but the path is not the normal path for svchost.exe.
- 12. splunklive! Security Hands-On Handout May, 2015 12 Step What to click Description Display …which is a common trait of malware attempting to evade detection. We also see it making a DNS query (port 53) then communicating via port 443. We also can see that the parent process that created this suspicious svchost.exe process is called calc.exe. This is a standard Windows app, but not in its usual directory, telling us that the malware has again spoofed a common file name. In our case svchost.exe is the suspected malware and calc.exe is the suspected downloader/dropper. This is very consistent with Zeus behavior. The initial exploitation generally creates a downloader or dropper that will then download the Zeus malware. It seems like calc.exe may be that downloader/dropper.
- 13. splunklive! Security Hands-On Handout May, 2015 13 Step What to click Description Display 2f Click on ‘Process ID’ 4000 Lets continue the investigation by examining the parent process as this is almost certainly a genuine threat and we are now working toward a root cause. 2g The Parent Process of our suspected downloader/dropper is the legitimate PDF Reader program. This will likely turn out to be the vulnerable app that was exploited in this attack. We have very quickly moved from threat intel related network and endpoint activity to the likely exploitation of a vulnerable app. 2h Click on ‘Process ID’ 4123 Click on the parent process to keep investigating.
- 14. splunklive! Security Hands-On Handout May, 2015 14 Step What to click Description Display 2i We can see that the PDF Reader process has no identified parent and is the root of the infection. 2j Scroll down. Click on ‘>’ next to the event to expand Scroll down the dashboard to examine activity related to the PDF reader process. Chris opened 2nd_qtr_2014_report.pdf which was an attachment to an email! We have our root cause! Chris opened a weaponized .pdf file which contained the Zeus malware. It appears to have been delivered via email and we have access to our email logs as one of our important data sources. Lets copy the filename 2nd_qtr_2014_report.pdf and search a bit further to determine the scope of this compromise.
- 15. splunklive! Security Hands-On Handout May, 2015 15 Recap: Endpoint Behavior and Method of Exploitation Figure2 - Endpoint Behavior and Exploitation Method
- 16. splunklive! Security Hands-On Handout May, 2015 16 Exercise 3: Reconnaissance, Weaponization, Delivery Step What to click Description Display 3a Get back to your Search page within the Zeus Demo app, and enter this into the search blank and press enter: 2nd_qtr_2014_report.pdf We know the malicious file that started this. But where did this file come from? Let’s change our search to find all events that contain the file name 2nd_qtr_2014_report.pdf 3b Bring up the Field Summary for the sourcetype field. Click and expand sourcetype field. Click on ‘email’ We quickly determine that this file name exists in multiple sources including our web logs, Sysmon, and email. We will come back to the web activity that contains reference to the pdf file but lets first look at the email event to determine the scope of this apparent phishing attack.
- 17. splunklive! Security Hands-On Handout May, 2015 17 Step What to click Description Display 3c Click on Show all 60 lines to expand the event. Review the full event and view that this mail came from a fake domain “jose.dave@butercupgames.com.” Hold On! That’s not our Domain Name (not buttercupgames.com)! The spelling is close but it’s missing a “t”. The attacker likely registered a domain name that is very close to the company domain hoping Chris would not notice. This looks to be a very targeted spear phishing attack as it was sent to only one employee (Chris). We have access to the email body and
- 18. splunklive! Security Hands-On Handout May, 2015 18 Step What to click Description Display can see why this was such a convincing attack. The sender apparently had access to sensitive insider knowledge and hinted at quarterly results. There is our attachment. 3d Enter this into the search blank and press enter: 2nd_qtr_2014_report.pdf Bring up the Field Summary for the sourcetype field. Click and expand sourcetype field. Click on ‘access_combined’ Lets revisit the search for additional information on the 2nd_qtr_2014- _report.pdf file. We understand that the file was delivered via email and opened at the endpoint. Why do we see a reference to the file in the access_combined (web server) logs? Select the access_combined sourcetype to investigate further. 3e The results show 54.211.114.134 has accessed this file from the web portal of buttergames.com.
- 19. splunklive! Security Hands-On Handout May, 2015 19 Step What to click Description Display Scroll down click on ‘threat_intel_source’ There is also a known threat intel association with the source IP Address downloading (HTTP GET) the file. 3f Select the IP Address, left- click, then select “New search”. We would like to understand what else this IP Address has accessed in the environment. 3g That’s an abnormally large number of requests sourced from a single IP Address in a ~90 minute window.
- 20. splunklive! Security Hands-On Handout May, 2015 20 Step What to click Description Display This looks like a scripted action given the constant high rate of requests over the below window. Notice the Googlebot useragent string, which is another attempt to avoid raising attention. 3h Bring up the Field Summary for the uri_path field. Click and expand uri_path field. By selecting the uri_path, we can investigate which pages this IP address accessed. We see that the largest number of requests were for the wp-login.php page. The volume over such a narrow window of time (again, refer to the timeline) is not humanly possible. This was clearly a brute force attack. Once successful the attacker evidently downloaded the Report PDF file, and then weaponized it.
- 21. splunklive! Security Hands-On Handout May, 2015 21 Recap: Reconnaissance, Weaponization, Delivery Figure3 - Reconnaissance, Weaponization, Delivery Now we have the complete picture and the entire kill chain for this attacker. Using Splunk, with simple intuitive searches and UI clicks, we discovered that this was a two-phased attack: first the attacker compromised the web portal and then subsequently compromised Chris’s machine. In addition to identifying the attack, we developed new threat intelligence to help us prevent future attacks from the same IP and improve our security posture.
- 22. splunklive! Security Hands-On Handout May, 2015 22 Conclusion In review, here are the steps that we uncovered about our adversary, mapped to the major portions of the Kill Chain. Figure4 - Summaryof Kill Chain Without Splunk, this analysis would take countless man-hours just to get part of the picture—and evaluating the entire kill chain would be almost impossible to do.