This document provides an overview of research being conducted to understand the impact of leadership on shareholder value at technology companies. The researchers analyze Microsoft's stock price and financial performance from 2014 to 2019 after Satya Nadella became CEO. They calculate Microsoft's implied value based on past growth rates and find the actual value exceeded this, with the difference attributed to Nadella's leadership. The researchers plan to evaluate the effects of product launches, acquisitions, and speeches under Nadella and his predecessor to quantify the value added by Nadella's management style.
1. Relating Impact of Leadership with Shareholder Value in Technology Companies
Draft for Discussion Purpose Only Confidential and Private Information
This document provides a glimpse of the research work currently in progress and the sole intention of this document is to illustrate our
interest in studying the area of leadership and value creation.
Research at the Indian School of Business
This research is initiated by ISB-PGP students Mr Dipesh Dassani and Mr Unmesh Mitra under the guidance of
Professor Deepa Mani - Executive Director, Srini Raju Centre for IT and the Networked Economy.
This document provides a glimpse of the research work currently in progress, and the sole intention of this document
is to illustrate our interest in studying the area of leadership and value creation.
Last few decades have seen the rise of giants who have spun the industrial era to a technological age. Giants such
as Microsoft, Apple, Google and Amazon have become ubiquitous in the space of human consciousness; and one
must be living under a rock not to be aware of them even though the rock might be as it would be mapped by
Google. How did these giants come to be and what led to their stupendous growth for decades?
Of course, technological innovation is at the core of it – be it Moore’s law or the advent of internet but we won’t
get into the intricacies of such innovations, the reason being the existing giants of the 60s-the 70s could have used
the same tech to penetrate all human lives, but they didn’t. So, what led to this all-inclusive tech phenomenon?
What comes to mind are names like Bill Gates, Steve Jobs, Jeff Bezos, and how their life stories shaped the tech
world we know today. Personal computers are attributed to the rivalry of Gates and Jobs and often compared to that
of Edison and Tesla; Bezos’s story starts from his house's garage as do Jobs, as did Microsoft, Google and Apple.
Tech giants remain concerned about the presence of a disruptor working on a technology that would take the
technology world by storm. Passionate leaders have an essence that effectively communicates their core values to
the entire organization.
It’s thought-provoking to investigate the impact of leaders of these organizations. Investors pay the share price for
ownership of a particular organization. Different investors have contradictory, or various assumptions about the
growth prospects of an organization and hence few may think that the current market price may or may not reflect
the actual market price. Questions such as how much value do the shareholders give to the quality of management;
intangibles are unknown. The dynamism, agility, wisdom, thought leadership, innovation, and improvement of great
leaders are difficult elements to quantify. With time these invaluable leadership qualities transform into a
competitive advantage and add shareholder value.
Financial market participants find it challenging to quantify the impact of leadership abilities in the growth of future
cash flows of an organization. It’s a difficult number to arrive at - the growth rate of the terminal value year. Exit
multiples would not provide an opportunity to built in the uniqueness of an organization into its valuation. Quality
of earnings depends on many factors, and one of them is the capability of leadership or management team.
We begin our work with asking some interesting questions that we are wondering about: How much premium
investors attribute to an independent board, to the presence of hallmark leaders, to collaboration with research
institutes and government agencies, and other various factors that provide additional cash flows in the distant future.
This research paper makes an attempt to understand the impact of hallmark leaders on the market value of their
organizations.
2. Relating Impact of Leadership with Shareholder Value in Technology Companies
Draft for Discussion Purpose Only Confidential and Private Information
This document provides a glimpse of the research work currently in progress and the sole intention of this document is to illustrate our
interest in studying the area of leadership and value creation.
We started our analysis with Microsoft understanding value-added by Satya Nadell’s leadership to the Company
post his role as CEO during February 2014.
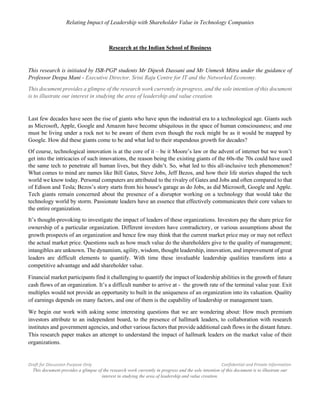
Chart 1: Showing Microsoft’s Share Price Movement from 2001-2019
The share price was ~$43 during June 30, 2014, and increased to $138 on June 30, 2019 – a robust return of 220%
over five years; during this period it's market capitalization increased from ~$356 Billion to ~$1054 billion.
What led to the increase in share price over such a short period of time?
New product launches, acquisitions, improving global macro and industry scenario or change in the management
team – the answer lies in understanding and relating the financial impact of these components.
We have divided our analysis into the following phases:
1) Determine the terminal year growth rate (implied growth rate)
2) Calculate Microsoft’s value basis the implied growth rate
(At this stage we would get the GAP in Microsft’s value basis the implied growth rate and its actual market
value)
3) Evaluate the impact of product launches, acquisitions, and strategic partnerships on share price
4) Behavioural analysis of speeches of Satya Nadella and Steve Balmer
5) Computation of the residual value attributed to Satya Nadella’s management style
2.00
22.00
42.00
62.00
82.00
102.00
122.00
142.00
Microsoft Corporation (NasdaqGS:MSFT) - Share Pricing
3. Relating Impact of Leadership with Shareholder Value in Technology Companies
Draft for Discussion Purpose Only Confidential and Private Information
This document provides a glimpse of the research work currently in progress and the sole intention of this document is to illustrate our
interest in studying the area of leadership and value creation.
Phase 1: Determine the terminal year growth rate (implied growth rate)
An investor valuing the stock on June 30, 2006, would discount the future cash flows to arrive at the enterprise
value of Microsoft. Let’s assume that she discounted cash flows:
• From years 2007 to 2011 (we would refer to this as component A), and
• Arrive at the terminal value of Microsoft at the end of the year 2011 (we would see this as component B).
let’s look at the actual enterprise value of Microsoft as of June 30, 2006:
Table:1 Calculation of Microsoft’s Enterprise Value
Calculation of Microsoft’s Enterprise Value as of June 30, 2006
Share Price $26
Shares Oustanding ( Million) 9970
Market Capitalization $258 Billion
Cash and Equivalents $6.7 Billion
Enterprise Value $251 Billion
Assume that investor has the Oracle and predicts the actual cash flows from yr 2007 to 2011. She then takes the
weighted average cost of capital as 12.16%(WACC)1
and discounts the cash flows to get the value of component A.
Table:2 Calculation of Microsoft’s actual Free Cash Flows from 2007 to 2012
It’s essential to take note and re-emphasize that our investor has actually predicted the actual free cash flow of
Microsoft for the years 2006 to 2012. The present value of cash flow for the year 2007 to 2011 (value of component
A) is $ 68 Billion.
The difference between the enterprise value as of 2006, i.e. $ 251 Billion and component A, i.e. $68 Billion, is the
terminal value of $182 Billion.
1
Considered average return on Nasdaq from 2003 to 2006 as opportunity cost of investing in Microsoft, since the
hypothetical investor knows the real six year cash flows of the organization. (For more details please refer appendix A)
Free Cash Flow Statement 30-Jun 30-Jun 30-Jun 30-Jun 30-Jun 30-Jun 30-Jun
Free Cash Flow to the firm Units 2006 2007 2008 2009 2010 2011 2012
Cash Flow from Operations USD Mn 14404 17796 21612 19037 24073 26994 31626
Effective Tax Rate (A) % 31% 30% 26% 26% 25% 18% 24%
Interest Expense (B) USD Mn 230 106 38 151 295 380
(B)*(1-A) USD Mn 161 79 28 113 243 290
CAPEX USD Mn 1578 2264 3182 3119 1977 2355 2305
FCFF USD Mn 12826 15693 18509 15946 22209 24882 29611
Debt USD Mn 3746 4939 11921 10713
Cash And Equivalents USD Mn 6714 6111 10339 6076 5505 9610 6938
4. Relating Impact of Leadership with Shareholder Value in Technology Companies
Draft for Discussion Purpose Only Confidential and Private Information
This document provides a glimpse of the research work currently in progress and the sole intention of this document is to illustrate our
interest in studying the area of leadership and value creation.
We then take this terminal value ahead to the year 2011 and get the terminal value of $364 Billion as of 30th
June
2011 (this is the value of component B of our analysis). Applying the terminal value growth rate on 2012’s free
cash flow to get to the terminal value of $364 billion, we get the implied growth rate of 4.03%.
Phase 2: Derive Microsoft’s value basis the implied growth rate
Next, we derive Microsoft’s cash flows for the year 2013 to 2018 basis the terminal value growth rate of 4.03%.
We would focus on the years' post-Satya Nadella’s appointment as CEO, i.e. 2014. Basis the implied terminal year
growth rate, we computed its enterprise value from 2015 to 2018. This gives us the value of the organization basis
the growth rate built-in by the investors during 2006, and increase in market capitalization of Microsoft over and
above this is attributed to launch of new products and to the Impact of Satya Nadella’s leadership style. Through
our analysis we have assumed Microsft’s WACC2
(weighted average cost of capital) as the discount rate.
Table 3: Microsoft's Value Basis the Implied Growth Rate and GAP between its Actual and Implied Equity Value
Units Jun-30-2015 Jun-30-2016 Jun-30-2017 Jun-30-2018
Implied FCFF
$ Million
$27,491 $24,239 $25,978 $33,272
Enterprise Value
(Implied)
$350,433 $375,578 $481,038 $484,241
Cash (Actual) 5595 6510 7663 11946
Debt (Actual) 27808 41318 83870 81935
Market
Capitalization
(Implied)
$328,220 $340,770 $404,831 $414,252
Actual Share Price $47 $56 $72 $108
Actual Number of
Share
7998 7793 7702 7668
Actual
Market
Capitalization
$373,506 $438,017 $556,564 $828,474
GAP $45,285 $97,247 $151,733 $414,222
2 Since the investor is uncertain whether Microsoft will grow at its implied terminal year growth rate, we have assumed WACC as the appropriate discount
rate for our analysis. Please refer to appendix B for more details.
5. Relating Impact of Leadership with Shareholder Value in Technology Companies
Draft for Discussion Purpose Only Confidential and Private Information
This document provides a glimpse of the research work currently in progress and the sole intention of this document is to illustrate our
interest in studying the area of leadership and value creation.
Phase 3: Evaluate the impact of product launches, acquisitions, and strategic partnerships on share price
We looked at the change in Microsoft’s stock prices along with product launches, press releases, mergers and
acquisitions from 2002 to 2019 (please refer to table 4 below). Increase in price by 5% or more in a single day must
have been associated with some or other significant events & we tried to probe into them.
Table 4: Mapping Microsoft’s Share Price with Major Announcements
Date StockPr. Change Events Date StockPr. Change Events Date StockPr. Change Events
Sep-06-2002 $23.91 4.2% Apr-09-2008 $28.89 0.5% Aquires Farecast Nov-01-2012 $29.52 3.4%
Sep-10-2002 $24.90 2.2% Aquires XDegrees Jun-27-2008 $27.63 -0.4%
MobiComp; Gates
Retires
Aug-23-2013 $34.75 7.3%
Oct-01-2002 $23.12 5.7% Microsoft announced that MSN® 8 Jul-14-2008 $25.15 -0.4% Aquires Zoomix Sep-03-2013 $31.88 -4.6%
Microsoft
acquires Nokia
Oct-10-2002 $23.19 5.4%
Microsoft Windows XP Professional Off
ers Billions of Dollars in Savings To En
terprise Customers Worldwide
Jul-15-2008 $26.15 4.0% Oct-25-2013 $35.73 6.0%
Oct-11-2002 $24.44 5.4% Jul-16-2008 $27.26 4.2% Nov-06-2013 $38.18 4.2%
Oct-15-2002 $26.15 6.1% Aug-05-2008 $26.21 3.7% Nov-22-2013 $37.57 0.5%
Microsoft launches
the Xbox One
Oct-22-2002 $25.84 -1.6%
Vicinity,Microsoft Launches Windows
Powered Smartphone Software
Aug-29-2008 $27.29 -2.3%
Aquires Greenfield Online
Inc.
Feb-04-2014 $36.35 -0.4%
SatyaNadella succeede
d Steve Ballmer as CEO
Nov-01-2002 $26.50 -0.9%
The DOJ reaches an agreement
with Microsoft to settle the US V.S
Microsoft
Sep-02-2008 $27.10 -0.7%
Google launches Google
Chrome
Apr-01-2014 $41.42 1.0%
Microsoft
announces Cortana,
Nov-04-2002 $28.05 5.8% Sep-11-2008 $27.34 3.4% Sep-02-2014 $45.09 -0.7%
Microsoft reassigns half
of its staff in Microsoft
Research to a new group
called MSR NeXT
Feb-18-2003 $24.96 3.4% Sep-30-2008 $26.69 6.7% Apr-24-2015 $47.87 10.5%
Feb-19-2003 $24.53 -1.7% Aquires Connectix Oct-13-2008 $25.50 18.6% Jul-29-2015 $46.29 2.1%
Microsoft
releases Windows 10 -
Mar-13-2003 $24.67 5.5% Oct-16-2008 $24.19 6.8% Aug-26-2015 $42.71 5.5%
Apr-02-2003 $25.72 5.6% Oct-28-2008 $23.10 9.1% Sep-23-2015 $43.87 -0.1%
Microsoft announces
partnership with Baidu
Apr-30-2003 $25.56 -1.0% Aquires PlaceWare Nov-21-2008 $19.68 12.3% Oct-23-2015 $52.87 10.1%
Jun-23-2003 $25.78 -2.1% Microsoft announces Windows Mobile Nov-24-2008 $20.69 5.1% Oct-26-2015 $54.25 2.6%
1st flagship Microsoft
Store opens in NYC
Apr-23-2004 $27.54 6.1% Dec-08-2008 $21.01 5.7% Nov-19-2015 $53.94 0.2% OpenFog Consortium
Apr-26-2004 $27.24 -1.1% Aquires ActiveViews Dec-16-2008 $20.11 5.6% Jan-29-2016 $55.09 5.8%
Dec-16-2004 $27.16 0.2% Aquires GIANT Company Software Mar-10-2009 $16.48 8.8% Feb-03-2016 $52.16 -1.6%
Microsoft announced to
buy SwiftKey,
Feb-08-2005 $26.24 0.3% Acquires Sybari Software Inc. Mar-23-2009 $18.33 7.4% Jun-13-2016 $50.14 -2.6%
Microsoft announces the
acquisition of LinkedIn
Mar-10-2005 $25.43 0.5% Acquires Groove Networks Inc. Mar-26-2009 $18.83 5.3% Jul-20-2016 $55.91 5.3%
Nov-22-2005 $27.91 -0.9% Microsoft launches the Xbox 360 Mar-31-2009 $18.37 5.1% Oct-21-2016 $59.66 4.2%
Jan-27-2006 $27.79 4.9% Apr-01-2009 $19.31 5.1% Oct-26-2016 $60.63 -0.6%
The Surface
Studio and Surface
Dial are announced
May-12-2006 $23.17 -0.2% Microsoft launches adCenter Apr-24-2009 $20.91 10.5% Nov-02-2016 $59.43 -0.6% Microsoft Teams
Jul-21-2006 $23.87 4.5% May-28-2009 $20.45 1.6%
Microsoft unveils
Microsoft Bing,
May- 10-
2017
Satya Nadella: Build
2017
Jan-30-2007 $30.48 -0.2% Microsoft releases Windows Vista Oct-22-2009 $26.59 0.0% launches Windows 7 Aug-23-2017
Satya Nadella: Microsoft
Inspire 2017
Oct-26-2007 $35.03 9.5% Oct-23-2009 $28.02 5.4% Sep-23-2017
Satya Nadella: Microsoft
Ignite 2017
Oct-29-2007 $34.57 -1.3% Acquires Global Care Solutions Feb-01-2010 $28.41 0.8%
launches Microsoft
Azure
Oct-27-2017 $83.81 6.4%
Feb-27-2008 $28.26 -0.4% Acquires YaData Sep-13-2010 $25.11 5.3% Mar-20-2018 $93.13 0.3% Semantic Machines
Mar-06-2008 $27.57 -2.0% Acquires Credential Nov-08-2010 $26.81 -0.1% Windows Phone Mar-26-2018 $93.78 7.6%
Mar-11-2008 $29.28 4.4% May-10-2011 $25.67 -0.6% Microsoft acquires Skype Jun-01-2018 $100.79 2.0% Acquires GitHub
Mar-12-2008 $28.63 -2.2% Acquires Kidaro Jan-20-2012 $29.71 5.7% Sep-24-2018
Satya Nadella:
Microsoft Ignite 2018
Mar-14-2008 $27.96 -2.3% Acquires Rapt Inc. Oct-26-2012 $28.21 1.2%
launches Microsoft
Surface,
Oct-25-2018 $108.30 5.8%
Mar-18-2008 $29.42 4.0% Dec-26-2018 $100.56 6.8%
Can be attributed to
Recession ,
Microsoft being a safe
bet
6. Relating Impact of Leadership with Shareholder Value in Technology Companies
Draft for Discussion Purpose Only Confidential and Private Information
This document provides a glimpse of the research work currently in progress and the sole intention of this document is to illustrate our
interest in studying the area of leadership and value creation.
Phase 4: Behavioral analysis of speeches of Satya Nadella and Steve Balmer
The following inferences have been made by analyzing Satya Nadella’s and Steve Balmer’s Word Cloud and
Sentiment Analysis, respectively:
A. Steve Nadella’s speech map and sentiment analysis:
7. Relating Impact of Leadership with Shareholder Value in Technology Companies
Draft for Discussion Purpose Only Confidential and Private Information
This document provides a glimpse of the research work currently in progress and the sole intention of this document is to illustrate our
interest in studying the area of leadership and value creation.
B. Steve Balmer’s Speech Map and Sentiment Analysis:
Key Inferences:
• From the underlying word clouds, one can see that both CEOs emphasize change, but Nadella talks a lot
more about creation.
• The word maps of Nadella attributes him to be more people-centric and uses less technical terms.
• The sentiment analysis of the speeches shows us how in terms of anticipation & trust Nadella fairs higher
than Ballmer, and both NRC & AFINN analysis attributes more positivity to Nadella than Ballmer.
8. Relating Impact of Leadership with Shareholder Value in Technology Companies
Draft for Discussion Purpose Only Confidential and Private Information
This document provides a glimpse of the research work currently in progress and the sole intention of this document is to illustrate our
interest in studying the area of leadership and value creation.
Phase 5: Computation of the residual value attributed to Satya Nadella’s management style
We estimated that the investor community on an average attaches a premium of 5% to 16% on announcements
pertaining to product launch, acquisitions. Our analysis considers a premium of 16% attached every year – i.e.
maximum that Microsoft could gain basis the impact of historical announcements.
Computation of Premium Attributed To
Satya Nadella’s Leadership Impact
2018
A. Actual Market Price $108
B. Implied Price Per Share {$414,252 Mn (Market Cap)/7668
(Number of Shares)}
$54
C. The gap between implied share price and actual market price (A-B) $54
D. Increase in share price after the announcement – an average
appreciation of 16% considered
$12
E. Value built-in - Satya Nadella's leadership effect - per share $42
F. Value built-in - Satya Nadella's leadership affect - total market
capitalization
$300 Billion
9. Relating Impact of Leadership with Shareholder Value in Technology Companies
Draft for Discussion Purpose Only Confidential and Private Information
This document provides a glimpse of the research work currently in progress and the sole intention of this document is to illustrate our
interest in studying the area of leadership and value creation.
Appendix A
Table Showing Return on Microsoft and Nasdaq
Date
Return in Microsoft’s Share Price Return on Nasdaq
Jun-30-2003 -0.31% 15.78%
Jun-30-2004 6.25% 24.07%
Jun-30-2005 -11.35% 3.10%
Jun-30-2006 -6.73% 5.69%
Jun-30-2007 24.35% 20.09%
Jun-30-2008 -8.27% -12.45%
Jun-30-2009 -8.51% -18.09%
Jun-30-2010 -0.82% 18.85%
Jun-30-2011 7.00% 30.88%
Jun-30-2012 16.18% 0.84%
Jun-30-2013 13.04% 15.90%
Jun-30-2014 21.89% 26.69%
Jun-30-2015 5.14% 12.03%
Jun-30-2016 15.66% -1.37%
Jun-30-2017 34.16% 25.91%
Jun-30-2018 43.81% 23.33%
Jun-30-2019 35.24% 6.71%
10. Relating Impact of Leadership with Shareholder Value in Technology Companies
Draft for Discussion Purpose Only Confidential and Private Information
This document provides a glimpse of the research work currently in progress and the sole intention of this document is to illustrate our
interest in studying the area of leadership and value creation.
Appendix B:
Microsoft’s WACC Calculation:
Date
Debt Equity Int Kd
Effective Tax
Rate
Rf Beta Rm Rf RE Wd We WACC
Jun-30-
2013
12601 78944 -429 3.40% 19%
3.07 0.10 15.90% 3.07% 4.41% 14% 86% 14.71%
Jun-30-
2014
20645 89784 -597 2.89% 21%
3.15 0.10 26.69% 3.15% 5.61% 19% 81% 15.54%
Jun-30-
2015
27808 80083 -781 2.81% 34%
2.85 0.10 12.03% 2.85% 3.81% 26% 74% 10.77%
Jun-30-
2016
41318 71997 -1243 3.01% 20%
2.02 0.10 -1.37% 2.02% 1.67% 36% 64% 9.34%
Jun-30-
2017
83870 87711 -2222 2.65% 15%
2.54 0.10 25.91% 2.54% 4.98% 49% 51% 9.19%
Jun-30-
2018
81935 82718 -2733 3.34% 55%
2.98 0.10 23.33% 2.98% 5.11% 50% 50% 8.28%
Jun-30-
2019
79107 102330 -2686 3.40% 10%
2.36 0.10 6.71% 2.36% 2.81% 44% 56% 9.03%