The quasimoderating effect of perceived affective quality on an extending Technology Acceptance Model
1. Computers & Education 54 (2010) 37–46
Contents lists available at ScienceDirect
Computers & Education
journal homepage: www.elsevier.com/locate/compedu
WebCT – The quasimoderating effect of perceived affective quality
on an extending Technology Acceptance Model
Manuel J. Sanchez-Franco *
Marketing Professor, Facultad de Ciencias Economicas y Empresariales, Universidad de Sevilla, Avda. Ramon y Cajal, n1, 41018 Sevilla, Spain
a r t i c l e i n f o a b s t r a c t
Article history: Perceived affective quality is an attractive area of research in Information System. Specifically, under-
Received 8 April 2009 standing the intrinsic and extrinsic individual factors and interaction effects that influence Information
Received in revised form 2 July 2009 and Communications Technology (ICT) acceptance and adoption – in higher education – continues to
Accepted 6 July 2009
be a focal interest in learning research. In this regard, one type of affective reactions toward ICT (in
our study, the WebCT), perceived affective quality, is an essential dimension in user technology accep-
tance.
Keywords:
A structural equation modelling, specifically partial least square (PLS), is proposed to assess the rela-
Perceived affective quality
TAM
tionships between the constructs together with the predictive power of the research model. The results
Flow demonstrate that the research model significantly predicts the intention to use the WebCT. The results
Perceived usefulness provide strong support for the proposals that (a) perceived usefulness, ease of use and flow lead the
Perceived ease of use learners towards developing high intention to use the WebCT; and (b) perceived affective quality exhibits
Intention a relevant interaction effect on the model.
Partial least squares This study, therefore, represents a ‘‘crucial test” of non-utilitarian influences on use of Web-based
applications. The model and results can thus be used to assess motivational design aspects during elec-
tronic learning process.
Ó 2009 Elsevier Ltd. All rights reserved.
1. Introduction
Web-based learning environments are enabling Universities (a) to shift focus away from traditional content-based learning to ‘‘a more
pro-active approach that embraces process-based learning” (Vogel & Klassen 2001, p. 104); and (b) to reach increasing number of students,
both in traditional distance education and continuing professional education (Nunes & McPherson, 2003). University educators and learn-
ers are thus increasingly encouraged to use electronic learning (hereinafter, e-learning) techniques to enrich the educational experience
(e.g. Limniou, Papadopoulos, & Whitehead, 2009); i.e. ‘‘technology that is around everything we do, has taken a place in the classroom”
(Toral, Barrero, & Martínez-Torres, 2007, p. 958). The impact of e-learning will, therefore, be real and it is receiving growing attention from
practitioners and information system researchers (e.g. Area Moreira, 2005; Martínez-Torres, Toral, Barrero, Gallardo, Arias, & Torres, 2008).
However, the introduction of e-learning technologies in teaching institutions is often complex and learners and educators do not always
use ICT as expected. For instance, ‘‘resisting change is a state of mind for many educators and one of the most difficult barriers for effective
ICT integration” (cf. Galanouli, Murphy, & Gardner, 2004, p. 66; cf. also Sánchez-Franco, Martínez-Lopez, & Martín-Velicia, 2009). Despite
efforts to position Information and Communications Technology (hereafter, ICT) as a central principle of university education, the fact that
many educators and learners make only limited formal academic use of ICT during their teaching and learning is less discussed by educa-
tional technologists (Selwyn, 2007). In particular, the reluctance to adopt electronic learning tools implies that research it is needed to
understand more comprehensively how educators and learners can be engendered in online settings (cf. Hammoud, Love, Baldwin, & Chen,
2008; Lu, Yu, & Liu, 2003). For instance, there is a lack of empirical analysis of the adoption/acceptance of Web-based learning systems
(Barak, 2007; Ngai, Poon, & Chan, 2007). Understanding (a) the intrinsic and extrinsic dimensions, and (b) moderating factors (e.g. affects)
that influence ICT acceptance and adoption in higher education, therefore, continues to be a focal interest in e-learning research.
On the one hand, the theoretical basis for this study stems from Technology Acceptance Model (TAM) (cf. Davis, 1989). However, original
TAM beliefs, that is, Perceived Usefulness (PU) and Perceived Ease of Use (PEOU) cannot fully reflect motives. In this regard, Human–Computer
* Tel.: +34 954556133; fax: +34 954556989.
E-mail address: majesus@us.es
0360-1315/$ - see front matter Ó 2009 Elsevier Ltd. All rights reserved.
doi:10.1016/j.compedu.2009.07.005
2. 38 M.J. Sanchez-Franco / Computers & Education 54 (2010) 37–46
Interaction (HCI) research proposes the need for incorporating intrinsic human factors (e.g. flow) in a specific study to improve its particular
and explanatory TAM value (cf. Hu, Chau, Sheng, & Tam, 1999; Legris, Ingham, & Collerette, 2003; Sánchez-Franco, 2005); that is, learners
could partly use Web-based applications because they intrinsically enjoy it (i.e. user flows). On the other hand, in HCI affects historically re-
ceive scarce attention. Many ICT demonstrate satisfactory functionalities and usability; however, as Zhang and Li (2005) comment, under-
standing users’ affective evaluation of ICT is also necessary. In fact, one type of affective reactions toward ICT, perception of affective
quality (PAQ) of an ICT, could be an essential factor in user technology acceptance (cf. Zhang, Li, & Sun, 2006); and more studies would thus
be needed ‘‘to validate, expand, synthesise, and generalise” research about perceived affective quality (Zhang & Li, 2005, p. 108). Nowadays, it
is unclear whether affect plays a main role in an individual’s evaluation, reaction, acceptance, and use of ICT in various contexts for various
purposes (Zhang & Li, 2004). Particularly, we are interested in how learners accept and use the Web Course Tools (hereafter, WebCT) in elec-
tronic learning-based tasks and what they think about while they use it. Furthermore, we are interested in understanding the role of PAQ as an
antecedent and a moderator of WebCT use.
In short, this study focuses on the impact of perceived affective quality, TAM beliefs and flow (i.e. extending TAM) on intention towards
using by learners, and hypothesizes the existence of interaction effects of perceived affective quality on extending TAM. This present study
(a) reviews the theoretical foundations in order to develop working hypotheses; (b) describes the research methodology followed to val-
idate the structural model; and finally, (c) discusses the results, practical and theoretical implications and their methodological limitations.
2. Theoretical background: a brief-perspective
Research in HCI tradition has long asserted that the research of human factors (1) is a key to the successful design and implementation
of technological applications and (2) should include cognitive and affective motives (Sánchez-Franco & Roldan, 2005).
2.1. Extending TAM and the theoretical model
The Technology Acceptance Model (TAM) explains the determinants of technology acceptance over a wide range of end-user computing
technologies -and user populations. For example, TAM is shown to have good predictive validity for the use of e-mail, Web, WebCT, etc.
(e.g. Fenech, 1998; Gefen & Straub, 1997; Johnson & Hignite, 2000; Lee, 2006; Lin & Lu, 2000; Ngai et al., 2007).
Specifically, PU and PEOU are hypothesized and empirically supported as fundamental determinants of user acceptance of a given ICT.
Both users’ beliefs determine the behavioral intentions (BI) to use ICT. The first three hypotheses (H1–H3) thus come mainly from numer-
ous studies on TAM (e.g. Davis, 1989; Venkatesh, Morris, Davis, & Davis, 2003; Zhang et al., 2006), see Fig. 1.
H1. PU positively influences BI to use Web-based technologies.
H2. PEOU positively influences PU of Web-based technologies.
H3. PEOU positively influences BI to use Web-based technologies.
However, most of the TAM research has only been conducted from an extrinsic-motivation perspective. ‘‘Original TAM variables, that is,
Use, Intention of use, Usefulness and Ease of use (Davis, 1989) cannot fully reflect e-learners’ motives, requiring a search for additional
intrinsic motivational factors” (Martínez-Torres et al., 2008, p. 496; cf. also Ong, Lai, & Wang, 2004). Several researchers thus propose
the need for incorporating intrinsic human factors or integrating other motivational variables and theories in a specific study to improve
the TAM value. In this context, one of the positive psychological states related to prior factors is flow concept; that is, people become
H10
PAQ
H11
PU
H7 H4
H1
PAQ H8 FLOW H5 BI
H2
H14
H6 H12 H3
H9
PEOU
H13
PAQ PAQ
Directeffect
Interactioneffect
* BI: Behavioral Intention; PU: Perceived Usefulness; PEOU: Perceived Ease of Use; FLOW: Flow; PAQ: Perceived Affective
Quality
Fig. 1. Research model: interaction effects model. Hypotheses.
3. M.J. Sanchez-Franco / Computers & Education 54 (2010) 37–46 39
absorbed in their activity: their awareness is narrowed to the activity itself; they lose self-consciousness, and they feel in control of their
environment (cf. Csikszentmihalyi, 1990). Furthermore, the concept of flow is a possible metric of the online users experience; it could also
be defined as an intrinsically enjoyable experience: ‘‘the extent to which the activity of using the computer is perceived to be enjoyable in
its own right, apart from any performance consequences that may be anticipated” (Davis, Bagozzi, & Warshaw, 1992, p. 1113).
Flow shares several characteristics with TAM’s constructs. In particular, HCI-based research using the TAM model has found that flow
has a relationship with PEOU (cf. Davis et al., 1992; Igbaria, Parasuraman, & Baroudi, 1996; Venkatesh, 1999; Venkatesh, 2000); and PU of
the system (cf. Agarwal & Karahanna, 2000). For instance, Venkatesh (1999); Venkatesh (2000) conceptualises intrinsic enjoyment as an
antecedent of PEOU, whose effects increase over time as users gain more experience and perceived control with the system. Furthermore,
Agarwal and Karahanna (2000) find a multi-dimensional construct called cognitive absorption (similar to flow) which has a significant
influence on PU over and above PEOU. That is, users hold two inconsistent cognitive structures at the same time. In essence, users ratio-
nalise ‘I am voluntarily spending a lot of time on this and enjoying it, therefore, it must be useful’. Individuals who often behave in certain ways
might infer that they, for instance, enjoy behaving in those ways (cf. Bem, 1972; Sánchez-Franco & Roldan, 2005). Similarly, Yi and Hwang
(2003) propose the influence of intrinsic motives (i.e. intrinsic enjoyment) on PU. As Ghani and Deshpande (1994) point out, the total con-
centration on an activity and the enjoyment which one derives are the key characteristics of flow. Users in a flow state focus their attention
on a limited stimulus field, filtering out irrelevant thoughts and perceptions. Flow thus affects users’ perceived instrumentality positively.
Venkatesh, Speier, and Morris (2002) also confirm that intrinsic motivation increases the deliberation and thoroughness of cognitive pro-
cessing; accordingly, intrinsic motivation leads to enhanced perceptions of extrinsic-motivation (i.e. PU).
Finally, Davis et al. (1992) propose that perceived enjoyment influences usage intention directly (cf. Atkinson & Kydd, 1997; Igbaria et
al., 1996; Venkatesh, 1999). For instance, Teo, Lim, and Lai (1999) find that perceived enjoyment is one of the motivations for the use of the
Internet. Users will try a technology – even if they do not have a positive attitude towards using it – because it may provide not only extrin-
sic efficiency (i.e. PU) but also psychological and intrinsic pleasure (i.e. flow) (cf. Sánchez-Franco, 2006).
In short, flow will also influence BI (a) directly; and (b) through its effects on PU and PEOU. Based on the previous arguments, this re-
search proposes the following hypotheses (see Fig. 1):
H4. FLOW positively influences PU of Web-based technologies.
H5. FLOW positively influences BI to use Web-based technologies.
H6. FLOW positively influences PEOU of Web-based technologies.
2.2. PAQ and the theoretical model
Zhang et al. (2006) suggest that the dimension called perceived affective quality (PAQ) of a technology is an important dimension regard-
ing acceptance. As Russell (2003, p. 149; cf. also Russell, 1980) summarises, ‘‘objects, events, and places (real, imagined, remembered, or
anticipated) enter consciousness affectively interpreted. The PAQ of all the stimuli typically impinging at any one time (how pleasant,
unpleasant, exciting, boring, upsetting, or soothing each is) then influences subsequent reactions to those stimuli”. That is, PAQ is the ability
to cause a change in core affect. Applying PAQ concept to the Web-based applications environment, PAQ begins with how Web-based
applications are being pleasant (valence value) and interesting (arousal value) (Zhang et al., 2006).
Based on Russell’s emotional episode, users’ primitive affective reaction to ICT (i.e. PAQ), has an impact on their consequent reactions
such as PU, PEOU and FLOW, as well as on BI. The basis of PAQ’s impact on PU and PEOU is very similar to that of flow on them (see also
Zhang et al., 2006). On the one hand, PAQ contributes to the individuals’ PEOU: ‘‘when the person considers the technology to be pleasant
and interesting, the person would not perceive to have difficulty to interact with the technology” (Zhang et al., 2006, p. 4). On the other
hand, Zhang et al. (2006, p. 4) also comment that ‘‘feeling pleasant and being intrigued by the technology, the person would positively esti-
mate the potential consequences of using the technology toward his/her goals (i.e. PU) according to the principle of mood congruence” (cf.
Bagozzi, Gopinath, & Nyer, 1999; Bower, 1981, 1991; Chen & Dubinsky, 2003).
Likewise, the dimensions of PAQ have direct connections to flow. When individuals are completely involved with an activity and totally
absorbed in it, they could experience a state of flow. However, an important prerequisite for this rewarding experience is that an individual
is able to accomplish the task. And it is equally important for it to be experienced as a challenge. The individual perceives stimulation (i.e.
arousal) and unambiguous feedback (i.e. perceived control related to pleasure) inherent in Web-based applications (i.e. PAQ). Studies
applying the perspective of flow show that to provide intrinsically enjoyable experiences, ICT must represent a challenge to the user as
a possible antecedent of perceived arousal and allow for perceived control (cf. Csikszentmihalyi, 1975). Finally, PAQ also occurs before flow.
Russell’s prototypical case indicates that a plan for action is formed after the perception of affective quality. This plan of action is the BI
concept (cf. Zhang & Li, 2004).
Based on the previous arguments, this research proposes the following hypotheses (see Fig. 1):
H7. PAQ positively influences PU of Web-based technologies.
H8. PAQ positively influences perceived FLOW elicited by Web-based technologies.
H9. PAQ positively influences PEOU of Web-based technologies.
H10. PAQ positively influences BI to use of Web-based technologies.
2.3. The interacting effect of PAQ on extending technology model and the theoretical model
As Russell (2003, p. 157) recommends, ‘‘it is especially important to distinguish perception of affective quality from core affect, even
though the two are empirically and conceptually related”. Whereas core affect exists within the person, affective quality exists in the
stimulus. On the one hand, PAQ begins with how Web-based applications are being pleasant and interesting. On the other hand, if users
4. 40 M.J. Sanchez-Franco / Computers & Education 54 (2010) 37–46
perceive ICT to be pleasant and interesting, they will possess a positive pleasure and arousal. PAQ therefore, influences users’ affective reac-
tions. In particular, ‘‘the examples in which core affect and perception of affective quality are positively correlated are those in which one
has the object perceived” (e.g. one enjoys the pleasant Web-based applications one is using).
Users – who perceive ICT to be pleasant and interesting – will show less concern for the risks associated with tasks; and are likely to feel
motivated to act in an innovative and exploratory way, whereas users – who perceive ICT to be unpleasant and overwhelming- approach the
same tasks conservatively and defensively (cf. Isen, 2000). For instance, interest and stimulation create the urge to explore, take in new infor-
mation and experiences, and expand the self in the process. Eroglu, Machleit, and Davis (2003) suggest that affective reactions affect users’
risk seeking/avoidance behavior. For instance, as Csikszentmihalyi (1997) summarises, when a person is anxious or worried, for example,
the step to flow often seems too far, and one retreats to a less challenging situation instead of trying a cope. Therefore, users – who
perceive ICT to be pleasant and stimulating – will be less likely to develop PU and BI based mainly on PEOU because of reducing their worries
about risk, and increasing exploratory behaviors. These users (1) are likely higher motivated to act in an innovative way; (2) would make BI
to use ICT more dependent on flow, and, as commented above, less dependent on PEOU. On the contrary, users (who perceive ICT to be
unpleasant and overwhelming) show conservative and defensive behaviors and greater concern for the risks associated with ICT. Consider-
ing them personal threats, they think of (a) their personal deficiencies, (b) the obstacles they will find, and (c) adverse results, instead of
concentrating on the way of performing the task satisfactorily. That is, with perceived uncertainty and vulnerability, the need to PEOU –
in developing BI – becomes relevant. PEOU becomes an essential dimension of extending TAM in these users who perceive negative affective
qualities.
Moreover, the impact of PU on BI could be negatively moderated by the level of affective qualities the individuals perceive. In essence,
when users perceive ICT to be pleasant and stimulating, the impact of PU (at whatever level) on future intention to use would be lower;
that is, ‘‘when IT usage is extremely enjoyable, instrumental issues, such as perceived usefulness, ought not to come into one’s decision-
making criteria for future usage” (Chin, Marcolin, & Newsted, 2003, p. 210). However, these users (1) are likely to devote more effort to a
given task; and, faced with the same tasks, (2) are likely to expect higher odds of success and construe these task goals as more desirable
than users who perceive ICT to be overwhelming. PAQ dimension could, therefore, have – at least at the conceptual level – a mixed inter-
action effect on the relationship among PU and BI. The results suggest the need for further research regarding the role of affects in general
and PAQ in particular for moderating the relationship among PU and ICT intentions and usage behaviors.
Based on the previous arguments, this research proposes the following hypotheses (see Fig. 1):
H11. PU does not influence BI to use Web-based technologies significantly in users who perceive Web-based technologies to be pleasant
and stimulating.
H12. PEOU influences PU of Web-based technologies less significantly in users who perceive Web-based technologies to be pleasant and
stimulating.
H13. PEOU influences BI to use Web-based technologies less significantly in users who perceive Web-based technologies to be pleasant
and stimulating.
H14. FLOW influences BI to use Web-based technologies more significantly in users who perceive Web-based technologies to be pleasant
and stimulating.
3. Method
3.1. Treatment
The purpose of this study was to examine learners’ interest in electronic learning technologies in order to determine their acceptance as
a tool for delivering classes. The technology studied is the WebCT. The first time when WebCT was adopted was during the period 2007–
2008.
In particular, the WebCT is a Virtual Learning Environment (VLE) designed to deliver online course content, assessments and commu-
nication. ‘‘WebCT or Blackboard are educational platforms that have been adopted by numerous universities in order to enable teachers to
have a flexible virtual learning environment to deliver online quizzes or courses in addition to standard classes” (Limniou et al., 2009, p.
46). WebCT does not require technical expertise on behalf of the course designer.
In our study, the online lecture contained a complete set of theoretical/practical notes, assignments and exams, and uses many of col-
laborative online features. Cooperation, coordination, and collective approaches are all desirable characteristics. Learners in a cooperative
environment have been found to outperform other work groups (Lu et al., 2003). WebCT site therefore, contained the following features:
– Firstly, each week, the instructor uploaded educational materials for learners to study as Power Point slides (for printing), class notes,
unit/section modules, and links to relevant external resources. The content module provided a table of contents-structure for easily
accessing course content documents. Therefore, the educational materials were not limited for cost reasons to particular course texts
or readings.
– Secondly, the WebCT help learners keep track of learning progress. Each month, the instructor designed cases analysis, and online quiz-
zes/exams to help learners understand and exercise the content. Likewise, important dates were posted on the calendar; i.e. dates of
quizzes, cases and the final exam.
– Thirdly, the WebCT also incorporates collaborative tools like chat, discussion boards, and e-mail. The WebCT provides the capacity for
synchronous (chat-room) and asynchronous subject-based discussions (threaded bulletin-boards). These tools enable learners and the
instructor to have broader access to one another as needed. In particular, learners attended lectures asked questions by e-mail, bulletin
boards, or in real-time live chat. Each learner was required to make comment on questions posted by the instructor. Learners also offered
additional resources and relevant websites. Learners could perform functions such as exchanging messages with other learners. In short,
Bulletin boards allowed enhanced, standardized, and timely communications with learners/instructor in all sections. Messages posted to
the Bulletin Board were viewable by everyone.
5. M.J. Sanchez-Franco / Computers & Education 54 (2010) 37–46 41
3.2. Participants
Theoretical model and the hypotheses discussed above were validated through a non-probabilistic sampling and self-selection. The data
are collected from a sample of online questionnaires filled out by undergraduate students (University of Seville, Spain). Invitation e-mails
were sent to the selected learners, requesting their participation. This questionnaire is design to get input on the questions from each stu-
dent registered in the Web-based modules.
The data collection process was programmed to list the questions in a random order for each participant, avoiding potential systematic
biases in the data and other cognitive consistency patterns. We also eliminate the respondents who have missing data in any of the survey’s
items. The exclusion of invalid questionnaires results in 431 effective learners. A preliminary analysis of the data reveals that the respon-
dents are almost evenly split by sex. The sample consisted of 431 students ranging in age from 19 to 26 with a mean age of 22 years. Of the
431 students, 52 were male and 48 were female. Students had an average of 5 years using the Web, and spent an average of 2 h per week
using the WebCT.
3.3. Measures
Instrument development first consists in reviewing the literature so as to identify measures for each construct (cf. Davis, 1989 – PU and
PEOU; Agarwal & Karahanna, 2000 – BI; Novak, Hoffman, & Yung, 2000 – FLOW). PAQ is measured by four aspects of quality as validated by
Russell and Pratt (1980; cf. also Zhang & Li, 2005): arousing, sleepy, pleasant, and unpleasant. All items are 5-point Likert-type, ranging
from ‘‘strongly disagree”, 1, to ‘‘strongly agree”, 5, excepting FLOW1 and FLOW2 (not at all sure, 1 – completely sure, 5; never, 1 – very
frequently, 5, respectively). See Appendix.
Our survey instrument is pre-tested for content analysis. The measures of the constructs adapt scales already proposed and validated in
the literature. However, this research applies various refinement procedures for clarity, completeness, and readability. The measurements
must reflect the specific intended domain of content. To make sure that important aspects of constructs were not omitted, the authors con-
ducted personal interviews and surveys on e-learning with learners and professors. Specifically, 20 learners establish content validity
through individual interviews; the characteristics of our sample were similar to them. Moreover, three marketing professors – majoring
in ICT – check the suitability of the wording and format, and also assess the degree to which authors accurately translated the constructs
into the operationalisation.
3.4. Data analysis
The proposed model and hypothesis testing is conducted using partial least squares (PLS) Version 3.00 Build 1058 (Chin, 2003). PLS al-
lows both the specifying of the relationships among the conceptual factors of interest and the measures underlying each construct. This
result is a simultaneous analysis of (a) how well the measures relate to each construct and (b) whether the hypothesized relationships
are empirically true at the theoretical level.
Specifically, examining interaction effects with covariance methods – when the interaction involves Likert-scale variables – may be
problematic because of relevant degrees of shared variance. In such cases, the academic literature recommends employing PLS.
4. Results
4.1. Measurement model
PAQ is a second order construct with four dimensions: arousal, sleepy, pleasant, and unpleasant qualities. This implies that PAQ will be
measured by a number of first-order latent variables. The items for four dimensions are, therefore, optimally weighted and combined using
the PLS algorithm to create latent variables scores. The resulting scores reflect the underlying dimensions more accurately than any of the
individual items by accounting for the unique factors and error measurements that may also affect each item (Chin & Gopal, 1995). The
composite reliabilities and the average variance extracted (AVE) for the dimensions are over the recommended acceptable 0.7 level and
0.5, respectively.
The following step is testing the psychometric properties of the measurement model. See Tables 1A and B. On the one hand, the loadings
of the items with their respective construct assess individual reflective-item reliability. A rule of thumb followed by many researchers is to
accept items higher than 0.7 (Carmines & Zeller, 1979). The individual reflective-item reliabilities – in terms of standardized loadings – are
over the acceptable cut-off level of 0.7. The significance of the loadings is checked with a re-sampling procedure (500 sub-samples) for
obtaining t-statistic values. They all are significant (p < 0.001). On the other hand, the composite reliability (qc) assesses construct reliabil-
ity (Werts, Linn, & Jöreskog, 1974). Nunnally (1978) suggests 0.7 as a benchmark for a modest reliability applicable in initial stages of re-
search. The composite reliability for each construct is over the recommended acceptable 0.7 level. The results are thus satisfactory. See
Table 1A.
Finally, convergent and discriminant validities are assessed by applying the fact that the square root of the average variance extracted
(AVE) by a construct from its indicators (a) should be at least 0.7 (i.e. AVE > 0.5); and (b) should be greater than that construct’s correlation
with other constructs, respectively (Barclay, Higgins, & Thompson, 1995; Chin, 1998; Fornell & Larcker, 1981). All latent constructs satisfy
this condition. The convergent and discriminant validities of the multi-item constructs of the models are thus acceptable. See Table 1B.
4.2. Structural model: analysis of results
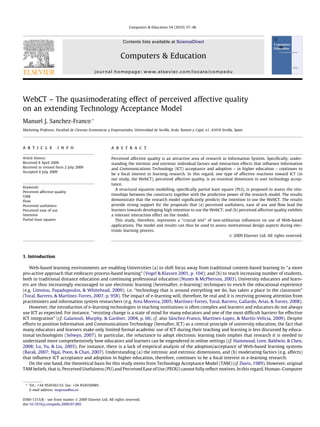
Fig. 2 shows the path coefficients for the model (interaction effects model) and their significance levels. As recommended by Chin
(1998), bootstrapping (with 500 sub-samples) was performed to test the statistical significance of each path coefficient using t-tests.
6. 42 M.J. Sanchez-Franco / Computers & Education 54 (2010) 37–46
Table 1
Measurement model.
Dimensions Loadingsa Composite reliability AVE
(A). Individual item reliability-individual item loadings. Construct reliability and convergent validity coefficients
Behavioral intention 0.910 0.772
BI1 0.928
BI2 0.880
BI3 0.826
Perceived usefulness 0.945 0.776
PU1 0.860
PU2 0.852
PU3 0.923
PU4 0.894
PU5 0.874
Perceived ease of use 0.893 0.582
PEOU1 0.761
PEOU2 0.768
PEOU3 0.732
PEOU4 0.850
PEOU5 0.763
PEOU6 0.701
Flow 0.890 0.730
FLOW1 0.878
FLOW2 0.831
FLOW3 0.853
Perceived affective quality 0.861 0.610
AQ: arousal quality 0.897
PQ: pleasant quality 0.702
SQ: sleepy qualityR 0.772
R
UQ: unpleasant quality 0.748
Behavioral intention Perceived usefulness Perceived ease of use Flow Perceived affective quality
(B). Discriminant validity coefficients
Behavioral intention 0.879
Perceived usefulness 0.582 0.880
Perceived ease of use 0.415 0.666 0.762
Flow 0.402 0.364 0.321 0.854
Perceived affective quality 0.640 0.635 0.378 0.345 0.781
Note: Diagonal elements (bold) are the square root of average variance extracted (AVE) between the constructs and their measures. Off-diagonal elements are correlations
between constructs.
a
All loadings are significant at p < 0.001 – (based on t(499), one-tailed test).
R
Reversed.
.416a
PAQ
.021ns
PU
.446a .054c
.134b
PAQ .345a FLOW .130a BI
.363a
.233a
.216a -.031ns
.303a -.251a
PEOU
-.200b
PAQ PAQ
Directeffect
Interactioneffect
* BI: Behavioral Intention; PU:Perceived Usefulness; PEOU: Perceived Ease of Use; FLOW: Flow; PAQ: Perceived Affective
Quality
a p < 0.001, b p < 0.01, c p < 0.05, ns = not significant (based on t(499), one-tailed test)
Fig. 2. Research model: interaction effects model. Results.
7. M.J. Sanchez-Franco / Computers & Education 54 (2010) 37–46 43
Three models (main effects model, main effects + PAQ model and interaction effects model) seem to have an appropriate predictive
power for most of the dependent variables; i.e. variances explained, or R-square values, for endogenous constructs exceed the required
amount of 0.10 (Falk & Miller, 1992).
Another measure that supports these positive results is the Q2 test of predictive relevance for the endogenous constructs (Geisser, 1975;
Stone, 1974). The cross-validated redundancy measure it has been particularly suggested to examine the predictive relevance of the the-
oretical/structural model (Chin, 1998). A Q2 greater than 0 implies that the model has predictive relevance, whereas a Q2 less than 0 sug-
gests that the model lacks predictive relevance. In general, the results confirm that the main effects model (Q2 PU: 0.336; Q2 PEOU: 0.060;
Q2 BI: 0.012), the main effects + PAQ model (Q2 FLOW: 0.076; Q2 PU: 0.277; Q2 PEOU: 0.076; Q2 BI: 0.281) and interaction effects model (Q2
FLOW: 0.076; Q2 PU: 0.281; Q2 PEOU: 0.076; Q2 BI: 0.277) have satisfactory predictive relevance for the endogenous variables.
As indicated by the main effects model, PU and FLOW have significant impacts on BI, with paths coefficients of 0.493 and 0.214, respec-
tively. However, PEOU has no significant impact on BI. The constructs account for 38.5% of the variance in BI. PEOU and FLOW have also
significant effects on PU (Beta = 0.609 and Beta = 0.175, respectively) with 47.3% variance explained. Further, FLOW significantly influences
PEOU (Beta = 0.333).
Secondly, as indicated main effects + PAQ model, PU and FLOW have significant impacts on BI, with paths coefficients of 0.213 and
0.158, respectively. However, PEOU has no significant impact on BI. PAQ has significant impacts on PU, FLOW, PEOU and BI, with paths
coefficients of 0.432, 0.345, 0.303 and 0.427, respectively. The constructs account for 48.6% of the variance in BI. Also, FLOW has a signif-
icant effect on PEOU and PU (Beta = 0.216 and Beta = 0.060, respectively). Further, PEOU significantly influences PU (Beta = 0.484).
Thirdly, as indicated interaction effects model, the interaction effects is included in addition to the main effects + PAQ model (see Fig. 2).
As in regression analysis, the predictor and moderator variable are multiplied to obtain the interaction terms. According to the paper by Chin
et al. (2003), it is recommended to standardize the product indicators. Furthermore, in the presence of significant interaction terms involving
any of the main effects, no direct conclusion can be drawn from these main effects alone (cf. Aiken & West, 1991; Darlington, 1990).
Empirical research follows the hierarchical process similar to multiple regression where the R-square for this interaction model is com-
pared to the R-square for the main effects model and main effects + PAQ model, which exclude the interaction constructs (Chin, 1994). The
difference in R-square was used to assess the overall effect size f2 for the interaction where 0.02, 0.15 and 0.35 has been suggested as small,
moderate, and large effects, respectively (Cohen, 1988). The interaction effects model, in which PAQ is proposed to quasi-moderate the
extending TAM, possesses a significantly higher explanatory power than the main effects model. The effect size f2 for the interaction effect
is 0.300 (i.e. moderate). Further, the interaction effects model also possesses a significantly higher explanatory power than the main effect-
s + PAQ model. The effect size f2 for the interaction effect is 0.163 (i.e. moderate).
On the one hand, the results give a significant standardized beta of 0.134 from PU to BI, and 0.130 from FLOW to BI. PEOU has no sig-
nificant impact on BI (Beta = À0.031). In turn, FLOW significantly influences PU and PEOU (Beta = 0.054 and Beta = 0.216, respectively);
also, PEOU significantly influences PU (Beta = 0.363). Moreover, PAQ has significant impacts on PU, FLOW and PEOU, with paths coefficients
of 0.446, 0.345 and 0.303, respectively. Finally, PAQ significantly influences BI (Beta = 0.416).
On the other hand, the interaction effects are of 0.021 (PUÃPAQ ? BI), 0.233 (FLOWÃPAQ ? BI), À0.200 (PEOUÃPAQ ? BI) and À0.251
(PEOUÃPAQ ? PU) with a total R-square BI of 0.57. According to the strength of moderating effects, the path coefficient of the interaction term
indicates to which extent the exogenous variable’s influence on the endogenous variable changes depending on the moderating variable
(Henseler & Fassott, 2007). In case of standardized variables, if the moderator variable (i.e. PAQ) is one -one standard deviation higher than
its mean-, the exogenous variable’s influence (e.g. FLOW) on the endogenous variable (e.g. BI) would be 0.130 + 0.233 (see Fig. 2 and Table 2).
H11 PAQ does not moderate the impact of PU to BI (PUÃPAQ ? BI: 0.021).
H12 PAQ moderates the impact of PEOU to PU. That is, PAQ would positively moderate the relationship between PEOU and PU.
H13 PAQ reduces the impact of PEOU to BI from À0.031 to À0.231, such that the greater user’s PAQ, the lower the relationship between
PEOU and BI.
H14 PAQ positively moderates the relationship between FLOW and BI, such that the greater user’s PAQ, the higher the relationship
between FLOW and BI.
Table 2
Hypotheses, path coefficients and results.
Relationships Hi Main effects model Main effects + PAQ model Interaction effects model Supported
PU ? BI H1 0.493ª 0.213a 0.134b Yes
PEOU ? PU H2 0.609ª 0.484a 0.363ª Yes
PEOU ? BI H3 0.019ns 0.061ns À0.031ns No
FLOW ? PU H4 0.175ª 0.060c 0.054c Yes
FLOW ? BI H5 0.214a 0.158a 0.130a Yes
FLOW ? PEOU H6 0.333a 0.216a 0.216a Yes
PAQ ? PU H7 0.432a 0.446a Yes
PAQ ? FLOW H8 0.345a 0.345a Yes
PAQ ? PEOU H9 0.303a 0.303a Yes
PAQ ? BI H10 0.427a 0.416a Yes
PUÃPAQ ? BI H11 0.021ns Yes
PEOUÃPAQ ? PU H12 À0.251a Yes
PEOUÃPAQ ? BI H13 À0.200b Yes
FLOWÃPAQ ? BI H14 0.233a Yes
R-square ? BI 0.38 0.48 0.57
BI: behavioral intention; PU: perceived usefulness; PEOU: perceived ease of use; FLOW: flow; PAQ: perceived affective quality.
a
p < 0.001.
b
p < 0.01.
c
p < 0.05.
ns
Not significant (based on t(499), one-tailed test).
8. 44 M.J. Sanchez-Franco / Computers & Education 54 (2010) 37–46
5. Discussion and limitations
The Web offers unprecedented opportunities for world-wide access to information resources; specifically, ‘‘the Web and associated
technologies provided a new playground with new rules and tools to conduct instruction and create novel approaches to learning” (Saadé,
2003, p. 267). In this regard, understanding learners’ affective evaluation of ICT is essential; i.e. e-learning tools move away from function-
ality and utility alone, towards the learners’ experiences and their affects. In Information System affects historically receive scarce atten-
tion, being perceived affective quality (PAQ) an attractive area of research in technology-enhanced learning. In particular, this research
provided innovative insights into the complex interaction between PAQ and extending TAM, showing the differential effects that PAQ
can cause.
Firstly, Web planners (e.g. educators) should increase: (1) learners’ perception of ICT as enjoyable and stimulating; and (2) enduring
exposures to the site facilitating the likelihood of reaping the rewards of increased repeat visits and longer times at each visit. In this sense,
PEOU and PU would not be the only traditional criterion for Web-based applications design. An additional determinant must be its ‘‘enjoy-
able and stimulating perception” (i.e. PAQ), so that it evokes compelling experiences (i.e. FLOW) and, therefore, increases profitable website
use. PAQ is thus a highly desirable goal to increase the effectiveness of online learning experiences.
Secondly, as we stated above, learners who perceive ICT to be pleasant and stimulating will probably want to maintain or increase their
affective responses. This substantiates the importance of the Web-based applications to be intrinsically perceived as enjoyable and stim-
ulating in order to promote a strong positive BI (FLOWÃPAQ ? BI: 0.233). Further, learners seek higher optimal stimulation and challenging
ICT and, specifically, lower PEOU levels to try Web-based applications because they have a basic need for competence (PEOUÃPAQ ? BI:
À0.200; and PEOUÃPU ? BI: À0.251). For instance, individualistic scripts should focus on the following learner-interface and design ele-
ments; on the one hand, work tasks, roles, and mastery, with quick results for limited tasks (aspects traditionally related to instrumental
activities and, in turn, PU); and, on the other hand, navigation oriented to exploration and control (aspects traditionally related to flow-
based activities) and attention gained through games and competitions (cf. Sánchez-Franco, 2006).
Thirdly, studies applying the perspectives of PAQ have shown that to provide intrinsic enjoyment, educational services must represent a
certain challenge to learners. A Web-based applications must be designed to be stimulating to use and to evoke compelling user experi-
ences to increase profitable Web-based applications usage. In fact, when the challenges are significantly lower than skills (e.g. excessive
PEOU), higher boredom could be the result. If the challenges are too low, learners lose interest and tend to use the electronic applications
sporadically (e.g. PEOUÃPAQ ? BI: À0.200). Hence the model shows the time progression as one continues to learn a new skill and pro-
gresses up the flow channel.
Lastly, present study recognises a series of limitations. First, the model clearly does not include all the relevant variables. For instance,
future studies should test the possible inclusion of other external variables (e.g. certain resources, such as time). Second, learner’s percep-
tion can change over time. Therefore, future research should measure the constructs (i.e. extending TAM and PAQ) at several points of time
taking into account the dynamics in user patronage behavior. Third, we restricted our investigation to intrinsic and extrinsic motives. How-
ever, learner behavior is explained via a model in which behavior, cognitive and personal factors and environmental events all operate
interactively as determinants of each other. Thus, it is necessary to fulfil the model with the role of consumer demographic variables
and navigation context (work/home, high/low download, etc.) that are unexplored in this research (Sánchez-Franco, 2005). There has been
recent steady progress towards an understanding of the effects of website characteristics (interactivity, depth of information, etc.) and user
characteristics, such as personal Internet savvy, innovativeness/predisposition to technology, frequency of service use, etc. (cf. Shankar,
Smith, & Rangaswamy, 2003). Finally, more studies are needed to validate, expand, synthesise, and generalise these results (cf. Zhang &
Li, 2005). As Khalid (2006, p. 417) summarises, ‘‘much needs to be done to develop predictive models of affect and pleasure for design
of products and interfaces”.
6. Conclusions
Our research contributes to the existing literature by examining the influence of affective reactions in determining the WebCT
acceptance as a tool for delivering classes in an online setting. The research explored what learners think about while they interact
with the WebCT. In particular, the theoretical proposals within this paper focused upon the impact of PAQ, FLOW, PU, and PEOU on
BI. Likewise, the study hypothesized the existence of moderating effects of PAQ on the extending Technology Acceptance Model
(TAM).
PLS technique has been applied to analyze the measurement model and structural model concurrently in order to validate the previous
set of hypotheses and indicators. The measurement model was valid with adequate convergent and discriminant validity with respect to
the measurements of all the constructs. All path coefficients in the structural model were statistically significant, excepting PEOU ? BI and
PUÃPAQ ? BI. The results (1) demonstrated that the proposed model significantly predicts BI; and (2) provided strong support for the pro-
posals that PU, PEOU and FLOW (directly or indirectly) lead the learners towards developing high intention to use Web-based applications
(specifically, WebCT). Likewise, PAQ exhibited relevant interaction effects on extending TAM.
Therefore, this study extends previous research, which focuses primarily on the main effects of PAQ, by finding further support for sig-
nificant interactions between PAQ and extending TAM. That is, in order to establish an enduring relationship between learners and online
learning technologies, designers should take account of ability to cause a change in core affect when allocating their design efforts to PAQ,
FLOW, PEOU and PU initiatives. Future research should thus be aware of the importance of the quasimoderating effects of PAQ on WebCT
acceptance.
Acknowledgements
The authors are grateful to the Editor, Dr. Rachelle S. Heller, and the Reviewers for their constructive comments.
9. M.J. Sanchez-Franco / Computers & Education 54 (2010) 37–46 45
Appendix A. Instructions/items
Please grade from 1 to 5 your level of agreement or disagreement with the following statements in relation to the usage of the WebCT in
this course.
Perceived usefulness (PU). Source: Davis (1989)
PU1. Using the WebCT improved my performance
PU2. Using the WebCT enhanced my productivity
PU3. Using the WebCT enhanced my effectiveness
PU4. Using the WebCT was interesting
PU5. Using the WebCT was useful
Perceived ease of use (PEOU). Source: Davis (1989)
PEOU1. Learning to operate the WebCT was easy for me
PEOU2. I find it easy to get the WebCT to do what I wanted it to do
PEOU3. My interaction with the WebCT was clear and understandable
PEOU4. I find the WebCT to be flexible to interact with
PEOU5. It was easy for me to become skilful at using the WebCT
PEOU6. I find the WebCT easy to use
Flow (FLOW). Source: Novak, Hoffman and Yung (2000)
The word ‘‘flow” is used to describe a state of mind sometimes experienced by people who are deeply involved in some activity. One example of flow is
the case where a professional athlete is playing exceptionally well and achieves a state of mind where nothing else matters but the game; he or she
is completely and totally immersed in it. The experience is not exclusive to athletics; many people report this state of mind when playing games,
engaging in hobbies; or working. Activities that lead to flow completely captivate a person for some period of time. When one is in flow, time may
seem to stand still, and nothing else seems to matter. Flow may not last or a long time on any particular occasion, but it may come and go over time.
Flow has been described as an intrinsically enjoyable experience. Thinking about your use of WebCT:
FLOW1. Do you think you have ever experienced flow on WebCT?*
FLOW2. In general, how frequently would you say you have experienced flow when you use WebCT?*
FLOW3. Most of the time I use WebCT I feel that I am in flow.
Behavioral intention (BI). Source: Agarwal and Karahanna (2000)
BI1. I plan to use the WebCT in the future
BI2. I intend to continue using the WebCT in the future
BI3. I expect my use of the WebCT to continue in the future
FLOW1 and FLOW2 (not at all sure, 1 – completely sure, 5; never, 1 – very frequently, 5, respectively).
Please, rate how accurately each word described the WebCT on a 5-point Likert-scale. Source: Zhang and Li (2005).
AQ. Arousal quality PQ. Pleasant quality
AQ1. Intense PQ1. Pleasant
AQ2. Arousing PQ2. Nice
AQ3. Active PQ3. Pleasing
AQ4. Alive PQ4. Pretty
AQ5. Forceful PQ5. Beautiful
SQ. Sleepy quality UQ. Unpleasant quality
SQ1. Inactive UQ1. Dissatisfying
SQ2. Drowsy UQ2. Displeasing
SQ3. Idle UQ3. Repulsive
SQ4. Lazy UQ4. Unpleasant
SQ5. Slow UQ5. Uncomfortable
References
Agarwal, R., & Karahanna, E. (2000). Time flies when you’re having fun: Cognitive absorption and beliefs about information technology usage. MIS Quarterly, 24(4), 665–694.
Aiken, L. S., & West, S. G. (1991). Multiple regression: Testing and interpreting interactions. Newbury Park, CA: Sage Publications.
Area Moreira, M. (2005). Internet y la calidad de la educación superior en la perspectiva de la convergencia europea. Revista Española de Pedagogía, 63, 85–100.
Atkinson, M., & Kydd, C. (1997). Individual characteristics associated with World Wide Web use: An empirical study of playfulness and motivation. The Data Base for Advances
in Information Systems, 28(2), 53–62.
Bagozzi, R. P., Gopinath, M., & Nyer, P. U. (1999). The role of emotions in marketing. Journal of Academy of Marketing Sciences, 27(2), 184–206.
Barak, M. (2007). Transition from traditional to ICT-enhanced learning environments in undergraduate chemistry courses. Computers & Education, 48(1), 30–43.
Barclay, D., Higgins, C., & Thompson, R. (1995). The Partial Least Squares (PLS) approach to causal modeling: Personal computer adoption and use as an illustration. Technology
Studies, 2(2), 285–309.
Bem, D. J. (1972). Self-perception theory. In L. Berkowitz (Ed.). Advances in experimental social psychology (Vol. 6, pp. 1–62). New York: Academic Press.
Bower, G. H. (1981). Mood and memory. American Psychologist, 36, 129–148.
Bower, G. H. (1991). Mood congruity of social judgments. In J. P. Forgas (Ed.), Emotion and social judgments (pp. 31–53). Elmsford, NY: Pergamon Press.
Carmines, E. G., & Zeller, R. A. (1979). Reliability and validity assessment. Newbury Park, CA: Sage Publications.
Chen, Z., & Dubinsky, A. J. (2003). A conceptual model of perceived customer value in E-Commerce. A preliminary investigation. Psychology & Marketing, 20(4), 323–347.
Chin, W. W. (1994). PLS-graph manual. Unpublished. University of Calgary, Calgary.
Chin, W. W. (1998). The Partial Least Squares approach for structural equation modelling. In G. A. Marcoulides (Ed.), Modern methods for business research (pp. 295–336).
Mahwah, NJ: Lawrence Erlbaum Associates.
10. 46 M.J. Sanchez-Franco / Computers & Education 54 (2010) 37–46
Chin, W. W. (2003). PLS-Graph (version 3.00, Build 1058) [Computer software]. University of Houston.
Chin, W. W., & Gopal, A. (1995). Adoption intention in GSS: Relative importance of beliefs. The DataBase for Advances in Information Systems, 26(2–3), 42–64.
Chin, W. W., Marcolin, B. L., & Newsted, P. R. (2003). A Partial Least Squares latent variable modeling approach for measuring interaction effects: Results from a Monte Carlo
simulation study and an electronic mail emotion/ adoption study. Information Systems Research, 14(2), 189–217.
Cohen, J. (1988). Statistical power analysis for the behavioral sciences. Hillsdale, NJ: Lawrence Erlbaum.
Csikszentmihalyi, M. (1975). Beyond boredom and anxiety. San Francisco, CA: Jossey-Bass Publishers.
Csikszentmihalyi, M. (1990). Flow: The psychology of optimal experience. New York: Harper & Row.
Csikszentmihalyi, M. (1997). Finding flow: The psychology of engagement with everyday life. New York: Basic Books.
Darlington, R. B. (1990). Regression and linear models. New York: McGraw-Hill.
Davis, F. D. (1989). Perceived usefulness, perceived ease of use and user acceptance of information. MIS Quarterly, 13(September), 319–340.
Davis, F. D., Bagozzi, R. P., & Warshaw, P. R. (1992). Extrinsic and intrinsic motivation to use computers in the workplace. Journal of Applied Social Psychology, 22(14),
1111–1132.
Eroglu, S. A., Machleit, K. A., & Davis, L. M. (2003). Empirical testing of a model of online store atmospherics and shopper responses. Psychology and Marketing, 20(2), 139–150.
Falk, R. F., & Miller, N. B. (1992). A primer for soft modeling. Akron, Ohio: University of Akron Press.
Fenech, T. (1998). Using perceived ease of use and perceived usefulness to predict acceptance of the World Wide Web. Computer Networks and ISDN Systems, 30(1–7),
629–630.
Fornell, C., & Larcker, D. F. (1981). Evaluating structural models with unobservable variables and measurement error. Journal of Marketing Research, 18(1), 39–50.
Galanouli, D., Murphy, C., & Gardner, J. (2004). Teachers’ perceptions of the effectiveness of ICT-competence training. Computers & Education, 43(1–2), 63–79.
Gefen, D., & Straub, D. W. (1997). Gender differences in the perception and use of e-mail: An extension to the technology acceptance model. MIS Quarterly, 21(4), 389–400.
Geisser, S. (1975). The predictive sample reuse method with applications. Journal of the American Statistical Association, 70, 320–328.
Ghani, J. A., & Deshpande, S. P. (1994). Task characteristics and the experience of optimal flow in human–computer interaction. The Journal of Psychology, 128(4), 381–391.
Hammoud, L., Love, S., Baldwin, L., & Chen, S. Y. (2008). Evaluating WebCT use in relation to students’ attitude and performance. International Journal of Information and
Communication Technology Education, 4(2), 26–43.
Henseler, J., & Fassott, G. (2007). Testing moderating effects in PLS path models: An illustration of available procedures. In V. Vinzi, W. W. Chin, J. Henseler, & H. Wang (Eds.),
Handbook of Partial Least Squares. Concepts, methods, and applications in marketing and related areas. Heidelberg: Springer.
Hu, P. J., Chau, P. Y. K., Sheng, O. R. L., & Tam, K. Y. (1999). Examining the technology acceptance model using physician acceptance of telemedicine technology. Journal of
Management Information Systems, 16(2), 91–112.
Igbaria, M., Parasuraman, S., & Baroudi, J. J. (1996). A motivational model of microcomputer usage. Journal of Management Information Systems, 13(1), 127–144.
Isen, A. M. (2000). Some perspectives on positive affect and self-regulation. Psychological Inquiry, 11, 184–187.
Johnson, R. A., & Hignite, M. A. (2000). Applying the technology acceptance model to the WWW. Academy of Information and Management Sciences Journal, 3(2), 130–142.
Khalid, H. M. (2006). Embracing diversity in user needs for affective design. Applied Ergonomics, 37(4), 409–418.
Lee, Y.-Ch. (2006). An empirical investigation into factors influencing the adoption of an e-learning system. Online Information Review, 30(5), 517–541.
Legris, P., Ingham, J., & Collerette, P. (2003). Why do people use information technology? A critical review of the technology acceptance model. Information & Management,
40(3), 191–204.
Limniou, M., Papadopoulos, N., & Whitehead, Ch. (2009). Integration of simulation into pre-laboratory chemical course: Computer cluster versus WebCT. Computers &
Education, 52(1), 45–52.
Lin, J. C. C., & Lu, H. (2000). Towards an understanding of the behavioral intention to use a Web site. International Journal of Information Management, 20(3), 197–208.
Lu, J., Yu, C. S., & Liu, C. (2003). Learning style, learning patterns, and learning performance in a WebCT-based MIS course. Information & Management, 40(6), 497–507.
Martínez-Torres, M. R., Toral, S. L., Barrero, F., Gallardo, S., Arias, M., & Torres, T. (2008). A technological acceptance of e-learning tools used in practical and laboratory
teaching, according to the European higher education area. Behaviour & Information Technology, 27(6), 495–505.
Ngai, E. W. T., Poon, J. K. L., & Chan, Y. H. C. (2007). Empirical examination of the adoption of WebCT using TAM. Computers & Education, 48(2), 250–267.
Novak, T. P., Hoffman, D. L., & Yung, Y.-F. (2000). Measuring the customer experience in online environments: A structural modeling approach. Marketing Science, 19(1), 22–42.
Nunes, M. B., & McPherson, M. (2003). Action research in continuing professional distance education. Journal of Computer Assisted Learning, 19(4), 429–437.
Nunnally, J. C. (1978). Psychometric theory (2nd ed.). New York: McGraw-Hill.
Ong, Ch., Lai, J.-Y., & Wang, Y.-S. (2004). Factors affecting engineers’ acceptance of asynchronous e-learning systems in high-tech companies. Information & Management, 41,
795–804.
Russell, J. A. (1980). A circumplex model of affect. Journal of Personality and Social Psychology, 39, 1161–1178.
Russell, J. A. (2003). Core affect and the psychological construction of emotion. Psychological Review, 110(1), 145–172.
Russell, J. A., & Pratt, G. (1980). A description of the affective quality attributed to environments. Journal of Personality and Social Psychology, 38, 311–322.
Saadé, R. G. (2003). Web-based educational information system for enhanced learning, EISEL: Student assessment. Journal of Information Technology Education, 2, 267–277.
Sánchez-Franco, M. J. (2005). Extrinsic plus intrinsic human factors influencing the web usage. In Y. Gao (Ed.), Web systems design and online consumer behavior (pp. 156–175).
NY: Idea Group Inc.
Sánchez-Franco, M. J. (2006). Exploring the influence of gender on the web usage via partial least squares. Behaviour & Information Technology, 25(1), 19–36.
Sánchez-Franco, M. J., & Roldan, J. L. (2005). Web acceptance and usage model: A comparison between goal-directed and experiential web users. Internet Research, 15(1),
21–48.
Sánchez-Franco, M. J., Martínez-López, Fco. J., & Martín-Velicia, F. A. (2009). Exploring the impact of individualism and uncertainty avoidance in Web-based electronic
learning: An empirical analysis in European higher education. Computers & Education, 52(3), 588–598.
Selwyn, N. (2007). The use of computer technology in university teaching and learning: A critical perspective. Journal of Computer Assisted Learning, 23(2), 83–94.
Shankar, V., Smith, A. K., & Rangaswamy, A. (2003). Customer satisfaction and loyalty in online and offline environments. International Journal of Marketing Research, 20(2),
153–175.
Stone, M. (1974). Cross-validatory choice and assessment of statistical predictions. Journal of the Royal Statistical Society, 36, 111–147.
Teo, T. S. H., Lim, V. K. G., & Lai, R. Y. C. (1999). Intrinsic and extrinsic motivation in internet usage. Omega, 27(1), 25–37.
Toral, S. L., Barrero, F., & Martínez-Torres, M. R. (2007). Analysis of utility and use of a web based tool for digital signal processing teaching by means of a technological
acceptance model. Computers & Education, 49(4), 957–975.
Venkatesh, V. (1999). Creation of favorable user perceptions: Exploring the role of intrinsic motivation. Management Information Systems Quarterly, 23(2), 239–260.
Venkatesh, V. (2000). Determinants of perceived ease of use: Integrating control, intrinsic motivation, and emotion into the technology acceptance model. Information Systems
Research, 11(4), 342–365.
Venkatesh, V., Speier, C., & Morris, M. G. (2002). User acceptance enablers in individual decision making about technology: Toward and integrated model. Decision Sciences,
33(2), 297–316.
Venkatesh, V., Morris, M. G., Davis, G. B., & Davis, F. D. (2003). User acceptance of information technology: Toward a unified view. MIS Quarterly, 27(3), 425–478.
Vogel, D., & Klassen, J. (2001). Technology-supported learning: Status, issues and trends. Journal of Computer Assisted Learning, 17(1), 104–114.
Werts, C. E., Linn, R. L., & Jöreskog, K. G. (1974). Interclass reliability estimates: Testing structural assumptions. Educational and Psychological Measurement, 34, 25–33.
Yi, M. Y., & Hwang, J. (2003). Predicting the use of Web-based information systems: Self-efficacy, enjoyment, learning goal orientation, and the technology acceptance model.
International Journal of Human–Computer Studies, 59(4), 431–449.
Zhang, P., & Li, N. (2004). Love at first sight or sustained effect? The role of perceived affective quality on users’ cognitive reactions to IT. In Proceedings of International
Conference on Information Systems (ICIS’04), Washington, DC, (pp. 283–296).
Zhang, P., & Li, N. (2005). The importance of affective quality. Communications of the ACM, 48(9), 105–108.
Zhang, P., Li, N., & Sun, H. (2006). Affective quality and cognitive absorption: Extending technology acceptance research. In Proceedings of the Hawaii international conference on
system sciences, January.