SlideShare une entreprise Scribd logo
1  sur  137
By: Anand Bobade (nmbobade@gmail.com)
Learn Project Management & prepare for PMP exam:
• Learn visually
• Detailed coverage of all PMP concepts
• Sample Questions
PMBOK Chapter 8 :
Project Quality Management
Plan Quality
management
Perform Quality
Assurance
Perform Quality
Control
Monitoring & ControlPlanning Executing
By: Anand Bobade (nmbobade@gmail.com)
Chap 8- Project Quality Management
Introduction
Quality & Quality management definition
Quality theories
Quality management processes
Each process in details
Review of Quality Management knowledge area
Exam Essentials & Tips
Self assessment
By: Anand Bobade (nmbobade@gmail.com)
Quality
Introduction -> What is Quality?
Quality is Conformance to requirements (by- Philip B.
Crosby)
Quality is the degree to which a set of inherent
(existing) characteristics fulfils requirements.
High quality Product:
• Meets or exceeds customers’ requirements
Low quality product:
• Not meeting stated requirements
By: Anand Bobade (nmbobade@gmail.com)
Introduction -> What is Quality?
Product can be certified as Quality product if:
• to the Product requirements.Conformance
• adhere to the Requirements.Results
• to the Requirements.No deviation
• Do it right the first time.No rework
• no defects in the delivered product or
service.Zero Defects
By: Anand Bobade (nmbobade@gmail.com)
Quality management (ISO 9000:2005):
• Coordinated activities to direct and control an
organization with regard to Quality.
Introduction -> What is Quality Management?
By: Anand Bobade (nmbobade@gmail.com)
It includes creating & following policies & procedures in
order to ensure project meet it’s defined needs.
Project
Quality
Management
Creating &
following -
Policies &
Procedures
Meet defined
quality needs
of the Project
PMI - Project Quality Management Definition
By: Anand Bobade (nmbobade@gmail.com)
Who is effected by Quality?
Customer
End users
Management
Project
Manager
Project Team
By: Anand Bobade (nmbobade@gmail.com)
Introduction – Quality vs. Grade
If you opted for Saloon CAR, you probably choose it over the regular
looking CAR because it looks superior.
However, this Saloon CAR will looks low grade compared to Sports CAR.
By: Anand Bobade (nmbobade@gmail.com)
Introduction– Quality vs. Grade
Quality of a product is a
measure of how closely it
matches its intended purpose.
Grade is a measure of the value
people put on a product.
Different technical
characteristics.
High grade product might be low quality product.
Regardless of the grade, the quality should be high. In any case, quality cannot be
compromised.
By: Anand Bobade (nmbobade@gmail.com)
Introduction – Precision vs. Accuracy
Accuracy: Refers to how far you are from the true value.
(True value is yellow circle)
This is accurate but not Precise.
Precision: Refers to how close do you get to the same
value if you repeated the exercise several times.
This is precise but not accurate.
Precise and accurate: Quality of product will be
considered high if results are Precise and accurate.
By: Anand Bobade (nmbobade@gmail.com)
Screw making machine Quality testing
• Between 5-7 CM.
Expected screw
length
• All length between 5.5 to 6.5 CM.
• Means they are Accurate.
Results of cycle 1
• Outside expected range (above 7, but all
between 7.1 & 7.3). Hence Precise.Results of cycle 2
Introduction – Precision vs. Accuracy
By: Anand Bobade (nmbobade@gmail.com)
Introduction -> Key concepts
Customer satisfaction :
• Understanding, evaluating, defining and managing
requirements, so that customer expectations are met.
Prevention over inspection:
• Quality should be planned, designed, and built into into the
project’s deliverables.
• It should not be inspection driven (reactive).
Continuous improvement:
• The PDCA (plan-do-check-act) cycle is the basis for quality
improvement.
• Well known quality improvement theories include: Total Quality
Management & Six Sigma.
By: Anand Bobade (nmbobade@gmail.com)
Introduction – Quality Theories
Six Sigma
(Introduced by Bill
Smith at Motorola)
Just In Time
(Toyota)
Total Quality
Management - W.
Edwards Deming:
ISO – International
Standard
Organization
80/20 principle -
Joseph Juran
Zero Defects: Philip
Crosby:
By: Anand Bobade (nmbobade@gmail.com)
Six Sigma
Six Sigma: Introduced by Bill Smith at Motorola.
Six sigma helps in Process control.
It refines process to get rid of human error & outside influences.
Uses precise measurements & continuous refinements.
Quality Theories -> Six Sigma
Define the problem
& the objective
Analyse the processes.
Define factors of influence
Assure that improvements
will sustain
What do we need to improve?
Can we measure this?
Identify & implement
improvements
By: Anand Bobade (nmbobade@gmail.com)
Six Sigma
Quality Theories -> Six Sigma
Quality levels:
Set of techniques and tools for process improvement.
• Defects Per Million OpportunitiesDPMO :
Sigma value
1
2
3
4
5
6
Compliance
percentage
31%
69%
93.3%
99.38%
99.977%
99.99966%
Defects
percentage
69%
31%
6.7%
0.62%
0.023%
0.00034%
DPMO
691,462
308,538
66,807
6,210
233
3.4
Sigma values
will be used
in calculation
By: Anand Bobade (nmbobade@gmail.com)
TQM
Total Quality Management - W. Edwards Deming:
Comprehensive & structured approach to
organizational management that seeks to improve
quality of products & services.
Customer focused - objective is to consistently improve
Customer satisfaction.
Continuous on-going refinements in response to
continuous feedback.
Everyone is involved.
14 steps of total Quality Management, Plan-Do-Check-
Act cycle.
Quality Theories -> Total Quality Management
By: Anand Bobade (nmbobade@gmail.com)
ISO
ISO standards:
There are various ISO standards & certifications.
ISO 9000 - Quality
management
ISO 27001 -
Information security
ISO 10006 – Quality in
Project Management
ISO 9126 – Software
quality standards
ISO 31000 - Risk
management
Introduction – ISO Standards
The project quality management as described in PMI PMBOK®, is intended to be
compatible with ISO.
By: Anand Bobade (nmbobade@gmail.com)
ISO
ISO Quality management:
Provide guidance & tools, to ensure products &
services consistently meet customer’s requirements,
and that quality is consistently improved.
Customer Satisfaction Prevention over
inspection
Continuous
improvement
Management
Responsibility
Cost of Quality (COQ)
Introduction – ISO Standards
By: Anand Bobade (nmbobade@gmail.com)
Introduction – Quality principals
80/20 principle - Joseph Juran:
• 80% of outcomes can be attributed to 20% of causes.
• E.g.,:
• 80% of defects found in 20% modules of the system.
• Fixing 20% modules will fix 80% of defects.
Zero Defects: Philip Crosby:
• Management-led program to eliminate defects in industrial
production.
• Cost of poor quality, prevention over inspection and zero
defects.
• Quality is “conformance to requirements”
By: Anand Bobade (nmbobade@gmail.com)
Introduction – Evolution of Quality Management
1950 1960 1970 1980 1990 2000 2007
Quality
Control
Quality
Assurance
ISO 9000
TQM- total
Quality
Management
Six Sigma
By: Anand Bobade (nmbobade@gmail.com)
Process improvement models:
Organizational Project
Management Maturity
Model (OPM3®)
Capability Maturity
Model Integrated
(CMMI®)
Malcolm Baldrige
Introduction -> Process improvement models
By: Anand Bobade (nmbobade@gmail.com)
CMMI
Capability Maturity Model Integration - Improve overall
software quality (design, development and deployment)
Introduction – CMMI
Level 1
Initial
Level 2
Managed
Level 3
Defined
Level 4
Quantitative
ly managed
Level 5
Optimizing
Process unpredictable,
poorly controlled & reactive.
Process characterized for
projects and is managed
Process characterized for
organization and is proactive
Process is quantitatively
measured and controlled
Focus on continuous process
improvement
By: Anand Bobade (nmbobade@gmail.com)
8. Project Quality Management Knowledge Area
8.1 Plan Quality Management:
• Identifying quality requirements & standards, and
document how the project will demonstrate
compliance.
8.2 Perform Quality Assurance:
• Auditing the quality requirements and the results
from quality control measurements, to ensure that
appropriate quality standards are used.
8.3: Control Quality:
• Monitoring and recording results of executing the
quality activities to assess performance and
recommend necessary changes.
By: Anand Bobade (nmbobade@gmail.com)
Learn Project Management & prepare for PMP exam:
• Learn visually
• Detailed coverage of all PMP concepts
• Sample Questions
By: Anand Bobade (nmbobade@gmail.com)By: Anand Bobade (nmbobade@gmail.com)
8.1 Plan Quality Management
Plan Quality Management definition
Plan Quality Management - ITTO
What is Quality Management Plan?
What is process improvement Plan?
Seven basic Quality tools
Review
Self Assessment
8.1 I T&T O
By: Anand Bobade (nmbobade@gmail.com)
Identifying quality requirements & standards for project
& it’s deliverables, & documenting how project will
demonstrate compliance with quality requirements.
It provides guidance & direction on how quality will be
managed & validated throughout Project.
8.1 Plan Quality Management
Project
Requirements
Identify Document
8.1 I T&T O
By: Anand Bobade (nmbobade@gmail.com)
8.1 Plan Quality Management
Inputs (6)
• Project management
plan
• Stakeholder register
• Risk register
• Requirements
documentation
• EEF
• OPA
Tools &
Techniques(8)
• Cost-benefit analysis
• Cost of quality
• Seven basic quality
tools
• Benchmarking
• Design of
experiments
• Statistical sampling
• Additional quality
planning tools
• Meetings
Outputs (5)
• Quality management
plan
• Process improvement
plan
• Quality metrics
• Quality checklists
• Project documents
updates
8.1 I T&T O
By: Anand Bobade (nmbobade@gmail.com)
PMP Stakeholder
register Risk register
Requirements
documentation
EEF OPA
8.1 Plan Quality Management->Input
8.1 I T&T O
By: Anand Bobade (nmbobade@gmail.com)
8.1 Plan Quality Management->Input
Scope baseline (Work Breakdown Structure ,
WBS Dictionary, Schedule baseline), Cost
baseline, Other management Plans
Identifying those stakeholders possessing a
particular interest or having impact on the
quality.
Contains threats & opportunities that may
impact quality requirements.
8.1 I T&T O
By: Anand Bobade (nmbobade@gmail.com)
8.1 Plan Quality Management->Input
Captures requirements that project should meet
pertaining to stakeholders expectations.
Project ( including product) & quality requirements.
Government Agency regulations.
Rules, standards & guidelines.
Working or operating conditions.
Organizational quality, policies, procedures and
guidelines.
Historical Database & Lesson learned.
8.1 I T&T O
By: Anand Bobade (nmbobade@gmail.com)
Cost-benefit analysis Cost of quality
Seven basic quality
tools
Benchmarking
Design of
experiments
Statistical sampling
Additional quality
planning tools
Meetings
8.1 Plan Quality Management->T&T
8.1 I T&T O
By: Anand Bobade (nmbobade@gmail.com)
Cost of quality
All cost incurred over the life of a Product:
8.1 Plan Quality Management->T&T->Cost of Quality
Preventing non-conformance to the requirements.
Appraising conformance to the requirements.
Failing to meet requirements (reworks).
8.1 I T&T O
By: Anand Bobade (nmbobade@gmail.com)
8.1 Plan Quality Management->T&T->Cost of Quality
8.1 I T&T O
By: Anand Bobade (nmbobade@gmail.com)
Cost-benefit
Analysis
A financial analysis tool used to determine the benefits
provided by a project against its costs.
Benefit of
meeting
quality
requirements
Less rework
Higher
productivity
Lower costs
Increased
stakeholder
satisfaction.
The primary cost of meeting quality requirements is expenses
associated with quality management activities.
8.1 Plan Quality Management->T&T->Cost Benefit Analysis
Cost of quality
8.1 I T&T O
By: Anand Bobade (nmbobade@gmail.com)
Seven basic
quality tools Cause-and-Effect Flowcharts Check-sheet
Pareto Diagram Histograms Control Charts
Scatter Diagram
8.1 Plan Quality Management->T&T-> 7 Basic quality tools
8.1 I T&T O
Quality
Planning
Quality
Assurance
Quality
Control
7QT
By: Anand Bobade (nmbobade@gmail.com)
Cause-and-Effect Diagram (Fishbone or Ishikawa diagrams):
• It traces complaints about quality problems.
• Help you find the root cause of a problem.
8.1 Plan Quality Management->T&T-> 7QT-> C&E Diagrams
Major causes are further investigated.
At the end, entire diagram is analysed & possible causes are identified.
5 whys technique: Repeat the question “Why”, to lead to the root cause of the Quality
8.1 I T&T O
Uses brainstorming
Identify problem.
Work out major factors
involved.
Identify possible causes.
Analyse diagram
Major
causes
Contributing
causes
Problem to
be solved
7QT
By: Anand Bobade (nmbobade@gmail.com)
Flowcharts (or process maps):
• A graphical representation of a process showing relationships among
process steps.
• It transforms one or more input to one or more outputs.
• Flowcharts display sequence of steps.
8.1 Plan Quality Management->T&T->7QT->Flowcharts
•Suppliers, Inputs, Process, Outputs, CustomersSIPOC:
8.1 I T&T O7QT
By: Anand Bobade (nmbobade@gmail.com)
Check sheets (also known as Tally sheets):
• Collect data about a problem during inspections.
• Organize facts that will facilitate effective collection of data
about quality problem.
8.1 Plan Quality Management->T&T->7QT->Check sheets
Defect classification Check sheet
Sr. No Defect Classification No of Defects
1 User Interface Defects 320
2 Unexpected exceptions 166
3 System Crashes 25
4 Wrong Calculation 33
5 Not according to requirements 326
6 Integration Failures 60
7 Others 70
Total Defects 1000
8.1 I T&T O7QT
By: Anand Bobade (nmbobade@gmail.com)
Histograms (by Karl Pearson): - Special types of bar charts.
• Summarize the distribution of a data set.
• Graphical representation of distribution of numerical data.
• Each bar represents characteristic of a problem & height
represents its frequency.
Roll No Grade
1001 33
1002 25
1003 26
1004 78
1005 76
1006 73
1007 80
1008 71
1009 72
1010 72
1011 78
1012 70
1013 65
1014 66
1015 68
1016 61
1017 62
1018 63
1019 60
1020 66
1021 60
1022 70
1023 55
1024 50
1025 59
1026 50
1027 53
1028 59
1029 52
1030 53
1031 55
8.1 Plan Quality Management->T&T->7QT->Histograms
Bin Units Frequency
0 0
5 0
10 0
15 0
20 0
25 0
30 2
35 1
40 2
45 1
50 6
55 9
60 14
65 4
70 7
75 1
80 5
85 0
90 0
95 0
100 0
0 0 0 0 0 0 2 1 2 1
6
9
14
4
7
1
5
0 0 0 0
0
2
4
6
8
10
12
14
16
0 5 10 15 20 25 30 35 40 45 50 55 60 65 70 75 80 85 90 95 100
No.ofStudents
Percentage
Students Percentage
1 2 3
Ex: Analyse student performance through Histogram:
1. List all students grades (e.g., 500 students)
2. Create bins (categories like 10 to 15%) & add frequencies.
3. Plot the histogram.
8.1 I T&T O7QT
By: Anand Bobade (nmbobade@gmail.com)
8.1 Plan Quality Management->T&T->7QT->Histograms
Observations:
1) Distribution of data is
based on a bell curve.
2) Steep Bell Curve –
Process in control.
3) Flat Curve – Process out
of control.
0 0 0 0 0 0 2 1 2 1
6
9
14
4
7
1
5
0 0 0 0
0
2
4
6
8
10
12
14
16
0 5 10 15 20 25 30 35 40 45 50 55 60 65 70 75 80 85 90 95 100
No.ofStudents
Percentage
Students Percentage All Bars are of
Equal widthOverall shape
Shows
Distribution
There are 5
measurements
between 75-80
8.1 I T&T O7QT
By: Anand Bobade (nmbobade@gmail.com)
Pareto Diagram:
• It’s a histogram that can help you identify & prioritize problem areas.
• Pareto analysis (80-20 rule), means that, 80% of problems are often
due to 20% of the causes.
33
65
81
88
94 98 100
1
11
21
31
41
51
61
71
81
91
1 2 3 4 5 6 7
Percentage
Defects per Category
Defects analysis
8.1 Plan Quality Management->T&T->7QT->Pareto Diagram
Sr. No
Defect
Classification
No of
Defects
1
Not according to
requirements
326
2
User Interface
Defects
320
3
Unexpected
exceptions
166
4 Others 70
5 Integration Failures 60
6 Wrong Calculation 33
7 System Crashes 25
8.1 I T&T O
- 900
- 800
- 600
- 500
- 400
- 300
- 200
- 100
- 0
No.ofdefects
7QT
By: Anand Bobade (nmbobade@gmail.com)
8.1 Plan Quality Management->T&T->7QT->Pareto Diagram
When to use Pareto Charts:
When you have a lot of data for analysis.
When you want to identify main cause of problems.
When communicating data with stakeholders.
When you want to prioritize tasks.
When you want to see relative importance of data.
8.1 I T&T O7QT
By: Anand Bobade (nmbobade@gmail.com)
Control Charts (developed by Walter A. Shewhart):
• Graphic display that illustrates results of a process over time.
• Determine whether a process is in control or out of control.
• Prevent defects, rather than to detect or reject them.
Specification limit (USL or LSL) :
Point determines by customer.
Control limit (UCL or LCL) : It is point determine by
process owner. It’s typically 3 sigma.
8.1 Plan Quality Management->T&T->7QT->Control Charts
LSL
USL
8.1 I T&T O7QT
By: Anand Bobade (nmbobade@gmail.com)
Control Charts (developed by Walter A. Shewhart):
• Graphic display that illustrates results of a process over time.
• Determine whether a process is in control or out of control.
• Prevent defects, rather than to detect or reject them.
8.1 Plan Quality Management->T&T->7QT->Control Charts
• 68.27%1 Sigma
• 95.44%2 sigma
• 99.73%3 Sigma (UCL / LCL)
• 99.99%6 Sigma
Sigma is another name for standard deviation & indicates how much variance from mean has
been established as permissible in the process. Level of quality is indicated by 3 or 6 sigma.
3 Sigma
• 66,807 out of 1 million screws produced will
have some problems.
6 Sigma
• 3.4 out of 1 million screws produced will have
problems
8.1 I T&T O7QT
By: Anand Bobade (nmbobade@gmail.com)
8.1 Plan Quality Management->T&T->7QT->Control Charts
UCL=7CM
LCL=5CM
Upper Specification limit =7.25CM
Lower Specification limit =4.75 CM
Mean /
Average
= 6 CM
3
sigma
7.5
7.0
6.5
6.0
5.5
5.0
4.5
Qualityspecification
2 4 6 8 10 12 14 16 18 20
Sample
Length = 6 CM
8.1 I T&T O7QT
By: Anand Bobade (nmbobade@gmail.com)
8.1 Plan Quality Management->T&T->7QT->Control Charts
2 4 6 8 10 12 14 16 18 20
UCL=7CM
LCL=5CM
Upper Specification limit =7.25CM
Lower Specification limit =4.75 CM
Mean /
Average
= 6 CM
7.5
7.0
6.5
6.0
5.5
5.0
4.5
8.1 I T&T O7QT
By: Anand Bobade (nmbobade@gmail.com)
8.1 Plan Quality Management->T&T->7QT->Control Charts
Process is in control:
All points are between UCL & LCL.
Also called as normal Cause.
99.97% points (3 sigma) fall within
the control limits
4 standard deviations from mean
Analyse control chats shown in previous slide:
8.1 I T&T O7QT
By: Anand Bobade (nmbobade@gmail.com)
Out of control
Rule of Seven
8.1 Plan Quality Management->T&T->7QT->Control Charts
2 4 6 8 10 12 14 16 18 20
UCL=7CM
LCL=5CM
Upper Specification limit =7.25CM
Lower Specification limit =4.75 CM
Mean /
Average
= 6 CM
7.5
7.0
6.5
6.0
5.5
5.0
4.5
8.1 I T&T O7QT
By: Anand Bobade (nmbobade@gmail.com)
8.1 Plan Quality Management->T&T->7QT->Control Charts
Process is out of control - There is
one dot out of UCL, called as
special cause.
Rule of seven: Consecutive 7 time,
measurements fall on the one side
of the mean.
This also, means process is out of
control & need investigation.
Assignable causes – Variations may be caused by differences in
machines, workers overtime, etc. Identify the root cause
Analyse control chats shown in previous slide:
8.1 I T&T O7QT
By: Anand Bobade (nmbobade@gmail.com)
Scatter Diagram(scatter plot/ graph, correlation chart):
• Predict how change in an independent variable will
change a dependent variable.
8.1 Plan Quality Management->T&T->7QT->Scatter Diagram
Show if there is a relationship between two
variables.
Usually first variable is independent &
second is dependent on first.
Useful when one variable is easy to
measure & other is not.
Closer data points are to a diagonal line,
stronger relation.
8.1 I T&T O7QT
By: Anand Bobade (nmbobade@gmail.com)
8.1 Plan Quality Management->T&T->7QT->Scatter Diagram
Three Types of correlation:
No Correlation
Moderate Correlation
Strong Correlation
Both Moderate & Strong
correlation can be positive or
negative.
Regression line
No
Correlation
8.1 I T&T O7QT
By: Anand Bobade (nmbobade@gmail.com)
Example: The Y axis show number of Accidents and X axis show speed
of vehicle. As speed increases, accidents increases.
8.1 Plan Quality Management->T&T->7QT->Scatter Diagram
Moderate
Correlation
Strong
Correlation
Accidents
Positive Positive
Speed of vehicle
140 to 180 KM/Hour
Speed of vehicle
180 to 220 KM/Hour
8.1 I T&T O7QT
By: Anand Bobade (nmbobade@gmail.com)
Example: The Y axis show cost of Project resources and X axis show project profile.
As cost of project resources increases, profit will decrease.
If resource cost is one of the factor then correlation will be moderate, however if this
is only factor then correlation will be strong.
8.1 Plan Quality Management->T&T->7QT->Scatter Diagram
Strong
Correlation
Moderate
Correlation
Negative NegativeReducing project profit Reducing project profit
CostofProjectresources
8.1 I T&T O7QT
By: Anand Bobade (nmbobade@gmail.com)
8.1 Plan Quality Management->T&T->7QT Overview
Traces complaints about quality problems.
Process showing relationships among process steps. Process Map.
Effective collection of data about potential quality problem.
Inspection.
Histogram. 80-20 rule. Identify & prioritize problem areas.
Central tendency, dispersion. Frequency.
Results of a process over time. Identify process gaps. Preventive.
Relationship between two variables.
8.1 I T&T O7QT
By: Anand Bobade (nmbobade@gmail.com)
Benchmarking
Comparing actual or planned practices, such as processes &
operations, to other organizations.
Comparison may be between two companies, projects, products,
materials etc
The organizations compared can be internal or external.
8.1 Plan Quality Management->T&T->Benchmarking
8.1 I T&T O
Identify best practices, generate ideas for improvement, and provide a basis for
measuring performance.
By: Anand Bobade (nmbobade@gmail.com)
Design of
experiments
Identify factors that can influence different variables of product
or process.
Used to determine number & type of tests needed to achieve
required quality.
We can change multiple variables at a time, to find optimal condition.
Once we know, factors that influence product, quality check list will be
developed for them.
8.1 Plan Quality Management->T&T->DOE
8.1 I T&T O
By: Anand Bobade (nmbobade@gmail.com)
Statistical
sampling
Choosing few items as a sample from a larger group of items.
During planning we will decide, how to do sampling in quality
control process.
Help to determining cost of quality (COQ)
Types of Data measurement:
Variable (Continuous) :
Measure with yes or no. Can be
divided.
E.g., Typical variable values will be like
students passes exam (Pass or fail).
Attribute (discrete):
Measure by counting. Can’t divide.
E.g., Number of children in a family, Or
attendance at a theatre. It can not be
like 1.5
8.1 Plan Quality Management->T&T->Statistical Sampling
8.1 I T&T O
By: Anand Bobade (nmbobade@gmail.com)
Additional
quality planning
tools
Brainstorming:
Used for generating ideas.
Force Field Analysis:
Diagrams of forces for and against change.
Nominal Group Technique:
In this technique to vote for ideas to be further
discussed by a larger group of people .
Quality Control and Management Tools:
This tools will be explained in the next process.
8.1 Plan Quality Management->T&T->Add. QPT
8.1 I T&T O
By: Anand Bobade (nmbobade@gmail.com)
Force Field Analysis:
• It is a decision-making technique.
• Helps to make a decision by analysing forces for & against a
change.
8.1 Plan Quality Management->T&T->Add. QPT
Eliminate re-keying errors
Faster execution of administrative work
Online documentation eliminate work
Reduces need for clerical staff
Increase control Auditing capabilities
Managers unhappy with clerical work
Requires Training of more Peoples
Some activity cost shift to high paid staff
Cost of eliminating clerical cost
Start up cost
HumanResourceSystem
Implementation
Forces for Change Forces against Change
Relativeforcestrength
1
1
1
1
1
2
2
23
4
Total = 10 Total = 8
8.1 I T&T O
By: Anand Bobade (nmbobade@gmail.com)
Meetings
8.1 Plan Quality Management->T&T->Meetings
8.1 I T&T O
Any one with quality related responsibilities should
attend meetings.
Key participants:
Project
Manager
Sponsor
Quality
manager
Selected
team
members
Selected
stakeholders
Discuss &
agree on
quality
standards.
Discuss &
agree on
quality
requirements
By: Anand Bobade (nmbobade@gmail.com)
8.1 Plan Quality Management->T&T->Summary
Cost of implementing quality requirements against benefits
Quality cost incurred over the life of a the Product
Cause-and-Effect, Flowcharts, Check-sheet, Pareto Diagram,
Histograms, Control chart, Scatter Diagram
Compare to past activities/standard
Change several factors for each experiment, to determine best
approach
Choosing few items as a sample from a larger group of items.
Additional QM tools: Brainstorming, Force Field Analysis, Nominal
Group Technique, Quality Control and Management Tools.
Quality related meetings
8.1 I T&T O
By: Anand Bobade (nmbobade@gmail.com)
Quality
management
plan
Process
improvement
plan
Quality metrics
Quality checklists
Project
documents
updates
8.1 Plan Quality Management->Outputs
8.1 I T&T O
By: Anand Bobade (nmbobade@gmail.com)
8.1 Plan Quality Management->Outputs
8.1 Plan Quality
Management:
8.2 Perform
Quality Assurance:
8.3: Control
Quality:
Quality
metrics
Process
improvement
plan
Quality
checklists
8.1 I T&T O
By: Anand Bobade (nmbobade@gmail.com)
Quality
Management
Plan
Quality management plans explains how organizations
quality policies will be implemented.
Depending on project, plan can be very detailed or simple.
Planned should be reviewed early.
Sharper focus on projects value proposition. (Cost of Quality, Cost
benefit analysis)
Details how Quality requirements are captured.
Should refer to Quality management standard followed by product.
May contain sample size of process to calculate it.
8.1 Plan Quality Management->Outputs ->QMP
8.1 I T&T O
By: Anand Bobade (nmbobade@gmail.com)
Process
Improvement
Plan
It details the steps that will help improving various process.
It helps you to analyse the existing business processes, identify
problems and rectify them to improve the.
It is implemented in the QA and QC processes. It contains:
• The purpose of process, inputs & outputs, Owner etcProcess Boundaries:
• Graphical depiction of the process.Process Configuration:
• Used for measuring process efficiency (Control limits).Process Metric:
• Targets for improvement.
Targets for Improved
Performance:
8.1 Plan Quality Management->Outputs->PIP
8.1 I T&T O
By: Anand Bobade (nmbobade@gmail.com)
Quality metrics
Description of a project/product attribute & how to measure it.
They are used to directly translate customer needs into acceptable
performance measures in both products and processes.
E.g., Finishing project within budget & time, freq. of defects,
failure rate
The metrics & tolerance level for variation is set in Quality plan.
8.1 Plan Quality Management->Outputs->Quality Metrics
Tactical Measure
Time
Cost
Resources
Scope
Sample Indicator
Schedule Performance Index (SPI) = Earned Value / Planned Value
Cost Performance Index (CPI) = Earned Value / Actual Cost
Amount of hours overspent per Testing cycle
Number of Change Requests
8.1 I T&T O
By: Anand Bobade (nmbobade@gmail.com)
Quality checklists
A structured tool used to verify that a set of required steps has
been performed.
It is a list of items you need to verify, check or inspect.
They are used in every imaginable field — from building
inspections to complex medical surgeries.
It allows you to ensure you don’t forget any important steps.
Developed based on product requirements.
List steps to be followed to achieve desired
quality.
8.1 Plan Quality Management->Outputs
8.1 I T&T O
By: Anand Bobade (nmbobade@gmail.com)
8.1 Plan Quality Management->Outputs
Project
documents
updates
Risk Register,
Requirement
Traceability Matrix
WBS dictionary
8.1 I T&T O
By: Anand Bobade (nmbobade@gmail.com)
8.1 Plan Quality Management
8.1 I T&T O
By: Anand Bobade (nmbobade@gmail.com)
Self Assessment
c. Raise Change request with recommendation to address the process Gap
Since you are responsible for the Quality assurance activities on the project. Its your
responsibility to officially inform to concern authority. Hence you must officially raise CR for CCB
review.
You are reporting to a very senior Project Manager on CRM project and responsible for
the quality assurance of the Project. You found some serious process gap in the
process followed by the team. If issue is not addressees in time, project may end up
with failure. How you will deal with the situation?
a. PM is responsible for the team activities hence don’t do anything.
b. Privately talk to PM and raise the issue.
c. Raise Change request with recommendation to address the process Gap
d. Direct team to work on the new process recommended by you.
8.1 I T&T O
By: Anand Bobade (nmbobade@gmail.com)
Self Assessment
b. Precision is consistency that the value of a repeated set of measurements are clustered and have little
scatter whereas accuracy is correctness that the measured value is very close to the true value.
PM is unsure of the difference between precision and accuracy and asks for your help
in understanding the difference between the two terms. Which of these responses
would be the best response to such a question?
a. Accuracy and Precision are equivalent and normally specified in the SOW by the
customer who issues the SOW.
b. Precision is consistency that the value of a repeated set of measurements are
clustered and have little scatter whereas accuracy is correctness that the measured
value is very close to the true value.
c. Accuracy is more important than precision. The project management team must
decide the level of accuracy required.
d. Accuracy is consistency that the value of a repeated set of measurements are
clustered and have little scatter whereas precision is correctness that the measured
value is very close to the true value.
8.1 I T&T O
By: Anand Bobade (nmbobade@gmail.com)
Self Assessment
d. Rework
Cost of failure detected internally is really an example of:
a. Cost of conformance
b. Quality Audit
c. Cost of Warranty
d. Rework
8.1 I T&T O
By: Anand Bobade (nmbobade@gmail.com)
Self Assessment
Answer: a. The design of experiments
The method used in the plan quality management process to identify
the factors that may influence specific variables of a product under
development is known as:
a. The design of experiments
b. Statistical sampling
c. Prototyping
d. Control charts
8.1 I T&T O
By: Anand Bobade (nmbobade@gmail.com)
Self Assessment
Answer: a. Business will accept the doors
Results are within UCL & LCL. It is not qualifying for rule of seven hence process in still
within control.
You are producing doors. The control limits set for the thickness of
doors for this process set to 9.8cm and 10.2cm. The business
specification limits are 9.7 cm and 10.3cm. During Inspection, it was
noticed that last 6 doors continuously has thickness of 10.25 cm long.
Select appropriate answer.
a. Business will accept the doors
b. Quality parameters are not meet
c. Business will reject the doors
d. The process is out of control and needs to be adjusted.
8.1 I T&T O
By: Anand Bobade (nmbobade@gmail.com)
Self Assessment
d. Performance is out of control as 7 consecutive results are above the mean.
During Control chart analysis, Process is considered out of control if seven consecutive data
poins are on one side of the mean (Reference: PMBOK 238)
Your are executing a Software Performance Test. According to the PT acceptable each
transaction should execute within 1 to 30
milliseconds. After the execution results were as 16, 18,16, 17, 17, 18, 16,18,16, 16,
17,15 milliseconds respectively. How you will interpret this data using control chart.
a. Performance is within control as all results are close to mean value.
b. Performance is within control as all results fall within acceptable range.
c. Performance is out of control as results are constantly varying.
d. Performance is out of control as 7 consecutive results are above the mean.
8.1 I T&T O
By: Anand Bobade (nmbobade@gmail.com)
Self Assessment
c. 7 consecutive points are on one side of the mean, even though they
are within the control limits
The “Rule of Seven” comes into play when
a. 7 points become out of control
b. 7 points breach the standard deviation
c. 7 consecutive points are on one side of the mean, even
though they are within the control limits
d. 7 random points that are on any side of the mean, but
within or without the control limits
8.1 I T&T O
By: Anand Bobade (nmbobade@gmail.com)
Learn Project Management & prepare for PMP exam:
• Learn visually
• Detailed coverage of all PMP concepts
• Sample Questions
By: Anand Bobade (nmbobade@gmail.com)By: Anand Bobade (nmbobade@gmail.com)
8.2 Perform Quality Assurance
Perform Quality Assurance definition
Perform Quality Assurance - ITTO
Difference between Quality control & assurance
Quality management & control tools
What is Quality Audit?
Review
Self Assessment
8.2 I T&T O
By: Anand Bobade (nmbobade@gmail.com)
8. Project Quality Management Knowledge Area
8.1 Plan Quality Management:
• It is the process of identifying quality requirements and/or
standards for the project and its deliverables
• Document how the project will demonstrate compliance with
relevant quality requirements.
8.2 Perform Quality Assurance:
• It is the process of auditing the quality requirements and the
results from quality control measurements to ensure that
appropriate quality standards and operational definitions are
used.
8.3: Control Quality:
• It is the process of monitoring and recording results of executing
the quality activities to assess performance and recommend
necessary changes.
8.2 I T&T O
By: Anand Bobade (nmbobade@gmail.com)
Process of auditing quality requirements & results from quality
control measurements to ensure appropriate quality standards &
operational definitions are used.
It facilitates the improvement of quality processes.
8.2 Perform Quality Assurance
Ensure Quality Standards &
Operational Definitions are used
Quality
requirement
s
Results from
Quality Control
Measures
8.2 I T&T O
By: Anand Bobade (nmbobade@gmail.com)Copyrights @ Anand Bobade (nmbobade@gmail.com – 055-5932004)
Quality Control & Quality Assurance process
Direct and Manage
Project work Control Quality
Plan Quality
management
Perform Quality
Assurance
Deliverables
Quality
Checklist
Sampling Inspection
(System testing,
Load testing etc)
Quality Control
measurements
Quality
Audit
Process
Analysis
QMPQuality Matrix
Process
Improvement plan
No. of defects
Defect classification
Perform Integrated
change Control
WPD
PMP Project
Documents
Verified Del’s WPI Validated changes
Change
Request
PMP
updates
Approved CR
Approved CR
review
8.2 I T&T O
By: Anand Bobade (nmbobade@gmail.com)
8.2 Perform Quality Assurance-> ITTO
Inputs (5)
• Quality
management
plan
• Process
improvement
plan
• Quality metrics
• Quality control
measurements
• Project
documents
Tools &
Techniques(3)
• Quality
management &
control tools
• Quality audits
• Process analysis
Outputs (4)
• Change requests
• PMP updates
• Project
documents
updates
• OPA updates
8.2 I T&T O
By: Anand Bobade (nmbobade@gmail.com)
Quality
Management Plan
Process
Improvement Plan
Quality
Metrics
Quality Control
Measurements Project documents
8.2 Perform Quality Assurance -> Input
8.2 I T&T O
By: Anand Bobade (nmbobade@gmail.com)
8.2 Perform Quality Assurance -> Input
8.1 Plan Quality
Management:
8.2 Perform
Quality Assurance:
8.3: Control
Quality:
8.2 I T&T O
By: Anand Bobade (nmbobade@gmail.com)
8.2 Perform Quality Assurance -> Input
Quality management plan:
• Contains plan for quality assurance and process
improvement.
Process Improvement Plan:
• This will tell us about the project’s process
improvement plan which needs to be aligned with
quality assurance process.
Quality Metrics:
• It will tells what we need to measure and what are
the allowable variation for our measurements.
8.2 I T&T O
By: Anand Bobade (nmbobade@gmail.com)
8.2 Perform Quality Assurance -> Input
Quality Control Measurements:
• Documented results of control quality activities
(measurements taken in Control Quality Process)
• Measurements are used as input for Quality
Assurance.
• Evaluate effectiveness of quality assurance process.
Project documents:
• It may influence Quality assurance work
• It should be monitored within the context of system
for Configuration management.
8.2 I T&T O
By: Anand Bobade (nmbobade@gmail.com)
Quality
Management &
Control Tools
Quality
Audits
Process Analysis
8.2 Perform Quality Assurance-> Tools & Techniques
8.2 I T&T O
By: Anand Bobade (nmbobade@gmail.com)
Quality
Management &
Control Tools
Affinity diagram PDPC Interrelationship Digraph
Tree Diagram Prioritization Matrix Network Diagram
Matrix Diagram
8.2 Perform Quality Assurance->T&T->QM&CT
8.2 I T&T O
By: Anand Bobade (nmbobade@gmail.com)
Affinity Diagram:
Classifying large number of ideas into groups
8.2 Perform Quality Assurance->T&T->QM&CT
8.2 I T&T O
By: Anand Bobade (nmbobade@gmail.com)
Interrelationship Digraph:
Provide a process for creative problem-solving in moderately
complex scenarios that possess logical relationships.
8.2 Perform Quality Assurance->T&T->QM&CT
1. City Growth
concentrated in
east & west
2. South has no
infrastructure to
attract city
growth
3. Highway 111
can’t be widened
through city
center
4. Existing
transportation
plan is
inadequate
5. Clock tower
tunnel can ease
City center
congestion
8. Congestion in
City center is
getting worse
7. Grand road can
be widened to
reduce
congestion
6. Additional river
bridge is required
to divert traffic
away from city
center
9. Main bridge on
river is located
close to City
center
An item with
large number of
outputs
considered as
cause of many
effect.
An item with
large number of
inputs can be
source of
Quality metrics.
8.2 I T&T O
By: Anand Bobade (nmbobade@gmail.com)
Process Decision Program Chart (PDPC) :
Used to understand a goal in relation to steps for getting to goal.
It identifies what might go wrong in a plan under development.
8.2 Perform Quality Assurance->T&T->QM&CT
Improve Product
Quality
Quality Training
Self Study
Difficult to track
progress
Provide oversight
of individuals
No interaction
benefit
Periodically bring
students
together
Training by outside
Expert
Costly
Allocate funds in
budget
Lack of internal
process
understanding
Train trainer on
internal
processes
Training by
internal SME
Time
commitment is
high
Get management
buy-in.
No training
experience
Train on
presentation
skills
X X XO O O
Project benefit do not overweight Risk Project benefit do not overweight Risk
Logistics Cost Schedule Selected Mitigation
benefit overweight mitigated Risk
Internal SME improve presentation skills.
Cost saving compared with external.
Team building with interaction &
participation.
8.2 I T&T O
By: Anand Bobade (nmbobade@gmail.com)
1. Divided & subdivide a complex plan into more simple steps.
2. Identify possible problems that will hinder implementing the plan.
4. Put O in front of the solutions that are practical and you put X in front of the
solutions that are not practical.
4. At the end you either change your plan where there is no practical solution or
prepare yourself accordingly.
8.2 Perform Quality Assurance->T&T->QM&CT
8.2 I T&T O
By: Anand Bobade (nmbobade@gmail.com)
8.2 Perform Quality Assurance->T&T->QM&CTWhentoUse:
Tree Diagram:
A systematic diagram of decomposition, used to visualize parent-
to-child relationships.
Issue is addressed at high level & you need to move to specific
details.
Used when analysing processes in detail.
Used when probing for the root cause of a problem.
Can be used as a communication tool.
8.2 I T&T O
By: Anand Bobade (nmbobade@gmail.com)
Matrix Diagram:
It shows relationship between factors, causes, and objectives.
It provides a compact way of representing many-to-many
relationships of varying strength.
8.2 Perform Quality Assurance->T&T->QM&CT
List 1 List 2
Item1 Item A
Item2 Item B
Item3 Item C
Item4 Item D
Item5 Item E ItemA
ItemB
ItemC
ItemD
ItemE
Item1 O
Item2 O O
Item3 O O O
Item4 O
Item5 O
8.2 I T&T O
By: Anand Bobade (nmbobade@gmail.com)
# Defect description
Module1
Module2
Module3
Module4
Module5
Module6
Module7
Module8
Module9
Module10
1 System is calculating wrong totals O O O O O O
2 System not meeting Performance O O O O
3 Background colour is not as per
specification.
O O O O O O O O O O
4 Validation message box has wrong
message.
O O O O
5 System O O O O O O O
Matrix Diagram example:
8.2 I T&T O
By: Anand Bobade (nmbobade@gmail.com)
Prioritization Matrices :
To prioritize tasks, issues or possible options based on
known, weighted criteria.
8.2 Perform Quality Assurance->T&T->QM&CT
# Defect description Duration Complexity Impact on other
modules
Total
1 System is calculating wrong totals 10 10 10 30
2 System not meeting Performance 5 5 5 15
3 Background colour is not as per
specification.
4 Validation message box has wrong
message.
5 System
# Development Duration Value
1 More than a week 5
2 2 to 7 days 7
3 Less than 2 days 10
# Development complexity Value
1 Complex 5
2 Medium 7
3 No impact 10
# Impact to other area’s Value
1 Major 5
2 Medium 7
3 Minor 10
Weighted
Criteria's
8.2 I T&T O
By: Anand Bobade (nmbobade@gmail.com)
It is used to sort a list of items into order of relative importance.
Used usually when short list of items needs to be prioritised.
The rigorous approach can be helpful in gaining agreement within a group
It helps to present right decision to lead to a more successful outcome.
8.2 Perform Quality Assurance->T&T->QM&CT
8.2 I T&T O
By: Anand Bobade (nmbobade@gmail.com)
8.2 Perform Quality Assurance->T&T->QM&CT
1. List items
to prioritise
2. Identify
criteria
3. Identify
weights
4. Score
items
5. Total
scores
6. Interpret
7. Take
action
Lowcostof
implementation
Lowrunning
costs
Highchanceof
success
Highchanceof
beingapproved
Weight: 2 5 3 4
Full supplier review system 1 3 5 2 11 40
New supplier managers 5 4 3 1 13 43
Short education program 3 1 3 4 11 36
Reselection of suppliers 2 1 2 3 8 27
Unweightedtotal
Weightedtotal
CriteriaScoring:
1 = meets criteria poorly
5 = meets criteria very well
Weighting:
1 = unimportant,
5 = very important
5x2 + 4x5
+ 3x3 + 1x4
1
2
3
4
5
New suppliers managers would need work to get approved.
Work on getting sponsorship. Support with short education program.
6
7
8.2 I T&T O
By: Anand Bobade (nmbobade@gmail.com)
8.2 Perform Quality Assurance->T&T->QM&CT Overview
Classifying large number of ideas into groups.
What might go wrong in a plan under development.
Different problems are related to each other. Used after Case-and-effect,
mind mapping, affinity diagram.
General plan is related to specific parts. Action plan.
Communication.
Prioritize tasks. Options based on weighted criteria.
How activates are connected. When to apply quality procedures.
Relationship between factors, causes, and objectives. Many to may
relations.
8.2 I T&T O
By: Anand Bobade (nmbobade@gmail.com)
Quality audits
Quality audits are independent reviews of the quality processes
& procedures.
Quality audits can done randomly or can be scheduled based.
Audits can be carried externally or internally.
Quality audits can confirm implementation of:
Approved
changes
Corrective
actions
Preventive
action
Defect repairs
8.2 Perform Quality Assurance-> T&T->Quality Audits
8.2 I T&T O
By: Anand Bobade (nmbobade@gmail.com)
Process
Analysis
Implement plan outlined in “Process Improvement Plan”
which was an output to Plan Quality Management process.
Use root-cause analysis to identify problems in processes
and take preventive actions.
8.2 Perform Quality Assurance->T&T->Process Analysis
8.2 I T&T O
By: Anand Bobade (nmbobade@gmail.com)
Change requests PMP updates
Project doc’s
updates OPA updates
8.2 Perform Quality Assurance -> Output
8.2 I T&T O
By: Anand Bobade (nmbobade@gmail.com)
8.2 Perform Quality Assurance -> Output
Change requests related to corrective, preventive, and
defect repair are made.
Quality Management Plan, Scope Management Plan,
Schedule Management Plan, and Cost Management
Plan are updated.
Audit Reports, Training Plans, and Process
Documentation are updated.
Organization quality standards and quality management
systems are updated
8.2 I T&T O
By: Anand Bobade (nmbobade@gmail.com)
8.2 Perform Quality Assurance -> Process Flow Chart
8.2 I T&T O
By: Anand Bobade (nmbobade@gmail.com)
Self Assessment
d. Where it is determined if standards are being met, work is
continuously improved & problem are identified & fixed.
Perform Quality Assurance process is:
a. Where the customer formally accepts the product.
b. Where the customer performs a test of the product of the
project to check for correctness of the work product.
c. Where any variances are recorded as changes and sent to
Change Control Board for review.
d. Where it is determined if standards are being met, work is
continuously improved & problem are identified & fixed.
8.2 I T&T O
By: Anand Bobade (nmbobade@gmail.com)
Self Assessment
c. Quality is driven by Prevention.
Which of the following is most TRUE regarding quality?
a. It is cheaper to build quality into a project.
b. Quality is driven by Inspection.
c. Quality is driven by Prevention.
d. Quality always costs more in the long run
8.2 I T&T O
By: Anand Bobade (nmbobade@gmail.com)
Self Assessment
Answer: c. Present the results of quality audit’s.
A customer is constantly concerned about the product quality &
thinking that quality process are not being followed as agreed in the
quality management plan. How project manager can verify this claim?
a. Invite customer to perform the quality inspections
b. Increasing the sample size
c. Review the results of quality audit’s.
Request customer to review quality management plan
8.2 I T&T O
By: Anand Bobade (nmbobade@gmail.com)
Learn Project Management & prepare for PMP exam:
• Learn visually
• Detailed coverage of all PMP concepts
• Sample Questions
8.2 I T&T O
By: Anand Bobade (nmbobade@gmail.com)By: Anand Bobade (nmbobade@gmail.com)
8.3 Control Quality
Control Quality definition
Control Quality - ITTO
Difference between Quality control & assurance
Difference between Quality control & verify scope
What is Inspection?
Review
Self Assessment
8.3 I T&T O
By: Anand Bobade (nmbobade@gmail.com)
8. Project Quality Management Knowledge Area
8.1 Plan Quality Management:
• It is the process of identifying quality requirements and/or
standards for the project and its deliverables
• Document how the project will demonstrate compliance with
relevant quality requirements.
8.2 Perform Quality Assurance:
• It is the process of auditing the quality requirements and the
results from quality control measurements to ensure that
appropriate quality standards and operational definitions are
used.
8.3: Control Quality:
• It is the process of monitoring and recording results of executing
the quality activities to assess performance and recommend
necessary changes.
8.3 I T&T O
By: Anand Bobade (nmbobade@gmail.com)
Monitoring & recording results of executing quality activities to
assess performance & recommend necessary changes.
- Identifying causes of poor process/product quality & recommend action
-Validating that project deliverables & work to meet the requirements.
8.3 Control Quality
Monitoring & Recording
Recommend
ation
Action
Action
Execution of quality
activities
Assess performance
Recommend necessary
changes
8.3 I T&T O
By: Anand Bobade (nmbobade@gmail.com)Copyrights @ Anand Bobade (nmbobade@gmail.com – 055-5932004)
Quality Control & Quality Assurance process
Direct and Manage
Project work Control Quality
Plan Quality
management
Perform Quality
Assurance
Deliverables
Quality
Checklist
Sampling Inspection
(System testing,
Load testing etc)
Quality Control
measurements
Quality
Audit
Process
Analysis
QMPQuality Matrix
Process
Improvement plan
No. of defects
Defect classification
Perform Integrated
change Control
WPD
PMP Project
Documents
Verified Del’s WPI Validated changes
Change
Request
PMP
updates
Approved CR
Approved CR
review
8.3 I T&T O
By: Anand Bobade (nmbobade@gmail.com)
8.3 Control Quality
Inputs (8)
• Project management
plan
• Quality metrics
• Quality checklists
• Work performance data
• Approved change
requests
• Deliverables
• Project documents
• Organizational process
assets
Tools & Techniques
(4)
• Seven basic quality
tools
• Statistical sampling
• Inspection
• Approved change
requests review
Outputs (8)
• Quality control
measurements
• Validated changes
• Verified deliverables
• Work performance
information
• Change requests
• PMP updates
• Project documents
updates
• OPA updates
8.3 I T&T O
By: Anand Bobade (nmbobade@gmail.com)
8.3 Control Quality -> Concepts
Prevention
• It is about keeping errors out of process
Inspection
• It is about keeping errors out of hands of the
customer
Attribute Sampling
• The result of an attribute either conforms or does
not conforms
8.3 I T&T O
By: Anand Bobade (nmbobade@gmail.com)
8.3 Control Quality -> Concepts
Tolerance:
• Tolerance is a specified range of acceptable results.
Variable Sampling:
• The result of variable is on continuous scale with a
degree of conformity.
Control Limits:
• Control Limits is about specifying boundaries for a
stable process.
8.3 I T&T O
By: Anand Bobade (nmbobade@gmail.com)
PMP Quality metrics Quality checklists
Work
Performance data
Approved change
requests Deliverables Project documents OPA
8.3 Control Quality -> Input
8.3 I T&T O
By: Anand Bobade (nmbobade@gmail.com)
8.3 Control Quality -> Input
8.1 Plan Quality
Management:
8.3: Control
Quality:
Part of
PMP
8.3 I T&T O
By: Anand Bobade (nmbobade@gmail.com)
Quality metrics
It describes how project or products attributes will be
measured.
8.3 Control Quality -> Input->Quality Metrics
Function Points (FP):
• In IT, FP are used to count number of function, an
information system providing to a business.
• Can be used for estimation.
Mean time between Failures (MTBF):
• It shows reliability of product.
• It specifies time between two failures.
• E.g., hard disk will have a failure after 300,000 hours.
Mean time to repair (MTTR):
• It is average amount of time a device/product will need
to be repaired.
8.3 I T&T O
By: Anand Bobade (nmbobade@gmail.com)
8.3 Control Quality -> Input
Quality Management Plan of the Project
Management Plan.
A list that will help us to verify, if produced
deliverables fulfils product/project requirements.
The data gathered from actual, which can include
planned Vs actual schedule performance, cost
performance and technical performance.
The changes requested may include defect
repairs which needs to quality controlled and
verified.
8.3 I T&T O
By: Anand Bobade (nmbobade@gmail.com)
8.3 Control Quality -> Input
Deliverables are validated in Control Quality
process.
Agreements, quality audit documents, training
plans and their assessment, process documentation
Organization’s quality policies, defect reporting
procedure, and communication policy
8.3 I T&T O
By: Anand Bobade (nmbobade@gmail.com)
Seven basic
quality tools
Statistical
sampling Inspection
Approved CR
review
8.3 Control Quality -> Tools & Techniques
8.3 I T&T O
By: Anand Bobade (nmbobade@gmail.com)
8.3 Control Quality -> Tools & Techniques
These were explained in Plan Quality Management -> Tools &
Techniques
As defined in the Quality Management Plan, samples are selected
and tested (Already explained)
Inspection refers to the examination of the product in order to
determine whether it according to the documented standards
(review, peer reviews, audits, or walkthroughs). Inspections are
also used to validate defect repairs.
All the approved change requests are reviewed to verify they are
implemented as approved.
8.3 I T&T O
By: Anand Bobade (nmbobade@gmail.com)
Quality control
measurements
Validated changes
Verified
deliverables
Work
performance
information
Change requests
PMP updates Project documents
updates
OPA updates
8.3 Control Quality -> Output
8.3 I T&T O
By: Anand Bobade (nmbobade@gmail.com)
8.3 Control Quality -> Output
8.2 Perform
Quality Assurance:
8.3: Control
Quality:
Quality control
measurements
8.3 I T&T O
By: Anand Bobade (nmbobade@gmail.com)
8.3 Control Quality->Output->Verified Deliverables
Goals of Control Quality is to verify the correctness of deliverables.
Thus deliverables are either verified or rejected.
The verified deliverables becomes input to Validate Scope process
where they are formally accepted or rejected.
Verified
deliverables
Direct & Manage
Project Work ->
Deliverables
Control Quality
(Quality tools &
Inspection)
Verified Deliverables
(Output)
Scope Management
(Validate Scope)
8.3 I T&T O
By: Anand Bobade (nmbobade@gmail.com)
8.3 Control Quality -> Output->Validated changes
Validated
changes
Changed or repaired product, based on approved CR, are validated in
Control Quality process.
This is done using Review Approved Change Requests technique.
The change or repaired done is either validated or rejected.
This information is further used in Monitor & control project work.
Integrated Change
Control -> Approved
Change Request
Quality Control ->
Approved CR review
tool
Validated changes Monitor & Control
project work
8.3 I T&T O
By: Anand Bobade (nmbobade@gmail.com)
Quality control
measurements
Control Quality Measurements are the results of Control Quality
process.
These are input to Perform Quality Assurance process
Examples:
No. of test cases executed
No. of test cases passed
No. of text failed
No. of open defects
No. of closed defects
8.3 Control Quality->Output->Quality Control measure
Inspection
-> Software testing (SIT)
-> Construction quality test
8.3 I T&T O
By: Anand Bobade (nmbobade@gmail.com)
Work
performance
information
WPI is performance related data that is output to many
monitoring and controlling processes
This is used in Monitor & control project work for
further analysis.
WPI will show:
Projects achievement against requirements.
Information about rejections.
Reasons for the rejections.
Rework required.
Need for change in quality processes.
8.3 Control Quality->Output->WPI
8.3 I T&T O
By: Anand Bobade (nmbobade@gmail.com)
8.3 Control Quality -> Output
Change requests in the form of rework, repair, change
to management plan etc are made.
Quality Management Plan, and
Process Improvement Plans might be updated
Agreements, quality audit documents, training plans
and their assessment, process documentation
Completed Checklists: Documented checklist becomes
part of project document Lesson Learned Doc: Causes
of variances, Reasoning behind corrective action
8.3 I T&T O
By: Anand Bobade (nmbobade@gmail.com)
Quality Control Vs Verify Scope
Control Quality (monitoring & controlling)
• Performed internally during project execution
• Ensure that product is defect free & all parameters are
within acceptable limits set in the quality control plan.
• Performed by quality control engineer with project
team.
Validate Scope (monitoring & controlling)
• Performed with the client at the end of the project
• Verify if product is complete, all requirements are met,
& product is ready for client acceptance.
• Objective is to get a formal acceptance from client.
• Can be performed far before project ends; can be
done with perform quality control process.
8.3 I T&T O
By: Anand Bobade (nmbobade@gmail.com)
Quality Assurance Vs Quality Control
Quality Assurance:
• Process of auditing quality requirements & results
from quality control measurements to ensure that
appropriate quality standards & operational
definitions are used.
Quality Control:
• Process of monitoring & recording results of
executing quality activities to assess performance &
recommend necessary changes.
8.3 I T&T O
By: Anand Bobade (nmbobade@gmail.com)
8.3 Control Quality -> Data Flow Diagram
8.3 I T&T O
By: Anand Bobade (nmbobade@gmail.com)
Self Assessment
C. The defined requirements of the customers are fulfilled.
Quality is achieved when ___
a. We exceed customer’s every expectation.
b. We exceed customer’s expectation is some way or other.
c. The defined requirements of the customers are fulfilled.
d. The number of benefits far outweighs the number of defects.
8.3 I T&T O
By: Anand Bobade (nmbobade@gmail.com)
Self Assessment
d. The Senior Management
In the end, Quality is the responsibility of
a. The Customer
b. The Project Manager
c. The Team Members
d. The Senior Management
8.3 I T&T O
By: Anand Bobade (nmbobade@gmail.com)
Review!!
8.1 Plan Quality
Management:
8.2 Perform Quality
Assurance:
8.3: Control
Quality:
Cost-benefit
analysis
Cost of quality
Seven basic
quality tools
Benchmarking
Design of
experiments
Statistical
sampling
Additional
quality
planning tools
Meetings
Cause-and-
Effect
Flowcharts Check-sheet Pareto
Diagram
Histograms Control Charts Scatter
Diagram
Quality
control
measureme
nts
Validated
changes
Verified
deliverables
Work
performanc
e
information
Quality
Management Plan
Process
Improvement
Plan
Quality
Metrics
8.3 I T&T O
By: Anand Bobade (nmbobade@gmail.com)
Learn Project Management & prepare for PMP exam:
• Learn visually
• Detailed coverage of all PMP concepts
• Sample Questions
By: Anand Bobade (nmbobade@gmail.com)
Thank You!
To Learn Project Management, Contact Anand Bobade (055 5932004)
•nmbobade@gmail.com
•https://ae.linkedin.com/in/anandbobade
•http://www.slideshare.net/anandbobade
•Conduct Online training, Corporate Training, evening & weekend workshops.
Free learning resources
on slide share

Contenu connexe

Tendances

Pmp chap 11 - project risk management - Part 2
Pmp   chap 11 - project risk management - Part 2Pmp   chap 11 - project risk management - Part 2
Pmp chap 11 - project risk management - Part 2Anand Bobade
 
Project quality management - PMI PMBOK Knowledge Area
Project quality management - PMI PMBOK Knowledge AreaProject quality management - PMI PMBOK Knowledge Area
Project quality management - PMI PMBOK Knowledge AreaImran Jamil
 
PMP Chap 6 - Project Time management - Part1
PMP Chap 6 - Project Time management - Part1PMP Chap 6 - Project Time management - Part1
PMP Chap 6 - Project Time management - Part1Anand Bobade
 
PMP Chap 7 - Project Cost Management - Part 1
PMP Chap 7 - Project Cost Management - Part 1PMP Chap 7 - Project Cost Management - Part 1
PMP Chap 7 - Project Cost Management - Part 1Anand Bobade
 
PMP Chap 10 - Project Communication Management Details
PMP  Chap 10 - Project Communication Management DetailsPMP  Chap 10 - Project Communication Management Details
PMP Chap 10 - Project Communication Management DetailsAnand Bobade
 
PMP Chap 5 - Project Scope Management - Part1
PMP Chap 5 - Project Scope Management - Part1PMP Chap 5 - Project Scope Management - Part1
PMP Chap 5 - Project Scope Management - Part1Anand Bobade
 
PMP Training - 08 project quality management
PMP Training - 08 project quality managementPMP Training - 08 project quality management
PMP Training - 08 project quality managementejlp12
 
Chap 8.1 Plan quality management
Chap 8.1 Plan quality managementChap 8.1 Plan quality management
Chap 8.1 Plan quality managementAnand Bobade
 
Project Scope Management - PMBOK6
Project Scope Management - PMBOK6Project Scope Management - PMBOK6
Project Scope Management - PMBOK6Agus Suhanto
 
Introduction to Project Management
Introduction to Project ManagementIntroduction to Project Management
Introduction to Project ManagementKris Kimmerle
 
Chap 11.2 Identify Risks
Chap 11.2 Identify RisksChap 11.2 Identify Risks
Chap 11.2 Identify RisksAnand Bobade
 
Chap 5.4 Create WBS
Chap 5.4 Create WBSChap 5.4 Create WBS
Chap 5.4 Create WBSAnand Bobade
 
Project Quality Management - PMBOK6
Project Quality Management - PMBOK6Project Quality Management - PMBOK6
Project Quality Management - PMBOK6Agus Suhanto
 
PMP Chap 3 - Project Management Processes
PMP Chap 3 - Project Management ProcessesPMP Chap 3 - Project Management Processes
PMP Chap 3 - Project Management ProcessesAnand Bobade
 
Chap 8.3 Control Quality
Chap 8.3  Control QualityChap 8.3  Control Quality
Chap 8.3 Control QualityAnand Bobade
 
Chap 6.3 Sequence Activity
Chap 6.3 Sequence ActivityChap 6.3 Sequence Activity
Chap 6.3 Sequence ActivityAnand Bobade
 

Tendances (20)

Pmp chap 11 - project risk management - Part 2
Pmp   chap 11 - project risk management - Part 2Pmp   chap 11 - project risk management - Part 2
Pmp chap 11 - project risk management - Part 2
 
Project quality management - PMI PMBOK Knowledge Area
Project quality management - PMI PMBOK Knowledge AreaProject quality management - PMI PMBOK Knowledge Area
Project quality management - PMI PMBOK Knowledge Area
 
Project management
Project managementProject management
Project management
 
PMP Chap 6 - Project Time management - Part1
PMP Chap 6 - Project Time management - Part1PMP Chap 6 - Project Time management - Part1
PMP Chap 6 - Project Time management - Part1
 
PMP Chap 7 - Project Cost Management - Part 1
PMP Chap 7 - Project Cost Management - Part 1PMP Chap 7 - Project Cost Management - Part 1
PMP Chap 7 - Project Cost Management - Part 1
 
PMP Chap 10 - Project Communication Management Details
PMP  Chap 10 - Project Communication Management DetailsPMP  Chap 10 - Project Communication Management Details
PMP Chap 10 - Project Communication Management Details
 
PMP Chap 5 - Project Scope Management - Part1
PMP Chap 5 - Project Scope Management - Part1PMP Chap 5 - Project Scope Management - Part1
PMP Chap 5 - Project Scope Management - Part1
 
PMP Training - 08 project quality management
PMP Training - 08 project quality managementPMP Training - 08 project quality management
PMP Training - 08 project quality management
 
Chap 8.1 Plan quality management
Chap 8.1 Plan quality managementChap 8.1 Plan quality management
Chap 8.1 Plan quality management
 
Project scope management 1
Project scope management 1Project scope management 1
Project scope management 1
 
Project Scope Management - PMBOK6
Project Scope Management - PMBOK6Project Scope Management - PMBOK6
Project Scope Management - PMBOK6
 
Introduction to Project Management
Introduction to Project ManagementIntroduction to Project Management
Introduction to Project Management
 
Chap 11.2 Identify Risks
Chap 11.2 Identify RisksChap 11.2 Identify Risks
Chap 11.2 Identify Risks
 
Chap 5.4 Create WBS
Chap 5.4 Create WBSChap 5.4 Create WBS
Chap 5.4 Create WBS
 
Project Quality Management - PMBOK6
Project Quality Management - PMBOK6Project Quality Management - PMBOK6
Project Quality Management - PMBOK6
 
Project Management
Project ManagementProject Management
Project Management
 
PMP Chap 3 - Project Management Processes
PMP Chap 3 - Project Management ProcessesPMP Chap 3 - Project Management Processes
PMP Chap 3 - Project Management Processes
 
Chap 8.3 Control Quality
Chap 8.3  Control QualityChap 8.3  Control Quality
Chap 8.3 Control Quality
 
Project Management Tools and Techniques
Project Management Tools and TechniquesProject Management Tools and Techniques
Project Management Tools and Techniques
 
Chap 6.3 Sequence Activity
Chap 6.3 Sequence ActivityChap 6.3 Sequence Activity
Chap 6.3 Sequence Activity
 

En vedette

Project Quality Control
Project Quality ControlProject Quality Control
Project Quality ControlSheetal Narkar
 
PMBOK® Guide Processes Flow – 6th Edition
PMBOK® Guide Processes Flow – 6th EditionPMBOK® Guide Processes Flow – 6th Edition
PMBOK® Guide Processes Flow – 6th EditionRicardo Viana Vargas
 
Project Management:Life Cycle & Phases.
Project Management:Life Cycle & Phases.Project Management:Life Cycle & Phases.
Project Management:Life Cycle & Phases.Ashutosh Mishra
 
Project Risk Management
Project Risk ManagementProject Risk Management
Project Risk ManagementMarkos Mulat G
 
Project life cycle
Project life cycleProject life cycle
Project life cycleMaryam Juma
 
Quality Control
Quality ControlQuality Control
Quality Controlvishakeb
 
ISO 9000
ISO 9000ISO 9000
ISO 900017somya
 
Quality Management In Construction
Quality Management In ConstructionQuality Management In Construction
Quality Management In ConstructionIsidro Sid Calayag
 
Project Quality Management - PMBOK 5th Edition
Project Quality Management - PMBOK 5th EditionProject Quality Management - PMBOK 5th Edition
Project Quality Management - PMBOK 5th Editionpankajsh10
 
Quality control and quality assurance
Quality control and quality assuranceQuality control and quality assurance
Quality control and quality assuranceLeola Ramirez
 
Sharath Technical Lead Resume
Sharath Technical Lead ResumeSharath Technical Lead Resume
Sharath Technical Lead ResumeSharath Babu
 

En vedette (20)

Project quality management.ppt msm
Project quality management.ppt msmProject quality management.ppt msm
Project quality management.ppt msm
 
10 paydaş yonetimi
10   paydaş yonetimi10   paydaş yonetimi
10 paydaş yonetimi
 
PMP Preparation - 06 Time Management
PMP Preparation - 06 Time ManagementPMP Preparation - 06 Time Management
PMP Preparation - 06 Time Management
 
PMP Preparation - 08 Quality Management
PMP Preparation - 08 Quality ManagementPMP Preparation - 08 Quality Management
PMP Preparation - 08 Quality Management
 
3 Questions PM needs to ask for Stakeholder Management
3 Questions PM needs to ask for Stakeholder Management3 Questions PM needs to ask for Stakeholder Management
3 Questions PM needs to ask for Stakeholder Management
 
2 kapsam yonetimi
2   kapsam yonetimi2   kapsam yonetimi
2 kapsam yonetimi
 
Project Quality Control
Project Quality ControlProject Quality Control
Project Quality Control
 
PMBOK® Guide Processes Flow – 6th Edition
PMBOK® Guide Processes Flow – 6th EditionPMBOK® Guide Processes Flow – 6th Edition
PMBOK® Guide Processes Flow – 6th Edition
 
Risk Analysis
Risk AnalysisRisk Analysis
Risk Analysis
 
Project Management:Life Cycle & Phases.
Project Management:Life Cycle & Phases.Project Management:Life Cycle & Phases.
Project Management:Life Cycle & Phases.
 
Project Risk Management
Project Risk ManagementProject Risk Management
Project Risk Management
 
Project life cycle
Project life cycleProject life cycle
Project life cycle
 
Quality Control
Quality ControlQuality Control
Quality Control
 
ISO 9000
ISO 9000ISO 9000
ISO 9000
 
Quality control
Quality controlQuality control
Quality control
 
Quality Management In Construction
Quality Management In ConstructionQuality Management In Construction
Quality Management In Construction
 
Project Quality Management - PMBOK 5th Edition
Project Quality Management - PMBOK 5th EditionProject Quality Management - PMBOK 5th Edition
Project Quality Management - PMBOK 5th Edition
 
Quality control and quality assurance
Quality control and quality assuranceQuality control and quality assurance
Quality control and quality assurance
 
QUALITY ASSURANCE
QUALITY ASSURANCEQUALITY ASSURANCE
QUALITY ASSURANCE
 
Sharath Technical Lead Resume
Sharath Technical Lead ResumeSharath Technical Lead Resume
Sharath Technical Lead Resume
 

Similaire à PMP Chap 8 - Project Quality Management

Chap 8.0 Quality Management Overview
Chap 8.0 Quality Management OverviewChap 8.0 Quality Management Overview
Chap 8.0 Quality Management OverviewAnand Bobade
 
PMP Key-exam-concepts-QA-QC-VS-VS
PMP Key-exam-concepts-QA-QC-VS-VSPMP Key-exam-concepts-QA-QC-VS-VS
PMP Key-exam-concepts-QA-QC-VS-VSAnand Bobade
 
Chap 8.2 Manage Quality
Chap 8.2 Manage QualityChap 8.2 Manage Quality
Chap 8.2 Manage QualityAnand Bobade
 
Quality Management-KA.pptx
Quality Management-KA.pptxQuality Management-KA.pptx
Quality Management-KA.pptxssuser2ec65a
 
Managing quality ppt @ bec doms
Managing quality ppt @ bec domsManaging quality ppt @ bec doms
Managing quality ppt @ bec domsBabasab Patil
 
Improving Quality - Guy Gershoni
Improving Quality - Guy GershoniImproving Quality - Guy Gershoni
Improving Quality - Guy GershoniGuy Gershoni
 
The Quality Standard: ISO 9000 , CMM and Six Sigma
The Quality Standard: ISO 9000 , CMM and Six SigmaThe Quality Standard: ISO 9000 , CMM and Six Sigma
The Quality Standard: ISO 9000 , CMM and Six SigmaDeep Dalsania
 
Ch17SoftwareQuality.ppt
Ch17SoftwareQuality.pptCh17SoftwareQuality.ppt
Ch17SoftwareQuality.pptSanaLatif13
 
Chap 5.3 define scope
Chap 5.3 define scopeChap 5.3 define scope
Chap 5.3 define scopeAnand Bobade
 
I Miller oct 2016 cv doc
I Miller oct 2016 cv docI Miller oct 2016 cv doc
I Miller oct 2016 cv docIan Miller
 
Murali_Resume_updated[1]
Murali_Resume_updated[1]Murali_Resume_updated[1]
Murali_Resume_updated[1]Murali A
 

Similaire à PMP Chap 8 - Project Quality Management (20)

Chap 8.0 Quality Management Overview
Chap 8.0 Quality Management OverviewChap 8.0 Quality Management Overview
Chap 8.0 Quality Management Overview
 
PMP Key-exam-concepts-QA-QC-VS-VS
PMP Key-exam-concepts-QA-QC-VS-VSPMP Key-exam-concepts-QA-QC-VS-VS
PMP Key-exam-concepts-QA-QC-VS-VS
 
Chap 8.2 Manage Quality
Chap 8.2 Manage QualityChap 8.2 Manage Quality
Chap 8.2 Manage Quality
 
Slides8-13.pdf
Slides8-13.pdfSlides8-13.pdf
Slides8-13.pdf
 
cost of quality
cost of qualitycost of quality
cost of quality
 
Quality Management-KA.pptx
Quality Management-KA.pptxQuality Management-KA.pptx
Quality Management-KA.pptx
 
Managing quality ppt @ bec doms
Managing quality ppt @ bec domsManaging quality ppt @ bec doms
Managing quality ppt @ bec doms
 
QC CIRCLE - 2023.pptx
QC CIRCLE - 2023.pptxQC CIRCLE - 2023.pptx
QC CIRCLE - 2023.pptx
 
GS CV
GS CVGS CV
GS CV
 
Improving Quality - Guy Gershoni
Improving Quality - Guy GershoniImproving Quality - Guy Gershoni
Improving Quality - Guy Gershoni
 
The Quality Standard: ISO 9000 , CMM and Six Sigma
The Quality Standard: ISO 9000 , CMM and Six SigmaThe Quality Standard: ISO 9000 , CMM and Six Sigma
The Quality Standard: ISO 9000 , CMM and Six Sigma
 
Ch17SoftwareQuality.ppt
Ch17SoftwareQuality.pptCh17SoftwareQuality.ppt
Ch17SoftwareQuality.ppt
 
SoftwareQuality.ppt
SoftwareQuality.pptSoftwareQuality.ppt
SoftwareQuality.ppt
 
CV JAVED
CV JAVEDCV JAVED
CV JAVED
 
ramanji.resume
ramanji.resumeramanji.resume
ramanji.resume
 
Mallappa Beleri Resume
Mallappa Beleri ResumeMallappa Beleri Resume
Mallappa Beleri Resume
 
Resume_shubhranshu shekhar
Resume_shubhranshu  shekharResume_shubhranshu  shekhar
Resume_shubhranshu shekhar
 
Chap 5.3 define scope
Chap 5.3 define scopeChap 5.3 define scope
Chap 5.3 define scope
 
I Miller oct 2016 cv doc
I Miller oct 2016 cv docI Miller oct 2016 cv doc
I Miller oct 2016 cv doc
 
Murali_Resume_updated[1]
Murali_Resume_updated[1]Murali_Resume_updated[1]
Murali_Resume_updated[1]
 

Plus de Anand Bobade

PMP - Download 49 Processes Chart | PMBOK6 | Links to all Slides | Link to Yo...
PMP - Download 49 Processes Chart | PMBOK6 | Links to all Slides | Link to Yo...PMP - Download 49 Processes Chart | PMBOK6 | Links to all Slides | Link to Yo...
PMP - Download 49 Processes Chart | PMBOK6 | Links to all Slides | Link to Yo...Anand Bobade
 
Chap 12.3 Control Procurement
Chap 12.3 Control ProcurementChap 12.3 Control Procurement
Chap 12.3 Control ProcurementAnand Bobade
 
Chap 12.2 Conduct Procurement
Chap 12.2 Conduct ProcurementChap 12.2 Conduct Procurement
Chap 12.2 Conduct ProcurementAnand Bobade
 
Chap 12.1 Plan Procurement Management
Chap 12.1 Plan Procurement ManagementChap 12.1 Plan Procurement Management
Chap 12.1 Plan Procurement ManagementAnand Bobade
 
Chap 12.0 Procurement Management overview
Chap 12.0   Procurement Management overviewChap 12.0   Procurement Management overview
Chap 12.0 Procurement Management overviewAnand Bobade
 
Chap 11.7 Monitor Risks
Chap 11.7 Monitor RisksChap 11.7 Monitor Risks
Chap 11.7 Monitor RisksAnand Bobade
 
Chap 10.3 Monitor Communication
Chap 10.3 Monitor CommunicationChap 10.3 Monitor Communication
Chap 10.3 Monitor CommunicationAnand Bobade
 
Chap 10.2 Manage Communication
Chap 10.2  Manage CommunicationChap 10.2  Manage Communication
Chap 10.2 Manage CommunicationAnand Bobade
 
Chap 10.1 Plan Communication Management
Chap 10.1  Plan Communication ManagementChap 10.1  Plan Communication Management
Chap 10.1 Plan Communication ManagementAnand Bobade
 
Chap 9.6 Control Resources
Chap 9.6  Control ResourcesChap 9.6  Control Resources
Chap 9.6 Control ResourcesAnand Bobade
 
Chap 9.5 Manage Team
Chap 9.5  Manage TeamChap 9.5  Manage Team
Chap 9.5 Manage TeamAnand Bobade
 
Chap 9.4 Develop Team
Chap 9.4  Develop TeamChap 9.4  Develop Team
Chap 9.4 Develop TeamAnand Bobade
 
Chap 9.3 Acquire Resources
Chap 9.3   Acquire ResourcesChap 9.3   Acquire Resources
Chap 9.3 Acquire ResourcesAnand Bobade
 
Chap 9.2 Estimate Activity Resource
Chap 9.2   Estimate Activity ResourceChap 9.2   Estimate Activity Resource
Chap 9.2 Estimate Activity ResourceAnand Bobade
 
Chap 9.1 Pan Resource Management
Chap 9.1   Pan Resource ManagementChap 9.1   Pan Resource Management
Chap 9.1 Pan Resource ManagementAnand Bobade
 
Chap 7.2 Estimate Cost
Chap 7.2 Estimate CostChap 7.2 Estimate Cost
Chap 7.2 Estimate CostAnand Bobade
 
Chap 7.3 Determine budget
Chap 7.3   Determine budgetChap 7.3   Determine budget
Chap 7.3 Determine budgetAnand Bobade
 
Chap 7.1 Plan Cost Management
Chap 7.1  Plan Cost ManagementChap 7.1  Plan Cost Management
Chap 7.1 Plan Cost ManagementAnand Bobade
 
Chap 6.6 Control Schedule
Chap 6.6 Control ScheduleChap 6.6 Control Schedule
Chap 6.6 Control ScheduleAnand Bobade
 
Chap 6.5 Define Schedule
Chap 6.5 Define ScheduleChap 6.5 Define Schedule
Chap 6.5 Define ScheduleAnand Bobade
 

Plus de Anand Bobade (20)

PMP - Download 49 Processes Chart | PMBOK6 | Links to all Slides | Link to Yo...
PMP - Download 49 Processes Chart | PMBOK6 | Links to all Slides | Link to Yo...PMP - Download 49 Processes Chart | PMBOK6 | Links to all Slides | Link to Yo...
PMP - Download 49 Processes Chart | PMBOK6 | Links to all Slides | Link to Yo...
 
Chap 12.3 Control Procurement
Chap 12.3 Control ProcurementChap 12.3 Control Procurement
Chap 12.3 Control Procurement
 
Chap 12.2 Conduct Procurement
Chap 12.2 Conduct ProcurementChap 12.2 Conduct Procurement
Chap 12.2 Conduct Procurement
 
Chap 12.1 Plan Procurement Management
Chap 12.1 Plan Procurement ManagementChap 12.1 Plan Procurement Management
Chap 12.1 Plan Procurement Management
 
Chap 12.0 Procurement Management overview
Chap 12.0   Procurement Management overviewChap 12.0   Procurement Management overview
Chap 12.0 Procurement Management overview
 
Chap 11.7 Monitor Risks
Chap 11.7 Monitor RisksChap 11.7 Monitor Risks
Chap 11.7 Monitor Risks
 
Chap 10.3 Monitor Communication
Chap 10.3 Monitor CommunicationChap 10.3 Monitor Communication
Chap 10.3 Monitor Communication
 
Chap 10.2 Manage Communication
Chap 10.2  Manage CommunicationChap 10.2  Manage Communication
Chap 10.2 Manage Communication
 
Chap 10.1 Plan Communication Management
Chap 10.1  Plan Communication ManagementChap 10.1  Plan Communication Management
Chap 10.1 Plan Communication Management
 
Chap 9.6 Control Resources
Chap 9.6  Control ResourcesChap 9.6  Control Resources
Chap 9.6 Control Resources
 
Chap 9.5 Manage Team
Chap 9.5  Manage TeamChap 9.5  Manage Team
Chap 9.5 Manage Team
 
Chap 9.4 Develop Team
Chap 9.4  Develop TeamChap 9.4  Develop Team
Chap 9.4 Develop Team
 
Chap 9.3 Acquire Resources
Chap 9.3   Acquire ResourcesChap 9.3   Acquire Resources
Chap 9.3 Acquire Resources
 
Chap 9.2 Estimate Activity Resource
Chap 9.2   Estimate Activity ResourceChap 9.2   Estimate Activity Resource
Chap 9.2 Estimate Activity Resource
 
Chap 9.1 Pan Resource Management
Chap 9.1   Pan Resource ManagementChap 9.1   Pan Resource Management
Chap 9.1 Pan Resource Management
 
Chap 7.2 Estimate Cost
Chap 7.2 Estimate CostChap 7.2 Estimate Cost
Chap 7.2 Estimate Cost
 
Chap 7.3 Determine budget
Chap 7.3   Determine budgetChap 7.3   Determine budget
Chap 7.3 Determine budget
 
Chap 7.1 Plan Cost Management
Chap 7.1  Plan Cost ManagementChap 7.1  Plan Cost Management
Chap 7.1 Plan Cost Management
 
Chap 6.6 Control Schedule
Chap 6.6 Control ScheduleChap 6.6 Control Schedule
Chap 6.6 Control Schedule
 
Chap 6.5 Define Schedule
Chap 6.5 Define ScheduleChap 6.5 Define Schedule
Chap 6.5 Define Schedule
 

Dernier

Call Now Pooja Mehta : 7738631006 Door Step Call Girls Rate 100% Satisfactio...
Call Now Pooja Mehta :  7738631006 Door Step Call Girls Rate 100% Satisfactio...Call Now Pooja Mehta :  7738631006 Door Step Call Girls Rate 100% Satisfactio...
Call Now Pooja Mehta : 7738631006 Door Step Call Girls Rate 100% Satisfactio...Pooja Nehwal
 
Agile Coaching Change Management Framework.pptx
Agile Coaching Change Management Framework.pptxAgile Coaching Change Management Framework.pptx
Agile Coaching Change Management Framework.pptxalinstan901
 
Day 0- Bootcamp Roadmap for PLC Bootcamp
Day 0- Bootcamp Roadmap for PLC BootcampDay 0- Bootcamp Roadmap for PLC Bootcamp
Day 0- Bootcamp Roadmap for PLC BootcampPLCLeadershipDevelop
 
Continuous Improvement Infographics for Learning
Continuous Improvement Infographics for LearningContinuous Improvement Infographics for Learning
Continuous Improvement Infographics for LearningCIToolkit
 
{ 9892124323 }} Call Girls & Escorts in Hotel JW Marriott juhu, Mumbai
{ 9892124323 }} Call Girls & Escorts in Hotel JW Marriott juhu, Mumbai{ 9892124323 }} Call Girls & Escorts in Hotel JW Marriott juhu, Mumbai
{ 9892124323 }} Call Girls & Escorts in Hotel JW Marriott juhu, MumbaiPooja Nehwal
 
Reviewing and summarization of university ranking system to.pptx
Reviewing and summarization of university ranking system  to.pptxReviewing and summarization of university ranking system  to.pptx
Reviewing and summarization of university ranking system to.pptxAss.Prof. Dr. Mogeeb Mosleh
 
Construction Project Management | Coursera 2024
Construction Project Management | Coursera 2024Construction Project Management | Coursera 2024
Construction Project Management | Coursera 2024Alex Marques
 
BDSM⚡Call Girls in Sector 99 Noida Escorts >༒8448380779 Escort Service
BDSM⚡Call Girls in Sector 99 Noida Escorts >༒8448380779 Escort ServiceBDSM⚡Call Girls in Sector 99 Noida Escorts >༒8448380779 Escort Service
BDSM⚡Call Girls in Sector 99 Noida Escorts >༒8448380779 Escort ServiceDelhi Call girls
 
CALL ON ➥8923113531 🔝Call Girls Charbagh Lucknow best sexual service
CALL ON ➥8923113531 🔝Call Girls Charbagh Lucknow best sexual serviceCALL ON ➥8923113531 🔝Call Girls Charbagh Lucknow best sexual service
CALL ON ➥8923113531 🔝Call Girls Charbagh Lucknow best sexual serviceanilsa9823
 
VIP 7001035870 Find & Meet Hyderabad Call Girls Ameerpet high-profile Call Girl
VIP 7001035870 Find & Meet Hyderabad Call Girls Ameerpet high-profile Call GirlVIP 7001035870 Find & Meet Hyderabad Call Girls Ameerpet high-profile Call Girl
VIP 7001035870 Find & Meet Hyderabad Call Girls Ameerpet high-profile Call Girladitipandeya
 
internal analysis on strategic management
internal analysis on strategic managementinternal analysis on strategic management
internal analysis on strategic managementharfimakarim
 

Dernier (20)

Disrupt or be Disrupted - Kirk Vallis.pdf
Disrupt or be Disrupted - Kirk Vallis.pdfDisrupt or be Disrupted - Kirk Vallis.pdf
Disrupt or be Disrupted - Kirk Vallis.pdf
 
Call Now Pooja Mehta : 7738631006 Door Step Call Girls Rate 100% Satisfactio...
Call Now Pooja Mehta :  7738631006 Door Step Call Girls Rate 100% Satisfactio...Call Now Pooja Mehta :  7738631006 Door Step Call Girls Rate 100% Satisfactio...
Call Now Pooja Mehta : 7738631006 Door Step Call Girls Rate 100% Satisfactio...
 
Agile Coaching Change Management Framework.pptx
Agile Coaching Change Management Framework.pptxAgile Coaching Change Management Framework.pptx
Agile Coaching Change Management Framework.pptx
 
Call Girls Service Tilak Nagar @9999965857 Delhi 🫦 No Advance VVIP 🍎 SERVICE
Call Girls Service Tilak Nagar @9999965857 Delhi 🫦 No Advance  VVIP 🍎 SERVICECall Girls Service Tilak Nagar @9999965857 Delhi 🫦 No Advance  VVIP 🍎 SERVICE
Call Girls Service Tilak Nagar @9999965857 Delhi 🫦 No Advance VVIP 🍎 SERVICE
 
Rohini Sector 16 Call Girls Delhi 9999965857 @Sabina Saikh No Advance
Rohini Sector 16 Call Girls Delhi 9999965857 @Sabina Saikh No AdvanceRohini Sector 16 Call Girls Delhi 9999965857 @Sabina Saikh No Advance
Rohini Sector 16 Call Girls Delhi 9999965857 @Sabina Saikh No Advance
 
Imagine - HR; are handling the 'bad banter' - Stella Chandler.pdf
Imagine - HR; are handling the 'bad banter' - Stella Chandler.pdfImagine - HR; are handling the 'bad banter' - Stella Chandler.pdf
Imagine - HR; are handling the 'bad banter' - Stella Chandler.pdf
 
Day 0- Bootcamp Roadmap for PLC Bootcamp
Day 0- Bootcamp Roadmap for PLC BootcampDay 0- Bootcamp Roadmap for PLC Bootcamp
Day 0- Bootcamp Roadmap for PLC Bootcamp
 
Continuous Improvement Infographics for Learning
Continuous Improvement Infographics for LearningContinuous Improvement Infographics for Learning
Continuous Improvement Infographics for Learning
 
LoveLocalGov - Chris Twigg, Inner Circle
LoveLocalGov - Chris Twigg, Inner CircleLoveLocalGov - Chris Twigg, Inner Circle
LoveLocalGov - Chris Twigg, Inner Circle
 
{ 9892124323 }} Call Girls & Escorts in Hotel JW Marriott juhu, Mumbai
{ 9892124323 }} Call Girls & Escorts in Hotel JW Marriott juhu, Mumbai{ 9892124323 }} Call Girls & Escorts in Hotel JW Marriott juhu, Mumbai
{ 9892124323 }} Call Girls & Escorts in Hotel JW Marriott juhu, Mumbai
 
Reviewing and summarization of university ranking system to.pptx
Reviewing and summarization of university ranking system  to.pptxReviewing and summarization of university ranking system  to.pptx
Reviewing and summarization of university ranking system to.pptx
 
Construction Project Management | Coursera 2024
Construction Project Management | Coursera 2024Construction Project Management | Coursera 2024
Construction Project Management | Coursera 2024
 
BDSM⚡Call Girls in Sector 99 Noida Escorts >༒8448380779 Escort Service
BDSM⚡Call Girls in Sector 99 Noida Escorts >༒8448380779 Escort ServiceBDSM⚡Call Girls in Sector 99 Noida Escorts >༒8448380779 Escort Service
BDSM⚡Call Girls in Sector 99 Noida Escorts >༒8448380779 Escort Service
 
CALL ON ➥8923113531 🔝Call Girls Charbagh Lucknow best sexual service
CALL ON ➥8923113531 🔝Call Girls Charbagh Lucknow best sexual serviceCALL ON ➥8923113531 🔝Call Girls Charbagh Lucknow best sexual service
CALL ON ➥8923113531 🔝Call Girls Charbagh Lucknow best sexual service
 
VIP 7001035870 Find & Meet Hyderabad Call Girls Ameerpet high-profile Call Girl
VIP 7001035870 Find & Meet Hyderabad Call Girls Ameerpet high-profile Call GirlVIP 7001035870 Find & Meet Hyderabad Call Girls Ameerpet high-profile Call Girl
VIP 7001035870 Find & Meet Hyderabad Call Girls Ameerpet high-profile Call Girl
 
Peak Performance & Resilience - Dr Dorian Dugmore
Peak Performance & Resilience - Dr Dorian DugmorePeak Performance & Resilience - Dr Dorian Dugmore
Peak Performance & Resilience - Dr Dorian Dugmore
 
Discover -CQ Master Class - Rikita Wadhwa.pdf
Discover -CQ Master Class - Rikita Wadhwa.pdfDiscover -CQ Master Class - Rikita Wadhwa.pdf
Discover -CQ Master Class - Rikita Wadhwa.pdf
 
Leadership in Crisis - Helio Vogas, Risk & Leadership Keynote Speaker
Leadership in Crisis - Helio Vogas, Risk & Leadership Keynote SpeakerLeadership in Crisis - Helio Vogas, Risk & Leadership Keynote Speaker
Leadership in Crisis - Helio Vogas, Risk & Leadership Keynote Speaker
 
Imagine - Creating Healthy Workplaces - Anthony Montgomery.pdf
Imagine - Creating Healthy Workplaces - Anthony Montgomery.pdfImagine - Creating Healthy Workplaces - Anthony Montgomery.pdf
Imagine - Creating Healthy Workplaces - Anthony Montgomery.pdf
 
internal analysis on strategic management
internal analysis on strategic managementinternal analysis on strategic management
internal analysis on strategic management
 

PMP Chap 8 - Project Quality Management

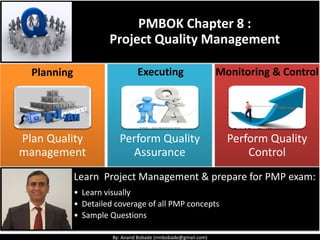
  • 1. By: Anand Bobade (nmbobade@gmail.com) Learn Project Management & prepare for PMP exam: • Learn visually • Detailed coverage of all PMP concepts • Sample Questions PMBOK Chapter 8 : Project Quality Management Plan Quality management Perform Quality Assurance Perform Quality Control Monitoring & ControlPlanning Executing
  • 2. By: Anand Bobade (nmbobade@gmail.com) Chap 8- Project Quality Management Introduction Quality & Quality management definition Quality theories Quality management processes Each process in details Review of Quality Management knowledge area Exam Essentials & Tips Self assessment
  • 3. By: Anand Bobade (nmbobade@gmail.com) Quality Introduction -> What is Quality? Quality is Conformance to requirements (by- Philip B. Crosby) Quality is the degree to which a set of inherent (existing) characteristics fulfils requirements. High quality Product: • Meets or exceeds customers’ requirements Low quality product: • Not meeting stated requirements
  • 4. By: Anand Bobade (nmbobade@gmail.com) Introduction -> What is Quality? Product can be certified as Quality product if: • to the Product requirements.Conformance • adhere to the Requirements.Results • to the Requirements.No deviation • Do it right the first time.No rework • no defects in the delivered product or service.Zero Defects
  • 5. By: Anand Bobade (nmbobade@gmail.com) Quality management (ISO 9000:2005): • Coordinated activities to direct and control an organization with regard to Quality. Introduction -> What is Quality Management?
  • 6. By: Anand Bobade (nmbobade@gmail.com) It includes creating & following policies & procedures in order to ensure project meet it’s defined needs. Project Quality Management Creating & following - Policies & Procedures Meet defined quality needs of the Project PMI - Project Quality Management Definition
  • 7. By: Anand Bobade (nmbobade@gmail.com) Who is effected by Quality? Customer End users Management Project Manager Project Team
  • 8. By: Anand Bobade (nmbobade@gmail.com) Introduction – Quality vs. Grade If you opted for Saloon CAR, you probably choose it over the regular looking CAR because it looks superior. However, this Saloon CAR will looks low grade compared to Sports CAR.
  • 9. By: Anand Bobade (nmbobade@gmail.com) Introduction– Quality vs. Grade Quality of a product is a measure of how closely it matches its intended purpose. Grade is a measure of the value people put on a product. Different technical characteristics. High grade product might be low quality product. Regardless of the grade, the quality should be high. In any case, quality cannot be compromised.
  • 10. By: Anand Bobade (nmbobade@gmail.com) Introduction – Precision vs. Accuracy Accuracy: Refers to how far you are from the true value. (True value is yellow circle) This is accurate but not Precise. Precision: Refers to how close do you get to the same value if you repeated the exercise several times. This is precise but not accurate. Precise and accurate: Quality of product will be considered high if results are Precise and accurate.
  • 11. By: Anand Bobade (nmbobade@gmail.com) Screw making machine Quality testing • Between 5-7 CM. Expected screw length • All length between 5.5 to 6.5 CM. • Means they are Accurate. Results of cycle 1 • Outside expected range (above 7, but all between 7.1 & 7.3). Hence Precise.Results of cycle 2 Introduction – Precision vs. Accuracy
  • 12. By: Anand Bobade (nmbobade@gmail.com) Introduction -> Key concepts Customer satisfaction : • Understanding, evaluating, defining and managing requirements, so that customer expectations are met. Prevention over inspection: • Quality should be planned, designed, and built into into the project’s deliverables. • It should not be inspection driven (reactive). Continuous improvement: • The PDCA (plan-do-check-act) cycle is the basis for quality improvement. • Well known quality improvement theories include: Total Quality Management & Six Sigma.
  • 13. By: Anand Bobade (nmbobade@gmail.com) Introduction – Quality Theories Six Sigma (Introduced by Bill Smith at Motorola) Just In Time (Toyota) Total Quality Management - W. Edwards Deming: ISO – International Standard Organization 80/20 principle - Joseph Juran Zero Defects: Philip Crosby:
  • 14. By: Anand Bobade (nmbobade@gmail.com) Six Sigma Six Sigma: Introduced by Bill Smith at Motorola. Six sigma helps in Process control. It refines process to get rid of human error & outside influences. Uses precise measurements & continuous refinements. Quality Theories -> Six Sigma Define the problem & the objective Analyse the processes. Define factors of influence Assure that improvements will sustain What do we need to improve? Can we measure this? Identify & implement improvements
  • 15. By: Anand Bobade (nmbobade@gmail.com) Six Sigma Quality Theories -> Six Sigma Quality levels: Set of techniques and tools for process improvement. • Defects Per Million OpportunitiesDPMO : Sigma value 1 2 3 4 5 6 Compliance percentage 31% 69% 93.3% 99.38% 99.977% 99.99966% Defects percentage 69% 31% 6.7% 0.62% 0.023% 0.00034% DPMO 691,462 308,538 66,807 6,210 233 3.4 Sigma values will be used in calculation
  • 16. By: Anand Bobade (nmbobade@gmail.com) TQM Total Quality Management - W. Edwards Deming: Comprehensive & structured approach to organizational management that seeks to improve quality of products & services. Customer focused - objective is to consistently improve Customer satisfaction. Continuous on-going refinements in response to continuous feedback. Everyone is involved. 14 steps of total Quality Management, Plan-Do-Check- Act cycle. Quality Theories -> Total Quality Management
  • 17. By: Anand Bobade (nmbobade@gmail.com) ISO ISO standards: There are various ISO standards & certifications. ISO 9000 - Quality management ISO 27001 - Information security ISO 10006 – Quality in Project Management ISO 9126 – Software quality standards ISO 31000 - Risk management Introduction – ISO Standards The project quality management as described in PMI PMBOK®, is intended to be compatible with ISO.
  • 18. By: Anand Bobade (nmbobade@gmail.com) ISO ISO Quality management: Provide guidance & tools, to ensure products & services consistently meet customer’s requirements, and that quality is consistently improved. Customer Satisfaction Prevention over inspection Continuous improvement Management Responsibility Cost of Quality (COQ) Introduction – ISO Standards
  • 19. By: Anand Bobade (nmbobade@gmail.com) Introduction – Quality principals 80/20 principle - Joseph Juran: • 80% of outcomes can be attributed to 20% of causes. • E.g.,: • 80% of defects found in 20% modules of the system. • Fixing 20% modules will fix 80% of defects. Zero Defects: Philip Crosby: • Management-led program to eliminate defects in industrial production. • Cost of poor quality, prevention over inspection and zero defects. • Quality is “conformance to requirements”
  • 20. By: Anand Bobade (nmbobade@gmail.com) Introduction – Evolution of Quality Management 1950 1960 1970 1980 1990 2000 2007 Quality Control Quality Assurance ISO 9000 TQM- total Quality Management Six Sigma
  • 21. By: Anand Bobade (nmbobade@gmail.com) Process improvement models: Organizational Project Management Maturity Model (OPM3®) Capability Maturity Model Integrated (CMMI®) Malcolm Baldrige Introduction -> Process improvement models
  • 22. By: Anand Bobade (nmbobade@gmail.com) CMMI Capability Maturity Model Integration - Improve overall software quality (design, development and deployment) Introduction – CMMI Level 1 Initial Level 2 Managed Level 3 Defined Level 4 Quantitative ly managed Level 5 Optimizing Process unpredictable, poorly controlled & reactive. Process characterized for projects and is managed Process characterized for organization and is proactive Process is quantitatively measured and controlled Focus on continuous process improvement
  • 23. By: Anand Bobade (nmbobade@gmail.com) 8. Project Quality Management Knowledge Area 8.1 Plan Quality Management: • Identifying quality requirements & standards, and document how the project will demonstrate compliance. 8.2 Perform Quality Assurance: • Auditing the quality requirements and the results from quality control measurements, to ensure that appropriate quality standards are used. 8.3: Control Quality: • Monitoring and recording results of executing the quality activities to assess performance and recommend necessary changes.
  • 24. By: Anand Bobade (nmbobade@gmail.com) Learn Project Management & prepare for PMP exam: • Learn visually • Detailed coverage of all PMP concepts • Sample Questions
  • 25. By: Anand Bobade (nmbobade@gmail.com)By: Anand Bobade (nmbobade@gmail.com) 8.1 Plan Quality Management Plan Quality Management definition Plan Quality Management - ITTO What is Quality Management Plan? What is process improvement Plan? Seven basic Quality tools Review Self Assessment 8.1 I T&T O
  • 26. By: Anand Bobade (nmbobade@gmail.com) Identifying quality requirements & standards for project & it’s deliverables, & documenting how project will demonstrate compliance with quality requirements. It provides guidance & direction on how quality will be managed & validated throughout Project. 8.1 Plan Quality Management Project Requirements Identify Document 8.1 I T&T O
  • 27. By: Anand Bobade (nmbobade@gmail.com) 8.1 Plan Quality Management Inputs (6) • Project management plan • Stakeholder register • Risk register • Requirements documentation • EEF • OPA Tools & Techniques(8) • Cost-benefit analysis • Cost of quality • Seven basic quality tools • Benchmarking • Design of experiments • Statistical sampling • Additional quality planning tools • Meetings Outputs (5) • Quality management plan • Process improvement plan • Quality metrics • Quality checklists • Project documents updates 8.1 I T&T O
  • 28. By: Anand Bobade (nmbobade@gmail.com) PMP Stakeholder register Risk register Requirements documentation EEF OPA 8.1 Plan Quality Management->Input 8.1 I T&T O
  • 29. By: Anand Bobade (nmbobade@gmail.com) 8.1 Plan Quality Management->Input Scope baseline (Work Breakdown Structure , WBS Dictionary, Schedule baseline), Cost baseline, Other management Plans Identifying those stakeholders possessing a particular interest or having impact on the quality. Contains threats & opportunities that may impact quality requirements. 8.1 I T&T O
  • 30. By: Anand Bobade (nmbobade@gmail.com) 8.1 Plan Quality Management->Input Captures requirements that project should meet pertaining to stakeholders expectations. Project ( including product) & quality requirements. Government Agency regulations. Rules, standards & guidelines. Working or operating conditions. Organizational quality, policies, procedures and guidelines. Historical Database & Lesson learned. 8.1 I T&T O
  • 31. By: Anand Bobade (nmbobade@gmail.com) Cost-benefit analysis Cost of quality Seven basic quality tools Benchmarking Design of experiments Statistical sampling Additional quality planning tools Meetings 8.1 Plan Quality Management->T&T 8.1 I T&T O
  • 32. By: Anand Bobade (nmbobade@gmail.com) Cost of quality All cost incurred over the life of a Product: 8.1 Plan Quality Management->T&T->Cost of Quality Preventing non-conformance to the requirements. Appraising conformance to the requirements. Failing to meet requirements (reworks). 8.1 I T&T O
  • 33. By: Anand Bobade (nmbobade@gmail.com) 8.1 Plan Quality Management->T&T->Cost of Quality 8.1 I T&T O
  • 34. By: Anand Bobade (nmbobade@gmail.com) Cost-benefit Analysis A financial analysis tool used to determine the benefits provided by a project against its costs. Benefit of meeting quality requirements Less rework Higher productivity Lower costs Increased stakeholder satisfaction. The primary cost of meeting quality requirements is expenses associated with quality management activities. 8.1 Plan Quality Management->T&T->Cost Benefit Analysis Cost of quality 8.1 I T&T O
  • 35. By: Anand Bobade (nmbobade@gmail.com) Seven basic quality tools Cause-and-Effect Flowcharts Check-sheet Pareto Diagram Histograms Control Charts Scatter Diagram 8.1 Plan Quality Management->T&T-> 7 Basic quality tools 8.1 I T&T O Quality Planning Quality Assurance Quality Control 7QT
  • 36. By: Anand Bobade (nmbobade@gmail.com) Cause-and-Effect Diagram (Fishbone or Ishikawa diagrams): • It traces complaints about quality problems. • Help you find the root cause of a problem. 8.1 Plan Quality Management->T&T-> 7QT-> C&E Diagrams Major causes are further investigated. At the end, entire diagram is analysed & possible causes are identified. 5 whys technique: Repeat the question “Why”, to lead to the root cause of the Quality 8.1 I T&T O Uses brainstorming Identify problem. Work out major factors involved. Identify possible causes. Analyse diagram Major causes Contributing causes Problem to be solved 7QT
  • 37. By: Anand Bobade (nmbobade@gmail.com) Flowcharts (or process maps): • A graphical representation of a process showing relationships among process steps. • It transforms one or more input to one or more outputs. • Flowcharts display sequence of steps. 8.1 Plan Quality Management->T&T->7QT->Flowcharts •Suppliers, Inputs, Process, Outputs, CustomersSIPOC: 8.1 I T&T O7QT
  • 38. By: Anand Bobade (nmbobade@gmail.com) Check sheets (also known as Tally sheets): • Collect data about a problem during inspections. • Organize facts that will facilitate effective collection of data about quality problem. 8.1 Plan Quality Management->T&T->7QT->Check sheets Defect classification Check sheet Sr. No Defect Classification No of Defects 1 User Interface Defects 320 2 Unexpected exceptions 166 3 System Crashes 25 4 Wrong Calculation 33 5 Not according to requirements 326 6 Integration Failures 60 7 Others 70 Total Defects 1000 8.1 I T&T O7QT
  • 39. By: Anand Bobade (nmbobade@gmail.com) Histograms (by Karl Pearson): - Special types of bar charts. • Summarize the distribution of a data set. • Graphical representation of distribution of numerical data. • Each bar represents characteristic of a problem & height represents its frequency. Roll No Grade 1001 33 1002 25 1003 26 1004 78 1005 76 1006 73 1007 80 1008 71 1009 72 1010 72 1011 78 1012 70 1013 65 1014 66 1015 68 1016 61 1017 62 1018 63 1019 60 1020 66 1021 60 1022 70 1023 55 1024 50 1025 59 1026 50 1027 53 1028 59 1029 52 1030 53 1031 55 8.1 Plan Quality Management->T&T->7QT->Histograms Bin Units Frequency 0 0 5 0 10 0 15 0 20 0 25 0 30 2 35 1 40 2 45 1 50 6 55 9 60 14 65 4 70 7 75 1 80 5 85 0 90 0 95 0 100 0 0 0 0 0 0 0 2 1 2 1 6 9 14 4 7 1 5 0 0 0 0 0 2 4 6 8 10 12 14 16 0 5 10 15 20 25 30 35 40 45 50 55 60 65 70 75 80 85 90 95 100 No.ofStudents Percentage Students Percentage 1 2 3 Ex: Analyse student performance through Histogram: 1. List all students grades (e.g., 500 students) 2. Create bins (categories like 10 to 15%) & add frequencies. 3. Plot the histogram. 8.1 I T&T O7QT
  • 40. By: Anand Bobade (nmbobade@gmail.com) 8.1 Plan Quality Management->T&T->7QT->Histograms Observations: 1) Distribution of data is based on a bell curve. 2) Steep Bell Curve – Process in control. 3) Flat Curve – Process out of control. 0 0 0 0 0 0 2 1 2 1 6 9 14 4 7 1 5 0 0 0 0 0 2 4 6 8 10 12 14 16 0 5 10 15 20 25 30 35 40 45 50 55 60 65 70 75 80 85 90 95 100 No.ofStudents Percentage Students Percentage All Bars are of Equal widthOverall shape Shows Distribution There are 5 measurements between 75-80 8.1 I T&T O7QT
  • 41. By: Anand Bobade (nmbobade@gmail.com) Pareto Diagram: • It’s a histogram that can help you identify & prioritize problem areas. • Pareto analysis (80-20 rule), means that, 80% of problems are often due to 20% of the causes. 33 65 81 88 94 98 100 1 11 21 31 41 51 61 71 81 91 1 2 3 4 5 6 7 Percentage Defects per Category Defects analysis 8.1 Plan Quality Management->T&T->7QT->Pareto Diagram Sr. No Defect Classification No of Defects 1 Not according to requirements 326 2 User Interface Defects 320 3 Unexpected exceptions 166 4 Others 70 5 Integration Failures 60 6 Wrong Calculation 33 7 System Crashes 25 8.1 I T&T O - 900 - 800 - 600 - 500 - 400 - 300 - 200 - 100 - 0 No.ofdefects 7QT
  • 42. By: Anand Bobade (nmbobade@gmail.com) 8.1 Plan Quality Management->T&T->7QT->Pareto Diagram When to use Pareto Charts: When you have a lot of data for analysis. When you want to identify main cause of problems. When communicating data with stakeholders. When you want to prioritize tasks. When you want to see relative importance of data. 8.1 I T&T O7QT
  • 43. By: Anand Bobade (nmbobade@gmail.com) Control Charts (developed by Walter A. Shewhart): • Graphic display that illustrates results of a process over time. • Determine whether a process is in control or out of control. • Prevent defects, rather than to detect or reject them. Specification limit (USL or LSL) : Point determines by customer. Control limit (UCL or LCL) : It is point determine by process owner. It’s typically 3 sigma. 8.1 Plan Quality Management->T&T->7QT->Control Charts LSL USL 8.1 I T&T O7QT
  • 44. By: Anand Bobade (nmbobade@gmail.com) Control Charts (developed by Walter A. Shewhart): • Graphic display that illustrates results of a process over time. • Determine whether a process is in control or out of control. • Prevent defects, rather than to detect or reject them. 8.1 Plan Quality Management->T&T->7QT->Control Charts • 68.27%1 Sigma • 95.44%2 sigma • 99.73%3 Sigma (UCL / LCL) • 99.99%6 Sigma Sigma is another name for standard deviation & indicates how much variance from mean has been established as permissible in the process. Level of quality is indicated by 3 or 6 sigma. 3 Sigma • 66,807 out of 1 million screws produced will have some problems. 6 Sigma • 3.4 out of 1 million screws produced will have problems 8.1 I T&T O7QT
  • 45. By: Anand Bobade (nmbobade@gmail.com) 8.1 Plan Quality Management->T&T->7QT->Control Charts UCL=7CM LCL=5CM Upper Specification limit =7.25CM Lower Specification limit =4.75 CM Mean / Average = 6 CM 3 sigma 7.5 7.0 6.5 6.0 5.5 5.0 4.5 Qualityspecification 2 4 6 8 10 12 14 16 18 20 Sample Length = 6 CM 8.1 I T&T O7QT
  • 46. By: Anand Bobade (nmbobade@gmail.com) 8.1 Plan Quality Management->T&T->7QT->Control Charts 2 4 6 8 10 12 14 16 18 20 UCL=7CM LCL=5CM Upper Specification limit =7.25CM Lower Specification limit =4.75 CM Mean / Average = 6 CM 7.5 7.0 6.5 6.0 5.5 5.0 4.5 8.1 I T&T O7QT
  • 47. By: Anand Bobade (nmbobade@gmail.com) 8.1 Plan Quality Management->T&T->7QT->Control Charts Process is in control: All points are between UCL & LCL. Also called as normal Cause. 99.97% points (3 sigma) fall within the control limits 4 standard deviations from mean Analyse control chats shown in previous slide: 8.1 I T&T O7QT
  • 48. By: Anand Bobade (nmbobade@gmail.com) Out of control Rule of Seven 8.1 Plan Quality Management->T&T->7QT->Control Charts 2 4 6 8 10 12 14 16 18 20 UCL=7CM LCL=5CM Upper Specification limit =7.25CM Lower Specification limit =4.75 CM Mean / Average = 6 CM 7.5 7.0 6.5 6.0 5.5 5.0 4.5 8.1 I T&T O7QT
  • 49. By: Anand Bobade (nmbobade@gmail.com) 8.1 Plan Quality Management->T&T->7QT->Control Charts Process is out of control - There is one dot out of UCL, called as special cause. Rule of seven: Consecutive 7 time, measurements fall on the one side of the mean. This also, means process is out of control & need investigation. Assignable causes – Variations may be caused by differences in machines, workers overtime, etc. Identify the root cause Analyse control chats shown in previous slide: 8.1 I T&T O7QT
  • 50. By: Anand Bobade (nmbobade@gmail.com) Scatter Diagram(scatter plot/ graph, correlation chart): • Predict how change in an independent variable will change a dependent variable. 8.1 Plan Quality Management->T&T->7QT->Scatter Diagram Show if there is a relationship between two variables. Usually first variable is independent & second is dependent on first. Useful when one variable is easy to measure & other is not. Closer data points are to a diagonal line, stronger relation. 8.1 I T&T O7QT
  • 51. By: Anand Bobade (nmbobade@gmail.com) 8.1 Plan Quality Management->T&T->7QT->Scatter Diagram Three Types of correlation: No Correlation Moderate Correlation Strong Correlation Both Moderate & Strong correlation can be positive or negative. Regression line No Correlation 8.1 I T&T O7QT
  • 52. By: Anand Bobade (nmbobade@gmail.com) Example: The Y axis show number of Accidents and X axis show speed of vehicle. As speed increases, accidents increases. 8.1 Plan Quality Management->T&T->7QT->Scatter Diagram Moderate Correlation Strong Correlation Accidents Positive Positive Speed of vehicle 140 to 180 KM/Hour Speed of vehicle 180 to 220 KM/Hour 8.1 I T&T O7QT
  • 53. By: Anand Bobade (nmbobade@gmail.com) Example: The Y axis show cost of Project resources and X axis show project profile. As cost of project resources increases, profit will decrease. If resource cost is one of the factor then correlation will be moderate, however if this is only factor then correlation will be strong. 8.1 Plan Quality Management->T&T->7QT->Scatter Diagram Strong Correlation Moderate Correlation Negative NegativeReducing project profit Reducing project profit CostofProjectresources 8.1 I T&T O7QT
  • 54. By: Anand Bobade (nmbobade@gmail.com) 8.1 Plan Quality Management->T&T->7QT Overview Traces complaints about quality problems. Process showing relationships among process steps. Process Map. Effective collection of data about potential quality problem. Inspection. Histogram. 80-20 rule. Identify & prioritize problem areas. Central tendency, dispersion. Frequency. Results of a process over time. Identify process gaps. Preventive. Relationship between two variables. 8.1 I T&T O7QT
  • 55. By: Anand Bobade (nmbobade@gmail.com) Benchmarking Comparing actual or planned practices, such as processes & operations, to other organizations. Comparison may be between two companies, projects, products, materials etc The organizations compared can be internal or external. 8.1 Plan Quality Management->T&T->Benchmarking 8.1 I T&T O Identify best practices, generate ideas for improvement, and provide a basis for measuring performance.
  • 56. By: Anand Bobade (nmbobade@gmail.com) Design of experiments Identify factors that can influence different variables of product or process. Used to determine number & type of tests needed to achieve required quality. We can change multiple variables at a time, to find optimal condition. Once we know, factors that influence product, quality check list will be developed for them. 8.1 Plan Quality Management->T&T->DOE 8.1 I T&T O
  • 57. By: Anand Bobade (nmbobade@gmail.com) Statistical sampling Choosing few items as a sample from a larger group of items. During planning we will decide, how to do sampling in quality control process. Help to determining cost of quality (COQ) Types of Data measurement: Variable (Continuous) : Measure with yes or no. Can be divided. E.g., Typical variable values will be like students passes exam (Pass or fail). Attribute (discrete): Measure by counting. Can’t divide. E.g., Number of children in a family, Or attendance at a theatre. It can not be like 1.5 8.1 Plan Quality Management->T&T->Statistical Sampling 8.1 I T&T O
  • 58. By: Anand Bobade (nmbobade@gmail.com) Additional quality planning tools Brainstorming: Used for generating ideas. Force Field Analysis: Diagrams of forces for and against change. Nominal Group Technique: In this technique to vote for ideas to be further discussed by a larger group of people . Quality Control and Management Tools: This tools will be explained in the next process. 8.1 Plan Quality Management->T&T->Add. QPT 8.1 I T&T O
  • 59. By: Anand Bobade (nmbobade@gmail.com) Force Field Analysis: • It is a decision-making technique. • Helps to make a decision by analysing forces for & against a change. 8.1 Plan Quality Management->T&T->Add. QPT Eliminate re-keying errors Faster execution of administrative work Online documentation eliminate work Reduces need for clerical staff Increase control Auditing capabilities Managers unhappy with clerical work Requires Training of more Peoples Some activity cost shift to high paid staff Cost of eliminating clerical cost Start up cost HumanResourceSystem Implementation Forces for Change Forces against Change Relativeforcestrength Relativeforcestrength 1 1 1 1 1 2 2 23 4 Total = 10 Total = 8 8.1 I T&T O
  • 60. By: Anand Bobade (nmbobade@gmail.com) Meetings 8.1 Plan Quality Management->T&T->Meetings 8.1 I T&T O Any one with quality related responsibilities should attend meetings. Key participants: Project Manager Sponsor Quality manager Selected team members Selected stakeholders Discuss & agree on quality standards. Discuss & agree on quality requirements
  • 61. By: Anand Bobade (nmbobade@gmail.com) 8.1 Plan Quality Management->T&T->Summary Cost of implementing quality requirements against benefits Quality cost incurred over the life of a the Product Cause-and-Effect, Flowcharts, Check-sheet, Pareto Diagram, Histograms, Control chart, Scatter Diagram Compare to past activities/standard Change several factors for each experiment, to determine best approach Choosing few items as a sample from a larger group of items. Additional QM tools: Brainstorming, Force Field Analysis, Nominal Group Technique, Quality Control and Management Tools. Quality related meetings 8.1 I T&T O
  • 62. By: Anand Bobade (nmbobade@gmail.com) Quality management plan Process improvement plan Quality metrics Quality checklists Project documents updates 8.1 Plan Quality Management->Outputs 8.1 I T&T O
  • 63. By: Anand Bobade (nmbobade@gmail.com) 8.1 Plan Quality Management->Outputs 8.1 Plan Quality Management: 8.2 Perform Quality Assurance: 8.3: Control Quality: Quality metrics Process improvement plan Quality checklists 8.1 I T&T O
  • 64. By: Anand Bobade (nmbobade@gmail.com) Quality Management Plan Quality management plans explains how organizations quality policies will be implemented. Depending on project, plan can be very detailed or simple. Planned should be reviewed early. Sharper focus on projects value proposition. (Cost of Quality, Cost benefit analysis) Details how Quality requirements are captured. Should refer to Quality management standard followed by product. May contain sample size of process to calculate it. 8.1 Plan Quality Management->Outputs ->QMP 8.1 I T&T O
  • 65. By: Anand Bobade (nmbobade@gmail.com) Process Improvement Plan It details the steps that will help improving various process. It helps you to analyse the existing business processes, identify problems and rectify them to improve the. It is implemented in the QA and QC processes. It contains: • The purpose of process, inputs & outputs, Owner etcProcess Boundaries: • Graphical depiction of the process.Process Configuration: • Used for measuring process efficiency (Control limits).Process Metric: • Targets for improvement. Targets for Improved Performance: 8.1 Plan Quality Management->Outputs->PIP 8.1 I T&T O
  • 66. By: Anand Bobade (nmbobade@gmail.com) Quality metrics Description of a project/product attribute & how to measure it. They are used to directly translate customer needs into acceptable performance measures in both products and processes. E.g., Finishing project within budget & time, freq. of defects, failure rate The metrics & tolerance level for variation is set in Quality plan. 8.1 Plan Quality Management->Outputs->Quality Metrics Tactical Measure Time Cost Resources Scope Sample Indicator Schedule Performance Index (SPI) = Earned Value / Planned Value Cost Performance Index (CPI) = Earned Value / Actual Cost Amount of hours overspent per Testing cycle Number of Change Requests 8.1 I T&T O
  • 67. By: Anand Bobade (nmbobade@gmail.com) Quality checklists A structured tool used to verify that a set of required steps has been performed. It is a list of items you need to verify, check or inspect. They are used in every imaginable field — from building inspections to complex medical surgeries. It allows you to ensure you don’t forget any important steps. Developed based on product requirements. List steps to be followed to achieve desired quality. 8.1 Plan Quality Management->Outputs 8.1 I T&T O
  • 68. By: Anand Bobade (nmbobade@gmail.com) 8.1 Plan Quality Management->Outputs Project documents updates Risk Register, Requirement Traceability Matrix WBS dictionary 8.1 I T&T O
  • 69. By: Anand Bobade (nmbobade@gmail.com) 8.1 Plan Quality Management 8.1 I T&T O
  • 70. By: Anand Bobade (nmbobade@gmail.com) Self Assessment c. Raise Change request with recommendation to address the process Gap Since you are responsible for the Quality assurance activities on the project. Its your responsibility to officially inform to concern authority. Hence you must officially raise CR for CCB review. You are reporting to a very senior Project Manager on CRM project and responsible for the quality assurance of the Project. You found some serious process gap in the process followed by the team. If issue is not addressees in time, project may end up with failure. How you will deal with the situation? a. PM is responsible for the team activities hence don’t do anything. b. Privately talk to PM and raise the issue. c. Raise Change request with recommendation to address the process Gap d. Direct team to work on the new process recommended by you. 8.1 I T&T O
  • 71. By: Anand Bobade (nmbobade@gmail.com) Self Assessment b. Precision is consistency that the value of a repeated set of measurements are clustered and have little scatter whereas accuracy is correctness that the measured value is very close to the true value. PM is unsure of the difference between precision and accuracy and asks for your help in understanding the difference between the two terms. Which of these responses would be the best response to such a question? a. Accuracy and Precision are equivalent and normally specified in the SOW by the customer who issues the SOW. b. Precision is consistency that the value of a repeated set of measurements are clustered and have little scatter whereas accuracy is correctness that the measured value is very close to the true value. c. Accuracy is more important than precision. The project management team must decide the level of accuracy required. d. Accuracy is consistency that the value of a repeated set of measurements are clustered and have little scatter whereas precision is correctness that the measured value is very close to the true value. 8.1 I T&T O
  • 72. By: Anand Bobade (nmbobade@gmail.com) Self Assessment d. Rework Cost of failure detected internally is really an example of: a. Cost of conformance b. Quality Audit c. Cost of Warranty d. Rework 8.1 I T&T O
  • 73. By: Anand Bobade (nmbobade@gmail.com) Self Assessment Answer: a. The design of experiments The method used in the plan quality management process to identify the factors that may influence specific variables of a product under development is known as: a. The design of experiments b. Statistical sampling c. Prototyping d. Control charts 8.1 I T&T O
  • 74. By: Anand Bobade (nmbobade@gmail.com) Self Assessment Answer: a. Business will accept the doors Results are within UCL & LCL. It is not qualifying for rule of seven hence process in still within control. You are producing doors. The control limits set for the thickness of doors for this process set to 9.8cm and 10.2cm. The business specification limits are 9.7 cm and 10.3cm. During Inspection, it was noticed that last 6 doors continuously has thickness of 10.25 cm long. Select appropriate answer. a. Business will accept the doors b. Quality parameters are not meet c. Business will reject the doors d. The process is out of control and needs to be adjusted. 8.1 I T&T O
  • 75. By: Anand Bobade (nmbobade@gmail.com) Self Assessment d. Performance is out of control as 7 consecutive results are above the mean. During Control chart analysis, Process is considered out of control if seven consecutive data poins are on one side of the mean (Reference: PMBOK 238) Your are executing a Software Performance Test. According to the PT acceptable each transaction should execute within 1 to 30 milliseconds. After the execution results were as 16, 18,16, 17, 17, 18, 16,18,16, 16, 17,15 milliseconds respectively. How you will interpret this data using control chart. a. Performance is within control as all results are close to mean value. b. Performance is within control as all results fall within acceptable range. c. Performance is out of control as results are constantly varying. d. Performance is out of control as 7 consecutive results are above the mean. 8.1 I T&T O
  • 76. By: Anand Bobade (nmbobade@gmail.com) Self Assessment c. 7 consecutive points are on one side of the mean, even though they are within the control limits The “Rule of Seven” comes into play when a. 7 points become out of control b. 7 points breach the standard deviation c. 7 consecutive points are on one side of the mean, even though they are within the control limits d. 7 random points that are on any side of the mean, but within or without the control limits 8.1 I T&T O
  • 77. By: Anand Bobade (nmbobade@gmail.com) Learn Project Management & prepare for PMP exam: • Learn visually • Detailed coverage of all PMP concepts • Sample Questions
  • 78. By: Anand Bobade (nmbobade@gmail.com)By: Anand Bobade (nmbobade@gmail.com) 8.2 Perform Quality Assurance Perform Quality Assurance definition Perform Quality Assurance - ITTO Difference between Quality control & assurance Quality management & control tools What is Quality Audit? Review Self Assessment 8.2 I T&T O
  • 79. By: Anand Bobade (nmbobade@gmail.com) 8. Project Quality Management Knowledge Area 8.1 Plan Quality Management: • It is the process of identifying quality requirements and/or standards for the project and its deliverables • Document how the project will demonstrate compliance with relevant quality requirements. 8.2 Perform Quality Assurance: • It is the process of auditing the quality requirements and the results from quality control measurements to ensure that appropriate quality standards and operational definitions are used. 8.3: Control Quality: • It is the process of monitoring and recording results of executing the quality activities to assess performance and recommend necessary changes. 8.2 I T&T O
  • 80. By: Anand Bobade (nmbobade@gmail.com) Process of auditing quality requirements & results from quality control measurements to ensure appropriate quality standards & operational definitions are used. It facilitates the improvement of quality processes. 8.2 Perform Quality Assurance Ensure Quality Standards & Operational Definitions are used Quality requirement s Results from Quality Control Measures 8.2 I T&T O
  • 81. By: Anand Bobade (nmbobade@gmail.com)Copyrights @ Anand Bobade (nmbobade@gmail.com – 055-5932004) Quality Control & Quality Assurance process Direct and Manage Project work Control Quality Plan Quality management Perform Quality Assurance Deliverables Quality Checklist Sampling Inspection (System testing, Load testing etc) Quality Control measurements Quality Audit Process Analysis QMPQuality Matrix Process Improvement plan No. of defects Defect classification Perform Integrated change Control WPD PMP Project Documents Verified Del’s WPI Validated changes Change Request PMP updates Approved CR Approved CR review 8.2 I T&T O
  • 82. By: Anand Bobade (nmbobade@gmail.com) 8.2 Perform Quality Assurance-> ITTO Inputs (5) • Quality management plan • Process improvement plan • Quality metrics • Quality control measurements • Project documents Tools & Techniques(3) • Quality management & control tools • Quality audits • Process analysis Outputs (4) • Change requests • PMP updates • Project documents updates • OPA updates 8.2 I T&T O
  • 83. By: Anand Bobade (nmbobade@gmail.com) Quality Management Plan Process Improvement Plan Quality Metrics Quality Control Measurements Project documents 8.2 Perform Quality Assurance -> Input 8.2 I T&T O
  • 84. By: Anand Bobade (nmbobade@gmail.com) 8.2 Perform Quality Assurance -> Input 8.1 Plan Quality Management: 8.2 Perform Quality Assurance: 8.3: Control Quality: 8.2 I T&T O
  • 85. By: Anand Bobade (nmbobade@gmail.com) 8.2 Perform Quality Assurance -> Input Quality management plan: • Contains plan for quality assurance and process improvement. Process Improvement Plan: • This will tell us about the project’s process improvement plan which needs to be aligned with quality assurance process. Quality Metrics: • It will tells what we need to measure and what are the allowable variation for our measurements. 8.2 I T&T O
  • 86. By: Anand Bobade (nmbobade@gmail.com) 8.2 Perform Quality Assurance -> Input Quality Control Measurements: • Documented results of control quality activities (measurements taken in Control Quality Process) • Measurements are used as input for Quality Assurance. • Evaluate effectiveness of quality assurance process. Project documents: • It may influence Quality assurance work • It should be monitored within the context of system for Configuration management. 8.2 I T&T O
  • 87. By: Anand Bobade (nmbobade@gmail.com) Quality Management & Control Tools Quality Audits Process Analysis 8.2 Perform Quality Assurance-> Tools & Techniques 8.2 I T&T O
  • 88. By: Anand Bobade (nmbobade@gmail.com) Quality Management & Control Tools Affinity diagram PDPC Interrelationship Digraph Tree Diagram Prioritization Matrix Network Diagram Matrix Diagram 8.2 Perform Quality Assurance->T&T->QM&CT 8.2 I T&T O
  • 89. By: Anand Bobade (nmbobade@gmail.com) Affinity Diagram: Classifying large number of ideas into groups 8.2 Perform Quality Assurance->T&T->QM&CT 8.2 I T&T O
  • 90. By: Anand Bobade (nmbobade@gmail.com) Interrelationship Digraph: Provide a process for creative problem-solving in moderately complex scenarios that possess logical relationships. 8.2 Perform Quality Assurance->T&T->QM&CT 1. City Growth concentrated in east & west 2. South has no infrastructure to attract city growth 3. Highway 111 can’t be widened through city center 4. Existing transportation plan is inadequate 5. Clock tower tunnel can ease City center congestion 8. Congestion in City center is getting worse 7. Grand road can be widened to reduce congestion 6. Additional river bridge is required to divert traffic away from city center 9. Main bridge on river is located close to City center An item with large number of outputs considered as cause of many effect. An item with large number of inputs can be source of Quality metrics. 8.2 I T&T O
  • 91. By: Anand Bobade (nmbobade@gmail.com) Process Decision Program Chart (PDPC) : Used to understand a goal in relation to steps for getting to goal. It identifies what might go wrong in a plan under development. 8.2 Perform Quality Assurance->T&T->QM&CT Improve Product Quality Quality Training Self Study Difficult to track progress Provide oversight of individuals No interaction benefit Periodically bring students together Training by outside Expert Costly Allocate funds in budget Lack of internal process understanding Train trainer on internal processes Training by internal SME Time commitment is high Get management buy-in. No training experience Train on presentation skills X X XO O O Project benefit do not overweight Risk Project benefit do not overweight Risk Logistics Cost Schedule Selected Mitigation benefit overweight mitigated Risk Internal SME improve presentation skills. Cost saving compared with external. Team building with interaction & participation. 8.2 I T&T O
  • 92. By: Anand Bobade (nmbobade@gmail.com) 1. Divided & subdivide a complex plan into more simple steps. 2. Identify possible problems that will hinder implementing the plan. 4. Put O in front of the solutions that are practical and you put X in front of the solutions that are not practical. 4. At the end you either change your plan where there is no practical solution or prepare yourself accordingly. 8.2 Perform Quality Assurance->T&T->QM&CT 8.2 I T&T O
  • 93. By: Anand Bobade (nmbobade@gmail.com) 8.2 Perform Quality Assurance->T&T->QM&CTWhentoUse: Tree Diagram: A systematic diagram of decomposition, used to visualize parent- to-child relationships. Issue is addressed at high level & you need to move to specific details. Used when analysing processes in detail. Used when probing for the root cause of a problem. Can be used as a communication tool. 8.2 I T&T O
  • 94. By: Anand Bobade (nmbobade@gmail.com) Matrix Diagram: It shows relationship between factors, causes, and objectives. It provides a compact way of representing many-to-many relationships of varying strength. 8.2 Perform Quality Assurance->T&T->QM&CT List 1 List 2 Item1 Item A Item2 Item B Item3 Item C Item4 Item D Item5 Item E ItemA ItemB ItemC ItemD ItemE Item1 O Item2 O O Item3 O O O Item4 O Item5 O 8.2 I T&T O
  • 95. By: Anand Bobade (nmbobade@gmail.com) # Defect description Module1 Module2 Module3 Module4 Module5 Module6 Module7 Module8 Module9 Module10 1 System is calculating wrong totals O O O O O O 2 System not meeting Performance O O O O 3 Background colour is not as per specification. O O O O O O O O O O 4 Validation message box has wrong message. O O O O 5 System O O O O O O O Matrix Diagram example: 8.2 I T&T O
  • 96. By: Anand Bobade (nmbobade@gmail.com) Prioritization Matrices : To prioritize tasks, issues or possible options based on known, weighted criteria. 8.2 Perform Quality Assurance->T&T->QM&CT # Defect description Duration Complexity Impact on other modules Total 1 System is calculating wrong totals 10 10 10 30 2 System not meeting Performance 5 5 5 15 3 Background colour is not as per specification. 4 Validation message box has wrong message. 5 System # Development Duration Value 1 More than a week 5 2 2 to 7 days 7 3 Less than 2 days 10 # Development complexity Value 1 Complex 5 2 Medium 7 3 No impact 10 # Impact to other area’s Value 1 Major 5 2 Medium 7 3 Minor 10 Weighted Criteria's 8.2 I T&T O
  • 97. By: Anand Bobade (nmbobade@gmail.com) It is used to sort a list of items into order of relative importance. Used usually when short list of items needs to be prioritised. The rigorous approach can be helpful in gaining agreement within a group It helps to present right decision to lead to a more successful outcome. 8.2 Perform Quality Assurance->T&T->QM&CT 8.2 I T&T O
  • 98. By: Anand Bobade (nmbobade@gmail.com) 8.2 Perform Quality Assurance->T&T->QM&CT 1. List items to prioritise 2. Identify criteria 3. Identify weights 4. Score items 5. Total scores 6. Interpret 7. Take action Lowcostof implementation Lowrunning costs Highchanceof success Highchanceof beingapproved Weight: 2 5 3 4 Full supplier review system 1 3 5 2 11 40 New supplier managers 5 4 3 1 13 43 Short education program 3 1 3 4 11 36 Reselection of suppliers 2 1 2 3 8 27 Unweightedtotal Weightedtotal CriteriaScoring: 1 = meets criteria poorly 5 = meets criteria very well Weighting: 1 = unimportant, 5 = very important 5x2 + 4x5 + 3x3 + 1x4 1 2 3 4 5 New suppliers managers would need work to get approved. Work on getting sponsorship. Support with short education program. 6 7 8.2 I T&T O
  • 99. By: Anand Bobade (nmbobade@gmail.com) 8.2 Perform Quality Assurance->T&T->QM&CT Overview Classifying large number of ideas into groups. What might go wrong in a plan under development. Different problems are related to each other. Used after Case-and-effect, mind mapping, affinity diagram. General plan is related to specific parts. Action plan. Communication. Prioritize tasks. Options based on weighted criteria. How activates are connected. When to apply quality procedures. Relationship between factors, causes, and objectives. Many to may relations. 8.2 I T&T O
  • 100. By: Anand Bobade (nmbobade@gmail.com) Quality audits Quality audits are independent reviews of the quality processes & procedures. Quality audits can done randomly or can be scheduled based. Audits can be carried externally or internally. Quality audits can confirm implementation of: Approved changes Corrective actions Preventive action Defect repairs 8.2 Perform Quality Assurance-> T&T->Quality Audits 8.2 I T&T O
  • 101. By: Anand Bobade (nmbobade@gmail.com) Process Analysis Implement plan outlined in “Process Improvement Plan” which was an output to Plan Quality Management process. Use root-cause analysis to identify problems in processes and take preventive actions. 8.2 Perform Quality Assurance->T&T->Process Analysis 8.2 I T&T O
  • 102. By: Anand Bobade (nmbobade@gmail.com) Change requests PMP updates Project doc’s updates OPA updates 8.2 Perform Quality Assurance -> Output 8.2 I T&T O
  • 103. By: Anand Bobade (nmbobade@gmail.com) 8.2 Perform Quality Assurance -> Output Change requests related to corrective, preventive, and defect repair are made. Quality Management Plan, Scope Management Plan, Schedule Management Plan, and Cost Management Plan are updated. Audit Reports, Training Plans, and Process Documentation are updated. Organization quality standards and quality management systems are updated 8.2 I T&T O
  • 104. By: Anand Bobade (nmbobade@gmail.com) 8.2 Perform Quality Assurance -> Process Flow Chart 8.2 I T&T O
  • 105. By: Anand Bobade (nmbobade@gmail.com) Self Assessment d. Where it is determined if standards are being met, work is continuously improved & problem are identified & fixed. Perform Quality Assurance process is: a. Where the customer formally accepts the product. b. Where the customer performs a test of the product of the project to check for correctness of the work product. c. Where any variances are recorded as changes and sent to Change Control Board for review. d. Where it is determined if standards are being met, work is continuously improved & problem are identified & fixed. 8.2 I T&T O
  • 106. By: Anand Bobade (nmbobade@gmail.com) Self Assessment c. Quality is driven by Prevention. Which of the following is most TRUE regarding quality? a. It is cheaper to build quality into a project. b. Quality is driven by Inspection. c. Quality is driven by Prevention. d. Quality always costs more in the long run 8.2 I T&T O
  • 107. By: Anand Bobade (nmbobade@gmail.com) Self Assessment Answer: c. Present the results of quality audit’s. A customer is constantly concerned about the product quality & thinking that quality process are not being followed as agreed in the quality management plan. How project manager can verify this claim? a. Invite customer to perform the quality inspections b. Increasing the sample size c. Review the results of quality audit’s. Request customer to review quality management plan 8.2 I T&T O
  • 108. By: Anand Bobade (nmbobade@gmail.com) Learn Project Management & prepare for PMP exam: • Learn visually • Detailed coverage of all PMP concepts • Sample Questions 8.2 I T&T O
  • 109. By: Anand Bobade (nmbobade@gmail.com)By: Anand Bobade (nmbobade@gmail.com) 8.3 Control Quality Control Quality definition Control Quality - ITTO Difference between Quality control & assurance Difference between Quality control & verify scope What is Inspection? Review Self Assessment 8.3 I T&T O
  • 110. By: Anand Bobade (nmbobade@gmail.com) 8. Project Quality Management Knowledge Area 8.1 Plan Quality Management: • It is the process of identifying quality requirements and/or standards for the project and its deliverables • Document how the project will demonstrate compliance with relevant quality requirements. 8.2 Perform Quality Assurance: • It is the process of auditing the quality requirements and the results from quality control measurements to ensure that appropriate quality standards and operational definitions are used. 8.3: Control Quality: • It is the process of monitoring and recording results of executing the quality activities to assess performance and recommend necessary changes. 8.3 I T&T O
  • 111. By: Anand Bobade (nmbobade@gmail.com) Monitoring & recording results of executing quality activities to assess performance & recommend necessary changes. - Identifying causes of poor process/product quality & recommend action -Validating that project deliverables & work to meet the requirements. 8.3 Control Quality Monitoring & Recording Recommend ation Action Action Execution of quality activities Assess performance Recommend necessary changes 8.3 I T&T O
  • 112. By: Anand Bobade (nmbobade@gmail.com)Copyrights @ Anand Bobade (nmbobade@gmail.com – 055-5932004) Quality Control & Quality Assurance process Direct and Manage Project work Control Quality Plan Quality management Perform Quality Assurance Deliverables Quality Checklist Sampling Inspection (System testing, Load testing etc) Quality Control measurements Quality Audit Process Analysis QMPQuality Matrix Process Improvement plan No. of defects Defect classification Perform Integrated change Control WPD PMP Project Documents Verified Del’s WPI Validated changes Change Request PMP updates Approved CR Approved CR review 8.3 I T&T O
  • 113. By: Anand Bobade (nmbobade@gmail.com) 8.3 Control Quality Inputs (8) • Project management plan • Quality metrics • Quality checklists • Work performance data • Approved change requests • Deliverables • Project documents • Organizational process assets Tools & Techniques (4) • Seven basic quality tools • Statistical sampling • Inspection • Approved change requests review Outputs (8) • Quality control measurements • Validated changes • Verified deliverables • Work performance information • Change requests • PMP updates • Project documents updates • OPA updates 8.3 I T&T O
  • 114. By: Anand Bobade (nmbobade@gmail.com) 8.3 Control Quality -> Concepts Prevention • It is about keeping errors out of process Inspection • It is about keeping errors out of hands of the customer Attribute Sampling • The result of an attribute either conforms or does not conforms 8.3 I T&T O
  • 115. By: Anand Bobade (nmbobade@gmail.com) 8.3 Control Quality -> Concepts Tolerance: • Tolerance is a specified range of acceptable results. Variable Sampling: • The result of variable is on continuous scale with a degree of conformity. Control Limits: • Control Limits is about specifying boundaries for a stable process. 8.3 I T&T O
  • 116. By: Anand Bobade (nmbobade@gmail.com) PMP Quality metrics Quality checklists Work Performance data Approved change requests Deliverables Project documents OPA 8.3 Control Quality -> Input 8.3 I T&T O
  • 117. By: Anand Bobade (nmbobade@gmail.com) 8.3 Control Quality -> Input 8.1 Plan Quality Management: 8.3: Control Quality: Part of PMP 8.3 I T&T O
  • 118. By: Anand Bobade (nmbobade@gmail.com) Quality metrics It describes how project or products attributes will be measured. 8.3 Control Quality -> Input->Quality Metrics Function Points (FP): • In IT, FP are used to count number of function, an information system providing to a business. • Can be used for estimation. Mean time between Failures (MTBF): • It shows reliability of product. • It specifies time between two failures. • E.g., hard disk will have a failure after 300,000 hours. Mean time to repair (MTTR): • It is average amount of time a device/product will need to be repaired. 8.3 I T&T O
  • 119. By: Anand Bobade (nmbobade@gmail.com) 8.3 Control Quality -> Input Quality Management Plan of the Project Management Plan. A list that will help us to verify, if produced deliverables fulfils product/project requirements. The data gathered from actual, which can include planned Vs actual schedule performance, cost performance and technical performance. The changes requested may include defect repairs which needs to quality controlled and verified. 8.3 I T&T O
  • 120. By: Anand Bobade (nmbobade@gmail.com) 8.3 Control Quality -> Input Deliverables are validated in Control Quality process. Agreements, quality audit documents, training plans and their assessment, process documentation Organization’s quality policies, defect reporting procedure, and communication policy 8.3 I T&T O
  • 121. By: Anand Bobade (nmbobade@gmail.com) Seven basic quality tools Statistical sampling Inspection Approved CR review 8.3 Control Quality -> Tools & Techniques 8.3 I T&T O
  • 122. By: Anand Bobade (nmbobade@gmail.com) 8.3 Control Quality -> Tools & Techniques These were explained in Plan Quality Management -> Tools & Techniques As defined in the Quality Management Plan, samples are selected and tested (Already explained) Inspection refers to the examination of the product in order to determine whether it according to the documented standards (review, peer reviews, audits, or walkthroughs). Inspections are also used to validate defect repairs. All the approved change requests are reviewed to verify they are implemented as approved. 8.3 I T&T O
  • 123. By: Anand Bobade (nmbobade@gmail.com) Quality control measurements Validated changes Verified deliverables Work performance information Change requests PMP updates Project documents updates OPA updates 8.3 Control Quality -> Output 8.3 I T&T O
  • 124. By: Anand Bobade (nmbobade@gmail.com) 8.3 Control Quality -> Output 8.2 Perform Quality Assurance: 8.3: Control Quality: Quality control measurements 8.3 I T&T O
  • 125. By: Anand Bobade (nmbobade@gmail.com) 8.3 Control Quality->Output->Verified Deliverables Goals of Control Quality is to verify the correctness of deliverables. Thus deliverables are either verified or rejected. The verified deliverables becomes input to Validate Scope process where they are formally accepted or rejected. Verified deliverables Direct & Manage Project Work -> Deliverables Control Quality (Quality tools & Inspection) Verified Deliverables (Output) Scope Management (Validate Scope) 8.3 I T&T O
  • 126. By: Anand Bobade (nmbobade@gmail.com) 8.3 Control Quality -> Output->Validated changes Validated changes Changed or repaired product, based on approved CR, are validated in Control Quality process. This is done using Review Approved Change Requests technique. The change or repaired done is either validated or rejected. This information is further used in Monitor & control project work. Integrated Change Control -> Approved Change Request Quality Control -> Approved CR review tool Validated changes Monitor & Control project work 8.3 I T&T O
  • 127. By: Anand Bobade (nmbobade@gmail.com) Quality control measurements Control Quality Measurements are the results of Control Quality process. These are input to Perform Quality Assurance process Examples: No. of test cases executed No. of test cases passed No. of text failed No. of open defects No. of closed defects 8.3 Control Quality->Output->Quality Control measure Inspection -> Software testing (SIT) -> Construction quality test 8.3 I T&T O
  • 128. By: Anand Bobade (nmbobade@gmail.com) Work performance information WPI is performance related data that is output to many monitoring and controlling processes This is used in Monitor & control project work for further analysis. WPI will show: Projects achievement against requirements. Information about rejections. Reasons for the rejections. Rework required. Need for change in quality processes. 8.3 Control Quality->Output->WPI 8.3 I T&T O
  • 129. By: Anand Bobade (nmbobade@gmail.com) 8.3 Control Quality -> Output Change requests in the form of rework, repair, change to management plan etc are made. Quality Management Plan, and Process Improvement Plans might be updated Agreements, quality audit documents, training plans and their assessment, process documentation Completed Checklists: Documented checklist becomes part of project document Lesson Learned Doc: Causes of variances, Reasoning behind corrective action 8.3 I T&T O
  • 130. By: Anand Bobade (nmbobade@gmail.com) Quality Control Vs Verify Scope Control Quality (monitoring & controlling) • Performed internally during project execution • Ensure that product is defect free & all parameters are within acceptable limits set in the quality control plan. • Performed by quality control engineer with project team. Validate Scope (monitoring & controlling) • Performed with the client at the end of the project • Verify if product is complete, all requirements are met, & product is ready for client acceptance. • Objective is to get a formal acceptance from client. • Can be performed far before project ends; can be done with perform quality control process. 8.3 I T&T O
  • 131. By: Anand Bobade (nmbobade@gmail.com) Quality Assurance Vs Quality Control Quality Assurance: • Process of auditing quality requirements & results from quality control measurements to ensure that appropriate quality standards & operational definitions are used. Quality Control: • Process of monitoring & recording results of executing quality activities to assess performance & recommend necessary changes. 8.3 I T&T O
  • 132. By: Anand Bobade (nmbobade@gmail.com) 8.3 Control Quality -> Data Flow Diagram 8.3 I T&T O
  • 133. By: Anand Bobade (nmbobade@gmail.com) Self Assessment C. The defined requirements of the customers are fulfilled. Quality is achieved when ___ a. We exceed customer’s every expectation. b. We exceed customer’s expectation is some way or other. c. The defined requirements of the customers are fulfilled. d. The number of benefits far outweighs the number of defects. 8.3 I T&T O
  • 134. By: Anand Bobade (nmbobade@gmail.com) Self Assessment d. The Senior Management In the end, Quality is the responsibility of a. The Customer b. The Project Manager c. The Team Members d. The Senior Management 8.3 I T&T O
  • 135. By: Anand Bobade (nmbobade@gmail.com) Review!! 8.1 Plan Quality Management: 8.2 Perform Quality Assurance: 8.3: Control Quality: Cost-benefit analysis Cost of quality Seven basic quality tools Benchmarking Design of experiments Statistical sampling Additional quality planning tools Meetings Cause-and- Effect Flowcharts Check-sheet Pareto Diagram Histograms Control Charts Scatter Diagram Quality control measureme nts Validated changes Verified deliverables Work performanc e information Quality Management Plan Process Improvement Plan Quality Metrics 8.3 I T&T O
  • 136. By: Anand Bobade (nmbobade@gmail.com) Learn Project Management & prepare for PMP exam: • Learn visually • Detailed coverage of all PMP concepts • Sample Questions
  • 137. By: Anand Bobade (nmbobade@gmail.com) Thank You! To Learn Project Management, Contact Anand Bobade (055 5932004) •nmbobade@gmail.com •https://ae.linkedin.com/in/anandbobade •http://www.slideshare.net/anandbobade •Conduct Online training, Corporate Training, evening & weekend workshops. Free learning resources on slide share