Final report on Ethnocentrism
•
4 j'aime•3,735 vues

A study done to access the Ethnocentrism of Indian customers regarding purchase of high involvement and low involvement goods (Bangalore region)

Recommandé
Contenu connexe
Tendances
Tendances (20)
En vedette
En vedette (13)
Similaire à Final report on Ethnocentrism
Similaire à Final report on Ethnocentrism (20)
Dernier
Dernier (20)
Final report on Ethnocentrism
- 1. 1.1 GENESIS OF THE PROBLEM Ethnocentrism is the tendency to look at the world primarily from the perspective of one's own ethnic culture. The concept of ethnocentrism has proven significant in the social sciences, both with respect to the issue of whether the ethnocentric bias of researchers colours the data they obtain, and the findings from research in anthropology and sociology. Such research has revealed ethnocentrism in every culture around the world, based on a number reasons, including religion, language, customs, culture, and shared history. It seems natural that people feel pride in the culture in which they have grown up and from which they have adopted their values and standards of behaviour. However, the problem is that one may view other cultures not only as different, but also as inferior, with a great danger of behaving in ways that are damaging to those from other cultures. However, as increasing globalization brings different cultures together, people are learning to overcome their self-centred thinking and see human society from a broader, more inclusive perspective. 1.2 MAJOR CONCEPTS Ethnocentrism is a lens through which people examine other cultures. A person may compare the morals, ethics, history, and religion of another country to their own, and decide that their own nation's practices are superior. This is the formation of an ethnocentric thought process. The opposite to this idea is "cultural relativism," the idea of viewing another culture with no preconceived notions or judgments. Ethnocentrism establishes the ideas of a "proper" living, and that these other countries in comparison do not measure up to the "proper" way of living. Ethnocentrism can be seen as the backbone of stereotypes. Ideas such as the work ethic of a particular culture, or lack of morals in another culture, stem from the idea in ethnocentrism that one's own culture is above a foreign culture in many regards. The scope of ethnocentrism can also be held responsible for instigating racism in different societies. Ethnocentric perspectives are not merely limited to different nations, indeed different races
- 2. in the same society often look at other races from an ethnocentric point of view. The evolution of globalization can lead to a decrease in ethnocentric evaluations. With the world becoming more connected, and with people having greater access to information than at any other time, it is possible to dispel many cultural myths in coming generations, fostering a better universal understanding of how different cultures function and maintain themselves. Indeed, ethnocentrism is not a problem that needs to be around forever. Shimp and Sharma (1987) developed consumer ethnocentrism into a measurable construct through the use of the consumer ethnocentric tendencies scale (CETSCALE). The initial development of the CETSCALE began with 225 different questions, which were narrowed down to 100 before being sent to a survey group for the first purification study. Through repeated purification studies, the number of questions was finally reduced to 17. Repeated studies by Shimp and Sharma validated the CETSCALE in the U.S. While the 17- item CETSCALE is the original version developed by Shimp and Sharma (1987), shortened versions have been used. One, with 10 items, was developed alongside the full version. Both the 17-item version and the 10-item version were tested. It was found that both versions of the CETSCALE were reliable across the different cultures where it was tested. The results also helped validate the CETCSCALE as a measure of consumer ethnocentricity. Since that time, the CETSCALE has been used in many studies in many different countries and cultures. 1.3 NEED FOR THE STUDY The motivation for this study is to examine the gaps left by the literature reviews done. Earlier studies indicated the use of CETSCALE to measure Ethnocentrism in various sectors in many parts of the world but when compared in India there seems to be some kind of lagging in this and hence analysis is done for finding its effect on market penetration prospects and what drives the customers for purchase decision. . 2
- 3. 1.4 OVERVIEW OF THE STUDY The present study focuses only on the ethnocentric behaviour of people residing in Bangalore into categories like Automobiles and FMCG. A predefined CETSCALE is used as the basic tool and results are analysed accordingly. 1.5 CHAPTERIZATION The dissertation is organised into six chapters. Following the introductory chapter, Chapter 2 provides the review of literature which consists of research done by different researchers on effect of disclosures on stock returns. Chapter 3 deals with the research methodology. Chapter 4 gives us the overview about the industry and the analysis of the industry as a whole. In Chapter 5 the data analysis is done which would give quantitative figures to the questions which have to be addressed in the thesis. Finally Chapter 6 is outlined with the findings, conclusion and suggestions for the future research. 3
- 4. 2.1 INTRODUCTION Review of literature involves study of existing papers, which have been published by various scholars across the globe, with variables suiting their geography of study. It helps to indicate the researches that have been done over the years on online banking and information security issues. Technology is constantly on the pace of development. In the same way the factors that determine the adoption of internet banking influencing customers have also changed and evolved. The review of literature helps in identifying what are the different areas that have been studied in relation to online banking and information security. The technology aspect, the security aspect, the perceived usefulness, the financial risk, the operational risk, the process clarity and simplicity have all been studied. Therefore the review of literature is very important to help us identify the various factors that influence customers‟ perception towards adoption of various security measures in online banking. These factors can then be used to relate to studies and measures taken in banks towards these security issues. 2.2 IMPORTANCE OF REVIEW LITERATURE Literature review actually helps in clarifying the problem tried to be solved through the dissertation process. It helps in identification of the various variables based on which the research hypothesis have to be framed. It also provides clarity on how to go about the entire dissertation process. It also helps in defining the sample, framing the questionnaire and using statistical tools in some cases. It mostly helps in knowing the research gap between, what research has been done so far on the topic and what can be done to do the review of literature first the research paper is selected in accordance with the topic of research. Once the research papers are selected, the problem statement and objective of the research paper are identified. After identifying the objective of the research, the tools used and the methodology used is identified. In the process of doing a literature review, we must see its relevance. At last the conclusion and the limitation of the research are identified to fill this gap. 4
- 5. The development of the literature review has been done in 4 stages: Problem formulation: which topic or field is being examined and what are its component issues? Literature search: finding materials relevant to the subject being explored Data evaluation: determining which literature makes a significant contribution to the understanding of the topic Analysis and interpretation: discussing the findings and conclusions of pertinent literature. 2.3 REVIEWS DONE Bellizzi, Hamilton, Krueckeberg and Martin (1981) conducted a study titled Consumer perceptions of National, Private and Generic brands which investigated consumer perception and revealed that consumer perceive many differences among the three product types. Discriminant analysis was used to determine how well behavioural scales predict brand ratings. Ho (1998) in his study of The effects of Individualism-Collectivism on brainstorming: a comparison of Canadian and Taiwanese samples tests the general hypothesis and finds out the culture differences. Alden, Batra, Ramachander, Ramaswamy and Steenkamp (2000) in their study Effects of Brand Local and Nonlocal Origin on Consumer Attitudes in Developing Countries tested whether, among consumers in developing countries, brands perceived as having a nonlocal country of origin, especially from the West, are attitudinally preferred to brands seen as local, for reasons not only of perceived quality but also of social status. They found that this perceived brand non-localness effect was greater for consumers who have a greater admiration for lifestyles in economically developed countries, which is consistent with findings from the cultural anthropology literature. The effect was also found to be stronger for consumers who were high in susceptibility to normative influence and for product categories high in social signaling value. 5
- 6. This effect was also moderated by product category familiarity, but not by consumer ethnocentrism. The results suggested that in developing countries, a brand's country of origin not only serves as a "quality halo" or summary of product quality (cf. Han, 1989), but also possesses a dimension of non- localness that, among some consumers and for some product categories, contributes to attitudinal liking for status-enhancing reasons. Bandyopadhyay (2001) in his study Competitiveness of foreign products as perceived by consumers in the emerging Indian market compares the electronics and electrical products from United States, Japan, South Korea, Germany, Britain and India by means of an empirical study on various product attributes and gives the result along with its future implications. Dixon, Hattie and Shulruf (2003) in their study about Development of a New Measurement Tool for Individualism and Collectivism establish a reliable and easy to use measurement tool for collectivism and individualism, which avoids weaknesses of previous tools. In particular the new tool attempts to avoid the „cultural deprivation‟ bias and the confounding influence of familialism as well as to include the vertical and horizontal dimensions of collectivism and individualism in a more practical way. Bawa (2004) in his study Consumer Ethnocentrism: CETSCALE Validation and Measurement of Extent examined the psychometrics of the CETSCALE, the extent of consumer ethnocentrism in India, and the relationship of socio-demographic variables and quality consciousness with consumer ethnocentrism. Borja, Descals, Eckman and Hyllegard (2005) in their research titled Spanish consumers' perceptions of US apparel speciality retailers' products and services examined consumers' store patronage and apparel purchase behavior, acceptance of US apparel brands, perceptions of retailers' products and services, and perceptions of the impact of foreign retailers on local communities. Data was collected from 375 consumers in Barcelona, Madrid and Valencia. The influence of retailer characteristics on consumers' 6
- 7. store patronage varied by age and income. Product characteristics that influenced apparel purchases varied by gender, income and age, while acceptance of US brands differed by gender and age. The perceptions of Spanish, European and US retailers differed regarding quality, fashionability, product assortment, extent and quality of customer service, convenience of location, payment options, national brands and store layout. Consumers' acceptance of US apparel brands was a function of age, household income, apparel product country of manufacture and price. Perceptions of US retailers were a function of household income, selected apparel characteristics and consumer acceptance of US apparel brands. Differences among perceptions of the impact of retail development were found by city. The findings provide insights into the opportunities and challenges for US apparel speciality retailers as they contemplate entry into the Spanish market. The affinity for US apparel among young Spanish consumers, particularly males, suggests optimism regarding opportunities in this market. Nowak (2011) in his master thesis titled Trends in consumer behavior on the Polish market. Consumer ethnocentrism, Country-of-origin effect, national and foreign brands aims to evaluate the level of consumer ethnocentrism against socio-demographic variables such as age, gender and education level of respondents. Furthermore, the study attempts to assess consumer ethnocentrism impact on evaluation of domestic and foreign food products among Polish consumers. Mohamad, Ramayah and Teo (2011) in their study Testing the dimensionality of Consumer Ethnocentrism Scale (CETSCALE) among a young Malaysian consumer market segment test the dimensionality of the Consumer Ethnocentrism Scale (CETSCALE). Their research assessed a two dimensionality, namely uni-dimensional and two dimension measure, of CETSCALE in order to determine which one is better in explaining consumers‟ perceptions towards domestic brands in the Malaysian context. Their findings show support for the 2 component model that was proposed with good reliability values and validity assessment. 7
- 8. Kongsompong and Powtong (2012) in their study titled Collectivism and Ethnocentrism: an inter and intra national analysis among the Thais, Chinese and Indians presents empirical results of ethnocentrism in relation to the collectivist strength among subjects in three countries: Thailand, China, and India. The inter-national analysis on the subjects attempts to diagnose and contrast the cultural diversity between the people of the three countries. As for the intra-national analysis, the men and women within the countries are separately examined to analyze the cultural differences. Results show that Thais, Chinese, and Indians are significantly diverse on the realm of collectivist and ethnocentric strengths. Regardless of the nationalities those who are more collectivist show the tendency to be more ethnocentric in their consumption behavior. In contrary to the prediction from the literature review, however, the intra-national results for subjects of the three countries show that men are generally more collectivist than women. Therefore, the Thai, Chinese, and Indian men are likely to be more ethnocentric with their purchase endeavors than their counterparts. 2.4 CONCLUSION The review of literature thus tells us about the other similar thesis published earlier and makes us aware about the problems and better understanding of the methodology and how we can approach to the solutions reduce the gap. 8
- 9. 3.1 INTRODUCTION Research is the journey from known to unknown or from problem to solution. Research methodology refers to the design of the study method and processes by which data is gathered for a research project. It is also important in a research work because it also specifies the sampling design. The researcher also defines the target population and the sampling method used. Additionally, the researcher identifies the data collection method. This could be questionnaires, surveys, or interviews. The researcher identifies significant methodology such as sampling errors, response and constraints of cost and time. Finally, the chapter examines the different statistical tests used to analyze the gathered data, the reliability, and the validity of the results. 3.2 STATEMENT OF THE PROBLEM The problem is understanding how “perceived” product foreignness equates to in-group/out-group inclusion and ultimately influences attitudes toward products purchase and usage. 3.3 VARIABLES OF THE STUDY The variables considered are value for money, reliability, quality, technicality and ethnocentric sum. 3.4 OBJECTIVES OF THE STUDY The objectives of the study are: 1. To study the level of ethnocentrism among the people in Bangalore. 2. To find out what drives the customers for purchase decision irrespective of its country of origin. 3.5 HYPOTHESES The hypotheses include: Hypothesis 1 H01: Indian consumers are ethnocentric 9
- 10. Ha1: Indian consumers are not ethnocentric. Hypothesis 2 H02: The product attributes are not important for purchase decision irrespective of ethnocentrism of the consumers. Ha2: The product attributes are important for purchase decision irrespective of ethnocentrism of the consumers. 3.6 SAMPLING PROCEDURE For the present study, primary data was collected through a structured questionnaire among the people of Bangalore. a field study is mainly used but online support is also taken. As per the procedure "random sampling" is used for collecting data. 3.7 EXPLANATION OF THE INPUTS Value for Money The measure how the product delivers its value depending the price paid and its brand equity mainly for consumers. It's a product attribute. Reliability Reliability defines how well the product can be trusted upon and how well it performs as per expectations. It is also a product attribute. Quality This defines how well the product is as per the customers satisfaction. It measures the efficiency of the product, It is also an attribute. Technicality This deals with the features and recent developments needed. Ethnocentric Sum The summation of each individual on a 7 point scale as per the questionnaire. 10
- 11. 3.8 STATISTICAL TOOLS The main statistical tools used are: Descriptive Statistics Hypothesis Testing Cluster Analysis. 3.9 CONCLUSION The research methodology thus makes us aware about the process and methodology used in the study and thus provides the reader to analyse the given problem and how we can approach the given problems. 11
- 12. 4.1 AUTOMOBILE MARKET IN INDIA The automobile industry, one of the core sectors, has undergone metamorphosis with the advent of new business and manufacturing practices in the light of liberalization and globalization. The sector seems to be optimistic of posting strong sales in the couple of years in the view of a reasonable surge in demand. The Indian automobile market is gearing towards international standards to meet the needs of the global automobile giants and become a global hub. Indian Auto Industry is the Largest Three Wheeler Market in the World Second largest Two Wheeler Market in the World Fourth largest Passenger Vehicle Market in Asia Fourth largest Tractor Market in the World Fifth largest Commercial Vehicle Market in the World 4.2 DIFFERENT ASPECTS OF AUTOMOBILE INDUSTRY 4.2.1 PRODUCTION The cumulative production data for April-March 2012 shows production growth of 13.83 percent over same period last year. In March 2012 as compared to March 2011, production grew at a single digit rate of 6.83 percent. In 2011-12, the industry produced 20,366,432 vehicles of which share of two wheelers, passenger vehicles, three wheelers and commercial vehicles were 76 percent, 15 percent, 4 percent and 4 percent respectively. 4.2.2 DOMESTIC SALES The growth rate for overall domestic sales for 2011-12 was 12.24 percent amounting to 17,376,624 vehicles. In the month of only March 2012, domestic sales grew at a rate of 10.11 percent as compared to March 2011. Passenger Vehicles segment grew at 4.66 percent during April-March 2012 over same period last year. Passenger Cars grew by 2.19 percent, Utility Vehicles grew by 16.47 percent and Vans by 10.01 percent during this period. In March 12
- 13. 2012, domestic sales of Passenger Cars grew by 19.66 percent over the same month last year. Also, sales growth of total passenger vehicle in the month of March 2012 was at 20.59 percent (as compared to March 2011). For the first time in history car sales crossed two million in a financial year. The overall Commercial Vehicles segment registered growth of 18.20 percent during April-March 2012 as compared to the same period last year. While Medium & Heavy Commercial Vehicles (M&HCVs) registered a growth of 7.94 percent, Light Commercial Vehicles grew at 27.36 percent. In only March 2012, commercial vehicle sales registered a growth of 14.82 percent over March 2011. Three Wheelers sales recorded a decline of (-) 2.43 percent in April-March 2012 over same period last year. While Goods Carriers grew by 6.31 percent during April-March 2012, Passenger Carriers registered decline by (-) 4.50 percent. In March 2012, total Three Wheelers sales declined by (-) 9.11 percent over March 2011. Total Two Wheelers sales registered a growth of 14.16 percent during April- March 2012. Mopeds, Motorcycles and Scooters grew by 11.39 percent, 12.01 percent and 24.55 percent respectively. If we compare sales figures of March 2012 to March 2011, the growth for two wheelers was 8.27 percent. 4.2.3 EXPORTS During April-March 2012, the industry exported 2,910,055 automobiles registering a growth of 25.44 percent. Passenger Vehicles registered growth at 14.18 percent in this period. Commercial Vehicles, Three Wheelers and Two Wheelers segments recorded growth of 25.15 percent, 34.41 percent and 27.13 percent respectively during April-March 2012. For the first time in history car exports crossed half a million in a financial year. In March 2012 compared to March 2011, overall automobile exports registered a growth of 17.81 percent. 13
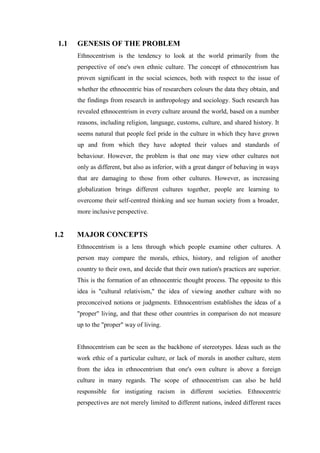
- 14. Figure 4.1: Automobile's Market Share Source: Secondary Data(SIAM website) 4.3 FMCG MARKET IN INDIA Fast-moving consumer goods (FMCGs) are products that are sold quickly at a relatively low cost. They are popularly referred to as consumer packaged goods. The most common things in the list are toilet soaps, detergents, shampoos, toothpastes, shaving products, shoe polish, packaged foodstuff and household accessories. The term even extends to certain electronic goods. These items are meant for daily or frequent consumption. A major portion of the monthly budget of each household is reserved for FMCG products. The volume of money circulated in the economy due to FMCG products is very high, as the number of consumers for such products is very high. The Indian FMCG industry began to shape during the last 50-odd years. The FMCG sector is a cornerstone of the Indian economy, touching every aspect of human life. The Indian FMCG market is divided between the organised sector and the unorganised sector. 4.4 DIFFERENT COMPONENTS OF THE FMCG MARKET 4.4.1 HOUSEHOLD CARE Household care products include bath soaps and detergents. The market size for soaps is estimated at Rs 83 billion, comprising the premium, economy and popular. The penetration level of soaps is 92 per cent. They are available in 5 million retail stores, of which 75 per cent are in the rural areas. Hindustan Unilever Limited (HUL) is the leader with a market share of 53 per cent; Godrej 14
- 15. occupies second position with a market share of 10 per cent. With increase in disposable incomes, rural demand is expected to increase because consumers are moving up towards premium products. The size of the detergent market is estimated at Rs 120 billion. Small unorganised players account for a major share of the detergent market. In washing powders, HUL is the leading company with 38 per cent of the market share. Other major players are Nirma, Henkel, and Proctor & Gamble. 4.4.2 PERSONAL CARE Personal care products include skin care, hair care and oral care products. The total skin care market is estimated at Rs 34 billion. This market is at a nascent stage in India. The penetration level of this segment in India is around 20 per cent. With changing lifestyles, increase in disposable incomes, greater product choice and availability, people are becoming more aware about personal grooming. Major players in this segment are HUL with a market share of 54 per cent, followed by CavinKare with a market share of 12 per cent, and Godrej with a market share of 3 percent. The hair care market in India is estimated at Rs 38 billion, including hair oils, shampoos, hair colourants, conditioners and hair gels. Marico is leader in hair oil segment with a market share of 33 per cent; Dabur occupies second position at 17 percent. The Indian shampoo market is estimated at Rs 27 billion. It has a penetration level of only 13 per cent. Sachets make up 40 per cent of the total shampoo sales. It has a low penetration level even in metros. Again, the market is dominated by HUL with around 47 per cent of market share; P&G occupies second position with a market share of around 23 per cent. The oral care market can be segmented into toothpastes (60 per cent), toothpowder (23 per cent) and toothbrushes (17 per cent). The total toothpaste market is estimated at Rs 35 billion. The penetration level of toothpowder and toothpaste in urban areas is three times that of rural areas. This segment is dominated by Colgate-Palmolive with a market share of 49 per cent, while HUL 15
- 16. occupies second position with a market share of 30 per cent. In the toothpowder market, Colgate and Dabur are major players. 4.4.3 FOOD AND BEVERAGES The food category in FMCG is gaining popularity with a string of launches by HUL, ITC, Godrej and others. This category has 18 major brands aggregating 46 billion. Nestle and Amul slug it out in the milk powder segment. The food category has also seen innovations like softies in ice creams, ready-to-eat rice by HUL, and pizzas by Godrej Pillsbury. The tea market is dominated by unorganised players, who control over 50 per cent of the market. The leading branded tea players are HUL and Tata Tea. More than 50 per cent of the market is dominated by loose, unbranded coffee. Major players in this segment are Nestlé, HUL and Tata Coffee. 4.5 SWOT ANALYSIS Figure 4.2: Indian Automobile Industry SWOT . Source: Secondary Data 16
- 17. The above picture gives us a clear idea about the strength, weakness, opportunity and threat of Indian automobile industry. Figure 4.3: Indian FMCG Industry SWOT Source: Secondary Data The above picture gives us a clear idea about the strength, weakness, opportunity and threat of Indian FMCG industry. 17
- 18. 5.1 INTRODUCTION In the background of the methodology of the study outlined in chapter 3 and the ideas gained from previous literature reviews along with the data collected, this chapter consists of finding and analyzing forward looking words and testing the hypothesis using statistical tools in the later part. 5.2 DESCRIPTIVE ANALYSIS For the present study, primary data was used from the questionnaire and then it was coded in MS-EXCEL as per the software understanding capability with final analysis done using XL-STAT. Table 5.1: Data Summary Summary Statistics: Obs. Obs. with without missing missing Std. Variable Observations data data Minimum Maximum Mean deviation Gender 109 0 109 1.000 2.000 1.376 0.487 Occupation 109 0 109 1.000 5.000 1.862 1.014 V1 109 0 109 4.000 7.000 5.688 0.604 V2 109 0 109 4.000 5.000 4.275 0.449 V3 109 0 109 3.000 5.000 3.661 0.531 V4 109 0 109 4.000 6.000 5.220 0.497 V5 109 0 109 5.000 6.000 5.468 0.501 V6 109 0 109 5.000 6.000 5.734 0.444 V7 109 0 109 4.000 5.000 4.523 0.502 V8 109 0 109 4.000 5.000 4.220 0.416 V9 109 0 109 6.000 7.000 6.229 0.422 V10 109 0 109 2.000 4.000 2.807 0.518 Value for Money 109 0 109 5.000 6.000 5.514 0.502 Technicality 109 0 109 5.000 6.000 5.468 0.501 Quality 109 0 109 5.000 7.000 5.917 0.337 Reliability 109 0 109 5.000 6.000 5.651 0.479 Source: Primary Data on XLSTAT The above table gives the total data collected and also the variables used for the study. It also gives the mean for each variable and the standard deviation in each. The variables V1 to V10 are all the part of the modified CETSCALE and named so as per writing convenience. 18
- 19. Ethnocentric Sum Table 5.2: Ethnocentrism Display Obs. Obs. with without missing missing Std. Variable Observations data data Minimum Maximum Mean deviation Sum 109 0 109 44.000 53.000 47.817 1.695 Source: Primary Data on XLSTAT Figure 5.1: Ethnocentrism Display Histogram (Sum) 0.25 0.2 Relative frequency 0.15 0.1 0.05 0 44 46 48 50 52 54 Sum Source: Primary Data on XLSTAT The above table and figure gives us idea about the range of the ethnocentric sum and the number of people fall in the range of the 7 point rating scale. the mean being 47.817 which indicates the people in Bangalore are slightly ethnocentric in nature when comes to purchase decision making. The ethnocentric sum is calculated based on the modified 10 point CETSCALE(adapted from Shimp and Sharma,1987 17-point CETSCALE). 19
- 20. 5.3 HYPOTHESES TESTING Test 1 Table 5.3: Test for Value for Money Obs. Obs. with without missing missing Std. Variable Observations data data Minimum Maximum Mean deviation Value for Money 109 0 109 5.000 6.000 5.514 0.502 Difference 0.514 z (Observed value) 10.682 |z| (Critical value) 1.960 p-value (Two-tailed) < 0.0001 alpha 0.05 Source: Primary Data on XLSTAT In decision making the Value for Money plays an important part and the alternate hypothesis acceptance proves its importance, depending on the result obtained from the z-test done and the data collected. Test 2 Table 5.4: Test for Technicality Obs. Obs. with without missing missing Std. Variable Observations data data Minimum Maximum Mean deviation Technicality 109 0 109 5.000 6.000 5.468 0.501 Difference 0.468 z (Observed value) 9.745 |z| (Critical value) 1.960 p-value (Two-tailed) < 0.0001 alpha 0.05 Source: Primary Data on XLSTAT In decision making Technicality plays an important part and the alternate hypothesis acceptance proves its importance, depending on the result obtained from the z-test done and the data collected. 20
- 21. Test 3 Table 5.5: Test for Quality Obs. Obs. withou with t Std. Variabl Observation missin missin Minimu Maximu Mea deviatio e s g data g data m m n n Quality 109 0 109 5.000 7.000 5.917 0.337 Difference 0.917 z (Observed value) 28.432 |z| (Critical value) 1.960 p-value (Two-tailed) < 0.0001 alpha 0.05 Source: Primary Data on XLSTAT In decision making Quality also plays an important part and the alternate hypothesis acceptance proves its importance, depending on the result obtained from the z-test done and the data collected. Test 4 Table 5.6: Test for Reliability Obs. Obs. with without missing missing Std. Variable Observations data data Minimum Maximum Mean deviation Reliability 109 0 109 5.000 6.000 5.651 0.479 Difference 0.651 z (Observed value) 14.205 |z| (Critical value) 1.960 p-value (Two-tailed) < 0.0001 alpha 0.05 Source: Primary Data on XLSTAT In decision making the Reliability factor also plays an important part and the alternate hypothesis acceptance proves its importance, depending on the result obtained from the z-test done and the data collected. 21
- 22. All the above four tests are about the attributes which influence purchase decision making and from the results obtained it can be seen that more than the country of origin and culture relation, the purchase decision is made depending on the attributes and the ethnocentrism factor hardly effects the buying process in Automobiles(two and four wheelers) and FMCG. Test 5 Table 5.7: Test for Ethnocentrism Obs. Obs. with without missing missing Std. Variable Observations data data Minimum Maximum Mean deviation Sum 109 0 109 44.000 53.000 47.817 1.695 Difference -0.183 z (Observed value) -1.130 |z| (Critical value) 1.960 p-value (Two-tailed) 0.258 alpha 0.05 Source: Primary Data on XLSTAT From the test run and the result obtained the null hypothesis cannot be rejected which proves that Indians are ethnocentric in nature when it comes to choosing and making decisions but the mean value obtained is 47.817 which states that only slightly ethnocentric in nature. 22
- 23. 5.4 CLUSTER ANALYSIS Analysis 1 Table 5.8: Cluster Analysis 1 Results by class: Class 1 2 3 4 Objects 4 2 1 3 Sum of weights 4 2 1 3 Within-class variance 31.333 150.500 0.000 51.667 Minimum distance to centroid 3.536 8.675 0.000 3.902 Average distance to centroid 4.773 8.675 0.000 5.711 Maximum distance to centroid 5.874 8.675 0.000 7.157 V1 V2 V3 V4 V5 V10 V7 V6 V8 V9 Source: Primary Data on XLSTAT The total variables in the 10 point CETSCALE is divided into 4 clusters showing similar properties and behaviour. the above cluster division is results as per class division and gives us the variable division. Class 1 has V1,V5,V6 and V9. Class 2 has V2 and V10. Class 3 has only V3. Finally, Class 4 has V4, V7 and V8. Analysis 2 Table 5.9: Cluster Analysis 2 Results by object: Observation Class Distance to centroid V1 1 4.583 V2 2 8.675 V3 3 0.000 V4 4 7.157 V5 1 5.099 V6 1 3.536 V7 4 3.902 V8 4 6.074 V9 1 5.874 V10 2 8.675 Source: Primary Data on XLSTAT 23
- 24. Again dividing the variables in the CETSCALE into 4 groups the above table is obtained and the here the clustering basis is distance to the centroid. V1, V5, V6 and V9 fall into Cluster 1. V2 and V10 fall into Cluster 2. V3 is the single variable in Cluster 3. V4, V7 and V8 are in Cluster 4. 5.5 CONCLUSION Based on the primary data analysis it can be concluded that Indian consumers are just slightly ethnocentric in nature from the hypothesis test number 5 and the product attributes like Value for Money, Technicality, Quality and Reliability has an impact on the purchase and decision making process can be proved from the hypothesis test number 1 to 4. The cluster analysis groups the variables into four main groups depending on class and object and the results obtained from their k-means cluster analysis. 24
- 25. 6.1 FINDINGS The success of research depends on its findings, the findings of the present study are: The descriptive studies indicate that gender and occupation does have an impact on the purchase decision and ethnocentrism level of people. The hypotheses test proves that product attributes are important and ethnocentrism just slightly impacts the decision making. The better the attributes the more the chance of product/service success. The efficient and effective products/ services sell. Self-culture belief needs to be respected. The descriptive study shows the ethnocentric mean to be 47.817 out of 70 which makes the customers to exhibit some level of ethnocentrism but not that strong enough. The level of ethnocentrism and product attributes when taken together, the better the attributes the product sells irrespective of its origin and customers Motherland association. The most important attribute being the Quality of the product/service followed by Reliability, then comes Value for Money and finally Technicality. The marketers are at times unsure about the psychographic segmentation. 6.2 CONCLUSION From the present study, which was conducted on Indians to check the effect of ethnocentrism on the purchase of high involvement product(two and four wheelers) and low involvement goods(fast moving consumer goods), it is observed that in Indians there is no high level of ethnocentrism which effects the purchase decision making rather it's the product attributes that makes the product acceptable among the people. 25
- 26. 6.3 SUGGESTIONS Level of ethnocentrism should be found out for each category of product to estimate its acceptance in the Indian market. Product features and its advantages and benefits should be laid stress upon for the product/ service to be successful. Culture and self-belief of all the communities in India should be respected by all the foreign companies. 6.4 SCOPE FOR FUTURE STUDY The present study deals only with two product categories, i.e. automobiles and FMCG and finding of ethnocentrism among the consumers. The further study needs to be done on other categories of high involvement and low involvement goods. The further study needs to be done on how we can develop a better model to find out ethnocentrism and make the research in a large population in various geographical regions. 6.5 LIMITATIONS The main limitations of the study was that it was carried out only at Bangalore region and also in two product categories for determining the ethnocentrism among Indian consumers. The other limitation being absence of only Indian manufacturing companies in the categories making people go for foreign brands and being habituated using that which does not give a valid ethnocentric score. Most companies present are either joint ventures or acquisitions or franchises running which is a major limitation for the study. 26
- 27. BIBLOGRAPHY Academy, T., Science, M., & Complete, I. (2006). Consumer Ethnocentrism Offline and Online : The Mediating Role of Marketing Efforts and Personalit ... Batra, R., Ramaswamy, V., Alden, D. L., Steenkamp, J.-B. E. M., & Ramachander, S. (2000). Effects of Brand Local and Nonlocal Origin on Consumer Attitudes in Developing Countries. Journal of Consumer Psychology, 9(2), 83–95. Retrieved from http://linkinghub.elsevier.com/retrieve/pii/S1057740800703287 Bawa, A. (2004). Consumer Ethnocentrism: CETSCALE Validation and Measurement of Extent, 29(3), 43–57. Huang, Y.-A., Phau, I., Lin, C., Chung, H.-J., & Lin, K. H.-C. (2008). Allocentrism and consumer ethnocentrism: The effects of social identity on purchase intention. Social Behavior and Personality an international journal, 36(8), 1097–1110. Retrieved from http://openurl.ingenta.com/content/xref?genre=article&issn=0301- 2212&volume=36&issue=8&spage=1097 Hyllegard, K., Eckman, M., Descals, A. M., & Borja, M. A. G. (2005). Spanish consumers‟ perceptions of US apparel speciality retailers' products and services. Journal of Consumer Behaviour, 4(5), 345–362. Retrieved from http://doi.wiley.com/10.1002/cb.18 Jan, F. A. (n.d.). Country-of-Origin Effect on Consumer Purchase Decision of Durable Goods in Pakistan. Jin, Z., & Chansarkar, B. (2010). Brand origin in an emerging market: perceptions of Indian consumers. Asia Pacific Journal of Marketing and Logistics, 18(4), 283– 302. doi:10.1108/13555850610703254 Lee, H.-J., Kumar, A., & Kim, Y.-K. (2010). Indian consumers‟ brand equity toward a US and local apparel brand. Journal of Fashion Marketing and Management, 14(3), 469–485. doi:10.1108/13612021011061898 Lee, L. (2009). Consumer receptivity of foreign products : The roles of country-of- origin image , consumer ethnocen ... Reardon, J. (2012). COMPARISON OF CONSUMER ETHNOCENTRISM BEHAVIOURAL PATTERNS IN TRANSITIONAL Donata Vianelli , PhD , Professor of Marketing at the University of James Reardon , PhD , Wells Fargo Professor of Marketing at the, 11(2), 20–35. Rhiney, E. (2011). Consumer ethnocentrism: The effects of threat, foreignness and heritage brands. ProQuest Dissertations and Theses, 168. Shulruf, B., Hattie, J., & Dixon, R. (2007). Development of a New Measurement Tool for Individualism and Collectivism. Journal of Psychoeducational Assessment, 27
- 28. 25(4), 385–401. Retrieved from http://jpa.sagepub.com/cgi/doi/10.1177/0734282906298992 Spillan, J. E. (2012). Chilean Consumers Ethnocentrism Factors and Their Perception Regarding Foreign Countries Products, 6(1), 34–56. Teo, P., Mohamad, O., & Ramayah, T. (2011). Testing the dimensionality of Consumer Ethnocentrism Scale ( CETSCALE ) among a young Malaysian consumer market segment, 5(7), 2805–2816. doi:10.5897/AJBM10.1185 Trends in consumer behavior on the Polish market . Consumer ethnocentrism , Country- of-origin effect , national and foreign brands. (2011)., (June). 28