Agiles 2015 - Lean Visual Strategy - 22Oct15

Many organisations are interested in using the proven techniques presented in the Lean Startup methodology. However, most medium to large organisations have to report to stakeholders or stock exchanges and therefore require clear governance procedures. In the past this involved creating extensive business cases and financial models which inevitably took months (or years) to produce. Lean Startup clearly represents a much faster and better way to work. But how can we provide company executive and boards with the information they need to govern their organisation properly? This presentation presents visualisation tools that were developed in real-world circumstances to transform a corporate environment to run in a Lean Startup manner. We will focus in particular on how to distil and disseminate data into information that both product teams and executives can use to fast-track products to market.

Recommandé
Contenu connexe
Tendances
Tendances (20)
En vedette
En vedette (16)
Similaire à Agiles 2015 - Lean Visual Strategy - 22Oct15
Similaire à Agiles 2015 - Lean Visual Strategy - 22Oct15 (20)
Dernier
Dernier (20)
Agiles 2015 - Lean Visual Strategy - 22Oct15
- 1. Lean Visual Strategy Cheryl Quirion @cherylquirion
- 2. Lean Startup Business Planning? No one reads this! Problem Solution Key metrics Unique value proposition Unfair advantage Customer Segments Channels Cost Structure Revenue Streams top 3 problems top 3 features (MVP that demonstrates UVP) single, clean, compelling message that states why you are different and worth buying can't be easily copied or bought target customers (separate canvas for different target customers) key activities you measure (define success) path to customers (free and paid channels) What are the most important costs inherent in our business model? Which Key Resources are most expensive? Which Key Activities are most expensive? For what value are our customers really willing to pay? For what do they currently pay? How are they currently paying? How would they prefer to pay? How much does each Revenue Stream contribute to overall revenues? Lean Business Model Canvas Designed for: Designed by: On: dd/mm/yyyy Iteration # Add Text Here Add Text Here Add Text Here Add Text Here Add Text Here Add Text Here copy the post-its below and paste them in the canvas Ash Maurya's lean canvas adaptation of the original google draw template by scrumology.net based on the work of Alexander Ostenwalder . Lucas Cervera to cre canvas, go share (subscription, ads, freemium...Outline back-of-the-envelope assumptions for life time value, gross margin, break-even point, etc.) This describes what we are doing, why we are doing it and how much it might cost…. But not when or how.
- 3. Current Lean Startup tools Lean Business Canvas Experiment Canvasleanstack.com
- 4. Managing your key stakeholders Most executive managers - 12hour+ work days. VERY LIMITED time to inform them.
- 5. Stakeholders want to know • What is the customer problem? • How are you going to solve it? • How long do you think it will take? • When can you launch something to market? • What is it going to cost? • What are the expected revenues (and return on investment)? …… “BIG PICTURE” questions… to get support and funding. How do we address these questions and still use Lean Startup principles to “build the right thing”?
- 6. Our current tools aren’t so Lean Problem Solution Key metrics Unique value proposition Unfair advantage Customer Segments Channels Cost Structure Revenue Streams top 3 problems top 3 features (MVP that demonstrates UVP) single, clean, compelling message that states why you are different and worth buying can't be easily copied or bought target customers (separate canvas for different target customers) key activities you measure (define success) path to customers (free and paid channels) What are the most important costs inherent in our business model? Which Key Resources are most expensive? Which Key Activities are most expensive? For what value are our customers really willing to pay? For what do they currently pay? How are they currently paying? How would they prefer to pay? How much does each Revenue Stream contribute to overall revenues? Lean Business Model Canvas Designed for: Designed by: On: dd/mm/yyyy Iteration # Add Text Here Add Text Here Add Text Here copy the post-its below and paste em in the canvas Ash Maurya's lean canvas adaptation of the original google draw template by scrumology.net based on the work of Alexander Ostenwalder . Lucas Cervera to create your own copy of this canvas, go to File/Make a copy and share it with whoever you want (subscription, ads, freemium...Outline back-of-the-envelope assumptions for life time value, gross margin, break-even point, etc.) And they really don’t address the “big picture” questions
- 7. Visualise what we are trying to achieve Need a way to visualise and “tell the story” about our business/solution concept. Why make it visual? • 90% of informa,on transmi/ed to the brain is visual • Images are processed 60,000 ,mes faster in the brain than text • Visuals improve learning ability by up to 400 percent
- 8. Lean Business Canvas Hypothesis-driven development Problem Solution Key metrics Unique value proposition Unfair advantage Customer Segments Channels Cost Structure Revenue Streams top 3 problems top 3 features (MVP that demonstrates UVP) single, clean, compelling message that states why you are different and worth buying can't be easily copied or bought target customers (separate canvas for different target customers) key activities you measure (define success) path to customers (free and paid channels) What are the most important costs inherent in our business model? Which Key Resources are most expensive? Which Key Activities are most expensive? For what value are our customers really willing to pay? For what do they currently pay? How are they currently paying? How would they prefer to pay? How much does each Revenue Stream contribute to overall revenues? Lean Business Model Canvas Designed for: Designed by: On: dd/mm/yyyy Iteration # dd ext ere dd ext ere Add Text Here dd ext ere Add Text Here Add Text Here copy the post-its below and paste them in the canvas Ash Maurya's lean canvas adaptation of the original google draw template by scrumology.net based on the work of Alexander Ostenwalder . Lucas Cervera to create your canvas, go to File/ share it with w (subscription, ads, freemium...Outline back-of-the-envelope assumptions for life time value, gross margin, break-even point, etc.)
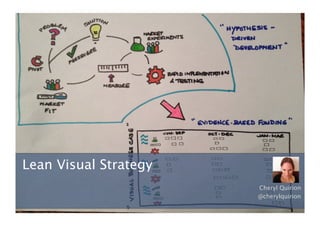
- 9. Business Concept Journey Map Hypothesis-driven development
- 10. Business Concept Journey Map Hypothesis-driven development Build
- 11. Business Concept Journey Map Hypothesis-driven development Build Measure
- 12. Business Concept Journey Map Hypothesis-driven development Build MeasureLearn
- 13. Business Concept Journey Map Hypothesis-driven development Build MeasureLearn Act
- 14. Focus on the “big picture”
- 15. Business Concept Journey Map Hypothesis-driven development How do we define and prioritise experiments?
- 17. Business Concept Journey Map Hypothesis-driven development
- 19. Experiment Canvas – Timeline Wall Hypothesis-driven development
- 20. Guerilla Testing – Retiro (Buenos Aires) Hypothesis-driven development
- 21. Guerilla Testing – San Antonio de Areco Hypothesis-driven development
- 22. Guerilla Testing – Rosario Hypothesis-driven development
- 23. Business Concept Journey Map Hypothesis-driven development Build Measure
- 24. Business Concept Journey Map Hypothesis-driven development Build MeasureLearn
- 25. Business Concept Journey Map Hypothesis-driven development Build Measure Act Learn
- 26. Visual Product Timeline MicroAgencyModel Technologyplatform Verticals Metrics Resources KeyMilestone
- 27. Visual Product Timeline MicroAgencyModel Technologyplatform Verticals Metrics Resources KeyMilestone
- 28. Visual Product Timeline (close up) MicroAgencyModel Technologyplatform Metrics Resources
- 29. Evidence-based funding MicroAgencyModel Technologyplatform Verticals Metrics Resources KeyMilestone Every 2 weeks, review experiment metrics with finance team. Agree how money should be spent (governance). Agree next quarter’s activities based on current experiment results with finance team (at least monthly) Initial plan based on inception outputs – customer interviews, etc. Team members annotate plan as required – for example when critical data will be available. Separate card wall for every stream. Build research and experimentation into your plan Note resources required so costs can be considered.
- 30. Closing thoughts Hypothesis-driven development • Put the “visual” back into strategic vision. Images are processed by the brain 60,000 times faster than text. • Experiments that test the risk in your business plan are vital. What customers say and what they do varies greatly. Rely solely on “market research” at your peril. • Solution doesn’t necessarily mean software. Remember the “human element” – user experience, sales, service, education. • Create “information radiators” - share information visually to facilitate conversations and better decision making
- 31. Questions? Cheryl Quirion CEO Squiggly / Lean & Agile Coach @cherylquirion Cheryl Quirion