2008 Developing Financial Services and Improving the Efficiency of the Bank...
2007:Q1
1. Bifm Economic Review 1st Quarter 2007
Economic Review
data suggests that this growth figure is not The conclusion is, therefore, that overall GDP
really representative of what is taking place growth rates are not very meaningful; the
in the economy. The main cause of the low 0.8% contraction in real GDP in 2005/06
The first quarter of the year is always a recorded growth rate in 2005/06 is the 4.4% tells us as little about the economy as the
productive one for new economic contraction in mineral production, which was 9.2% growth recorded in 2004/05, and
information, given the release of the Budget in turn due to a 4.3% reduction in diamond primarily reflects the volatility of monthly
in early February, publication of national production over this period. However, it production levels in the minerals sector rather
accounts data around the same time and the would be a mistake to pay too much attention than long-term economic performance.
Bank of Botswana’s Monetary Policy to this figure, as it largely represents an We therefore need to consider the growth
Statement a couple of weeks later, as well unintended consequence of the fact that the of the non-mining sector of the economy;
as trade data for 2006. Unlike almost any national accounts year (which runs from July- this is itself difficult because of the impact
time of the year, we cannot complain about June) does not coincide with Debswana’s of a range of “adjustment items” (such as
a shortage of macroeconomic data. This planning year for diamond production. The taxes and subsidies) that contribute to the
review will concentrate on the four areas of importance of this is that Debswana plans GDP calculations but which are not
the economy related to these developments, to meet calendar year targets, and it does disaggregated across sectors in the national
that is, economic growth, inflation and not matter whether this production occurs accounts. Making some allowances for this,
monetary policy, the government budget, in the first or second half of the year; if, for it appears that the growth of the non-mining
and international trade. instance, there is a disruption to production private sector increased in 2005/06, rising to
in the first half of the year (e.g. due to 2.5%, which is more than double the
Economic Growth
weather or other factors) this would be estimated 2004/05 growth rate of 1.2% (see
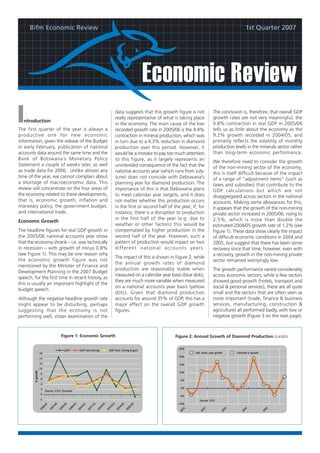
The headline figures for real GDP growth in compensated by higher production in the Figure 1). These data show clearly the impact
the 2005/06 national accounts year show second half of the year. However, such a of difficult economic conditions in 2004 and
that the economy shrank – i.e. was technically pattern of production would impact on two 2005, but suggest that there has been some
in recession – with growth of minus 0.8% different national accounts years. recovery since that time; however, even with
(see Figure 1). This may be one reason why a recovery, growth in the non-mining private
The impact of this is shown in Figure 2; while
the economic growth figure was not sector remained worryingly low.
the annual growth rates of diamond
mentioned by the Minister of Finance and
production are reasonably stable when The growth performance varied considerably
Development Planning in the 2007 Budget
measured on a calendar year basis (blue dots), across economic sectors; while a few sectors
speech, for the first time in recent history, as
they are much more variable when measured showed good growth (hotels, transport and
this is usually an important highlight of the
on a national accounts year basis (yellow social & personal services), these are all quite
budget speech
dots). Given that diamond production small and the sectors that are often seen as
Although the negative headline growth rate accounts for around 35% of GDP, this has a more important (trade, finance & business
might appear to be disturbing, perhaps major effect on the overall GDP growth services, manufacturing, construction &
suggesting that the economy is not figures. agriculture) all performed badly, with low or
performing well, closer examination of the negative growth (Figure 3 on the next page).
Figure 1: Economic Growth Figure 2: Annual Growth of Diamond Production (carats)
2. 2 Economic Review
Figure 3: Sectoral Growth Rates - 2004/05 & 2005/06 (%) Figure 4: Inflation - Actual & Forecast
While the growth performance across many The Bank of Botswana’s Monetary Policy The Bank also expressed concern about the
sectors of the economy was not good, we Statement (MPS) was released on February potential inflationary impact of the anticipated
should note that figures are preliminary and th increase in government spending in 2007/08,
19 , and retained the Bank’s inflation
are likely to be revised in due course. For objective range of 4%-7%. The MPS made but interestingly, commented that government
instance, the revised figures for 20004/05, clear the Bank’s determination to bring was unlikely to be able to spend all of the
released along with the 2005/06 GDP data, inflation down within the range and keep it money that has been made available.
show some big changes, especially in there, and indicated that the Bank expects
manufacturing, agriculture and transport all The decline in Botswana inflation, coupled
inflation to stay between 6% and 7% with rising inflation elsewhere has meant that
of which moved from positive to negative between the second quarter of 2007 and the
growth or vice versa as a result of the revisions the gap between domestic and foreign
end of the year; this is in line with our own inflation has continued to narrow. This is
(see Table 1 below).
forecasts (see Figure 4). Concerns were encouraging as it supports Botswana’s
Inflation & Monetary Policy expressed about the potential inflationary international competitiveness and should
impact of rising credit growth, which was up facilitate a decrease in the rate of crawl of
The good news on inflation continued in the
to 18.7% in February 2007, well above the the exchange rate of the pula later in the
first two months of 2007, with inflation falling
Bank’s preferred range of 11%-14%. year, which will help bring inflation down
from 8.5% at the end of 2006 to 7.2% in
further.
February. There are several reasons for this:
declining fuel prices, the falling away of the
impact of school fees which were reintroduced Table 1: Original and Revised Sectoral Growth Rates for 2004/05
in January 2006, as well as relatively small
price increases for alcohol, healthcare, Original Revised
transport, communications recreation and Sector (2006) (2007) Change
housing.
Our forecast is for inflation to keep declining Agriculture 3.3 -11.0 -14.3
over the next few months, perhaps falling as Mining 18.2 18.1 -0.1
far as 6%, although it is unlikely to fall below
that figure (see Figure 4). Nevertheless, there Manufacturing -2.6 7.7 +10.2
are looming price pressures that could inhibit
further declines in inflation. Food prices, in Water & elec. 3.3 3.5 +0.2
particular, are set to rise as a result of drought Construction 0.7 0.9 +0.2
in the region, with maize prices likely to move
up sharply. Also, the decline in oil prices that Trade, hotels etc. -6.6 -6.8 -0.2
continued through the second half of 2006
Transport 5.6 -0.7 -6.3
looks to have ended, and prices have risen
recently – in pula terms crude oil prices are Fin & bus services 4.1 4.9 +0.8
up by nearly 40% since the low point in early
January 2007 (see Figure 5 on the next page). Government 3.6 4.6 +0.9
The higher weight for fuel products in the Soc & pers services -0.5 10.4 +10.9
new Consumer Price Index (CPI) basket means
that the impact of changes in oil prices – Total GDP 8.4 9.2 +0.8
both upwards and downwards - on inflation
is now much larger.
3. 3 Economic Review
Figure 5: Crude Oil Prices (Brent Spot) Figure 6: Government Revenue & Spending
Government Budget As a consequence of rising revenues and The new budget for 2007/08 provides for a
declining expenditure (relative to GDP), we more or less balanced budget, with spending
The 2007 Budget presented to Parliament on are again seeing large budget surpluses (see
th at 40% of GDP and revenue of 41%. There
February 5 provided, as usual, an informative Figure 7 on the next page). The budget is good reason to believe, however, that this
overview of the economy and summary of balance for 2005/06 – the most recent year is a highly optimistic outcome, and that
developments over the past 12 months. Much for which actual data is available – is a massive expenditure will continue to fall short of the
was revealed about the state of government 8.1% of GDP, the largest figure since 1992/93. budgeted amounts. Government has
finances, and earlier concerns that spending
proposed a number of reforms to the project
was falling well behind budget were The most recent data for spending in the
implementation and government procurement
confirmed. 2006/07 financial year, up to December 2006
processes, but even so the expenditure targets
(i.e. covering three-quarters of the year),
Data on overall government revenue and are highly ambitious.
shows that only 61% of the budgeted
expenditure (see Figure 6) show a sharp expenditure for the whole year had been
reduction in spending, as a proportion of utilised. More striking is the contrast between In order to spend all of the money provided
GDP, between 2002/03 and 2005/06 (see recurrent and development spending: 68% for in the budget, development spending
Figure 6). Over this three year period, of the recurrent budget had been used, but would have to rise by 92% over the two years
government spending fell from 40% to 31% only 45% of the development budget. Even between 2005/06 and 2007/08. We forecast
of GDP, effectively a withdrawal of demand with a big expenditure push in the last quarter that development spending will instead rise
from this source of nearly 10% of GDP. This (January – March 2007), there is likely to be by around half of this amount, and that
is a massive amount, and explains why much a big underspend, perhaps by as much as budget surpluses will continue to be larger
of the economy experienced a severe growth 15-20% of the total budget. The than forecast.
slowdown – as Figure 1 shows, non-mining government’s forecast of a surplus of P4,3 As for the pattern of government spending
economic growth fell from 7.9% to 2.7% billion for the 2006/07 year is likely to be an (see Figure 8 on next page), this changes little
over this period. This illustrates the very high underestimate. from year to year. Education continues to
dependence of the non-mining sector on
receive the largest share of the budget, at
government spending, and furthermore Fiscal concerns have therefore shifted 24%, reflecting the importance placed on
suggests that Botswana’s need for economic considerably over the past few years. Back in expanding educational and training
diversification is not so much diversification 2001/02 and 2002/03, the major issue was opportunities. This means that public spending
away from dependence upon mining – fiscal sustainability, with two years of budget on education is equivalent to around 10%
especially now that the mining sector is itself deficits and great concern that the revenue of GDP, one of the highest – if not the highest
becoming more diversified – but diversification trend was steadily downward with spending – levels of public education spending, in
away from dependence upon government. steadily rising, an unsustainable combination. relation to the size of the economy, in the
Government revenues are looking much Since that time, both trends have been world. After general administration costs, the
healthier than now that they were a few years reversed. The concern now is that, rather next largest share goes to health, which is
ago, with a small but significant increase from than spending being too high and growing one of the areas where patterns of spending
36% of GDP in 2001/02 to 39% in 2005/06, too fast, government lacks the capacity to have changed; historically, health spending
driven mainly by rising revenues from the spend the money that is made available within accounted for around 5% of the budget, but
Southern African Customs Union (SACU). the context of the new fiscal rule. In particular, this has been rising steadily, primarily on
Nevertheless, this trend is unlikely to continue, project implementation bottlenecks and account of the measures taken to deal with
as the SACU revenue increase is a windfall constraints are retarding overall expenditure, HIV and AIDS.
gain stemming from South Africa’s rapid and making development spending targets
import growth. almost impossible to achieve.
4. 4 Economic Review
Figure 7: Budget Balance Figure 8: Composition of Government Spending
Figure 9: Exports & Imports (Monthly) Figure 10: Composition of Non-diamond Exports, 2006
International Trade The increase in total exports (up 19% in pula Botswana’s non-diamond exports are
terms in 2006) is only being driven in part by themselves quite diversified. Around half
Data on exports and imports for 2006 released
diamonds (up 16%). Apart from diamonds, comprises nickel & copper, and the remainder
by the Central Statistics Office (CSO) indicate
the main driver of higher exports in 2006 comprises a wide range of minerals and
that trade developments continue to be
was nickel/copper (up 66%), which benefited manufactured items (see Figure 10). The third
positive. Exports have been rising steadily,
from higher international metals prices. There largest export after diamonds and nickel
and the underlying trend rate of export growth
were also healthy increases in export earnings /copper is textiles, even though exports fell
over the period from 2004 to 2006 is more
from soda ash (up 39%), meat (up 27%), in 2006, followed by meat and soda ash. If
than three times faster than the trend growth
and miscellaneous manufactured goods (up exports of services (mainly tourism) are added
rate of imports (see Figure 9). This reflects
53%). in – which in total are larger than exports of
the positive impact of devaluations of 2004
nickel/copper – then the situation is even
and 2005, and indeed is exactly the outcome And important trend that was reinforced in
more positive.
that the devaluations were intended to 2006 was the gradual diversification of
achieve. As a result, Botswana’s annual trade Botswana’s exports. As recently as 2001, In the light of concerns about the slow pace
surplus rose from P0.7 billion in 2004 to P5.9 diamonds accounted for 85% of Botswana’s of diversification of the economy, it is
bn in 2005 and an estimated P8.7 bn in 2006. total exports, whereas by 2006 this had important to recognise that some success has
Over the same period, the current account declined to 73%; in other words, products been achieved in diversifying Botswana’s
surplus rose from P1.3 billion to P11.9 billion other than diamonds have risen from 15% exports, and reducing dependence upon
(about 20% of GDP). to 27% of total exports over this period. diamonds.
Bifm Botswana Limited
Asset Management. Property Management. Private Equity. Corporate Advisory Services.
Private Bag BR 185, Broadhurst, Botswana Tel: +(267) 395 1564. Fax: +(267) 390 0358. Website: www.bifm.co.bw