Content Measurement and Analytics (edUi Conference 2017)
•
0 j'aime•403 vues

We all want to create useful, usable content—and we want to deliver that content to the right users. But how do we know what works? And how do we use these insights to inform and adapt our content strategy? Effective content measurement relies on clearly defined goals. What is the purpose of your website and web content? What actions do you want users to take? How do you define success for your web presence and related content? Using analytics, we will relate content goals to relevant and meaningful metrics in order to quantitatively assess the quality of your web content and the efficacy of your content strategy—and make positive change.

Recommandé
Recommandé
Contenu connexe
Tendances
Tendances (19)
Similaire à Content Measurement and Analytics (edUi Conference 2017)
Similaire à Content Measurement and Analytics (edUi Conference 2017) (20)
Plus de Rick Allen
Plus de Rick Allen (11)
Dernier
Dernier (20)
Content Measurement and Analytics (edUi Conference 2017)
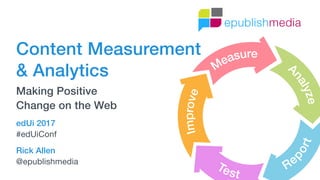
- 1. Rick Allen @epublishmedia Content Measurement & Analytics Making Positive Change on the Web edUi 2017 #edUiConf
- 2. Hi, I’m Rick. #edUiConf • @epublishmedia
- 3. #edUiConf • @epublishmedia So, what’s your story?
- 4. • Analytics • Usability studies • Surveys • A/B testing • Competitive analysis • Card sorting • Eye-tracking heat maps • User interviews How do you measure it? #edUiConf • @epublishmedia
- 7. How do we learn from our mistakes? #edUiConf • @epublishmedia
- 8. Digital analytics is the analysis of qualitative and quantitative data from your business and the competition to drive a continual improvement of the online experience that your customers and potential customers have which translates to your desired outcomes (both online and offline). “ Avinash Kaushik Author, Web Analytics 2.0 #edUiConf • @epublishmedia
- 11. Avinash Kaushik Author, Web Analytics 2.0 Digital analytics is the analysis of qualitative and quantitative data from your business and the competition to drive a continual improvement of the online experience that your customers and potential customers have which translates to your desired outcomes (both online and offline). “ #edUiConf • @epublishmedia
- 12. Evaluate content performance and make changes to improve.
- 13. • Quantitatively evaluate web content quality • Comparative analysis: measure website trends • Challenge and validate assumptions • Demonstrate how your website meets established business goals and users’ needs • Enable content owners to measure the success of their own content What analytics can do
- 14. • Provide a complete content measurement solution • Provide accurate data • Adequately answer Why? What analytics can’t do
- 15. Top-down analytics Bottom-up analytics Answer your questions Insights through discovery Goals Insights Discovery Search #edUiConf • @epublishmedia
- 18. Measurement doesn’t start here #edUiConf • @epublishmedia
- 19. Goals first #edUiConf • @epublishmedia
- 20. 20 A path to content measurement 1. Translate strategic business objectives into measurable content goals. 2. Define success metrics (KPIs) and measurement requirements. 3. Create and implement measurement plan. 4. Continually assess and report on success metrics with user-friendly insights and actionable next steps. 5. Improve and test content and reassess measurement plan. #edUiConf • @epublishmedia
- 21. No clear purpose means no clear value — and no way to measure success.
- 22. Let’s talk objectives & goals… #edUiConf • @epublishmedia
- 23. Business objectives • Enhance reputation & visibility • Increase revenue • Engage users • Optimize operational efficiency • Improve the user experience • Strengthen communications & feedback systems Content goals • Read a press release • Call your admissions team • Download a white paper • Sign-up for your blog • Submit application • Explore student services • Buy event tickets #edUiConf • @epublishmedia
- 24. A content goal that can’t be measured isn’t a goal.
- 25. Business objectives Content goals #edUiConf • @epublishmedia MORE examples… Increase overall enrollment Increase admissions inquiry form submissions Increase engagement within and beyond the school Increase news story shares and retweets on Twitter Increase the number of international student applicants Increase geographic diversity of web traffic.
- 26. Broad content goals Narrow content goals #edUiConf • @epublishmedia • Admissions Inquiry • Online inquiry form submission • Attend admissions event • Engage Users • Drive blog comments
- 27. It’s hard to find answers when you don’t understand the questions.
- 28. 28 Planning for Content Goals with Stakeholders https://flic.kr/p/6YiZbS https://flic.kr/p/6YiZbS Planning for content goals with stakeholders
- 29. What is the primary function of your role and department? What services do you provide? Which of these services is most important? Who are all the different audiences you communicate with or provide services for? Ask: Ask: Ask: #edUiConf • @epublishmedia Get the conversation started
- 30. What does the admissions process look like? How do prospective students move from being an inquiring student to an enrolled student? What does each step look like? What is the role of the admissions website in facilitating the admissions process? Ask: Ask: #edUiConf • @epublishmedia Understand the details
- 31. Users’ needs also inform content goals.
- 32. #CMWorld © Meet Content LLC. All rights reserved.
- 35. Business objectives Users’ needs What we plan for …and measure. Content goals #edUiConf • @epublishmedia
- 37. Content Measurement Framework 1 Business objectives 2 Content goals 3 Success metrics 4 Audience segments 5 Targets © 2017 ePublish Media, Inc. All rights reserved.
- 38. Content Measurement Framework 1 Business objectives What is the purpose of your organization? 2 Content goals 3 Success metrics 4 Audience segments 5 Targets © 2017 ePublish Media, Inc. All rights reserved.
- 40. #edUiConf • @epublishmedia A bit of role-playing 1. Trade worksheets with someone sitting next to you. 2. Take turns asking each other questions to better understand the other person’s single business objective. 3. Define one content goal for the other person’s business objective. 4. Return worksheet back to the owner.
- 41. Content Measurement Framework 1 Business objectives What actions do you want people to take? 2 Content goals 3 Success metrics 4 Audience segments 5 Targets © 2017 ePublish Media, Inc. All rights reserved.
- 42. • Attend a workshop • Take a promotional flyer • Call your office • Email with questions • Submit a paper application but they still count #edUiConf • @epublishmedia Not all actions take place on your website
- 44. Content Measurement Framework 1 Business objectives What relevant metrics can be used to measure your content goals over time? 2 Content goals 3 Success metrics 4 Audience segments 5 Targets © 2017 ePublish Media, Inc. All rights reserved.
- 45. #edUiConf • @epublishmedia Dimension Metrics
- 46. User Dimensions User Type New (first-time) or returning user Browser The browsers used by visitors to your website Device Category The type of device: Desktop, Tablet, or Mobile #edUiConf • @epublishmedia
- 47. Session Dimensions Source The sources which referred traffic (e.g., “Google”) Medium The mediums which referred traffic (e.g., “organic search”) Keyword Keywords used by users to reach your site #edUiConf • @epublishmedia
- 48. Interaction Dimensions Page The pages visited Landing Page The pages through which visitors entered your site Search Term The search terms used by visitors to search your site #edUiConf • @epublishmedia
- 49. Acquisition metrics Sessions Total number of visits to your website. % New sessions An estimate of the percentage of first time visits. New users The number of first-time users during the selected date range. #edUiConf • @epublishmedia
- 50. Behavior metrics Bounce rate The percentage of single-page visits Pages / session The average number of pages viewed during a session Avg. session duration The average length of a session Exit rate Indicates how often users leave your website from a page or set of pages #edUiConf • @epublishmedia
- 51. Conversion metrics Conversion rate The sum of all individual goal conversion rates Goal completions The total number of conversions Goal value The total value produced by goal conversions on your site Abandonment rate The rate at which goals were abandoned #edUiConf • @epublishmedia
- 52. Content Measurement Framework 1 Business objectives What audience segments will provide meaningful insights on content goals? 2 Content goals 3 Success metrics 4 Audience segments 5 Targets © 2017 ePublish Media, Inc. All rights reserved.
- 53. Metrics Segments Sessions (Visits) User type Bounce rate Page type Pageviews Device type Pages / session Geography Conversion rate External traffic only Exit rate Social media traffic only #edUiConf • @epublishmedia How would these segments change the data?
- 54. Content Measurement Framework 1 Business objectives What does success look like? 2 Content goals 3 Success metrics 4 Audience segments 5 Targets © 2017 ePublish Media, Inc. All rights reserved.
- 55. Numbers rarely speak for themselves • 2,000 pageviews • 20% new visitors • 80% bounce rate • 45% conversion rate
- 56. Without context, your data is meaningless.
- 57. Metrics Segments Targets Pageviews Email newsletter 1,500 pageviews (weekly) New visitors Social media 40% new visitors (monthly) Bounce rate Press releases 75% bounce rate (monthly) Conversion rate Spring marketing campaign 20% conversion rate (monthly)
- 59. 59
- 60. 60
- 61. <a href="/academics/student-handbook.pdf" onclick="javascript:_gaq.push(['_trackPageview', '/downloads/pdf/student-handbook.pdf']);">Student Handbook (PDF)</a> (the old way) #edUiConf • @epublishmedia Adding tracking code…
- 62. #edUiConf • @epublishmedia An easier way…
- 67. Conversions Conversion rate search 15 3% display 10 1.5% email 6 1.3% social 4 0.8%
- 68. Types of analytics goals Destination Goal completed when visitor views defined URL Event Goal completed when visitor takes a predefined action Time on site Goal completed when visitor spends X amount of time on site Pages / visit Goal completed when visitor views X number of pages on site User Action User Action User ENGAGEMENT User ENGAGEMENT
- 69. Any online action can be tracked as an analytics goal.
- 70. Sample analytics goals Destination View newsletter sign-up form confirmation page Event Watch promotional video Time on site Spend more than 2 minutes on your website during a session Pages / visit View 3+ product pages on your website during a session
- 71. Micro and macro conversions Micro goal Newsletter signup Micro goal Micro goal Macro goal attend a webinar Submit inquiry form Complete admissions application #edUiConf • @epublishmedia
- 80. • All visits • New visitors • Returning visitors • Paid search traffic • Non-paid search traffic • Search traffic #edUiConf • @epublishmedia • Direct traffic • Referral traffic • Visits with conversions • Mobile traffic • Non-bounce visits Default segments
- 81. #edUiConf • @epublishmedia • Visits without conversions • Unengaged users • Highly engaged users • Social media visits • Non social media visits Sample custom segments
- 83. Reporting
- 84. Source: http://www.kaushik.net/avinash/leverage-custom-web-analytics-reports-insights/ #edUiConf • @epublishmedia
- 89. Great, but… Why should I care? What should I do? What does this mean for the organization? #edUiConf • @epublishmedia
- 91. Being data driven is for bots. Be data informed! “ Gianluca Fiorelli SEO & Inbound Strategist, Moz #edUiConf • @epublishmedia
- 92. analytics V #edUiConf • @epublishmedia What’s your story? • Who is your audience? What do they care about? • What's working, what's not? (What does this data mean?) • How will this impact the organization? • What are the story themes? (What are the trends?) • What are the gaps in our story? (What don't we know?) • What actions should be taken?
- 93. #edUiConf • @epublishmedia Analytics storytelling tips 1. Know your audience 2. Focus on a few meaningful themes that relate analytics insights to business objectives 3. Use data with purpose and cut irrelevant information 4. Use the most effective medium (presentation, PDF, video, email) 5. Use images to help illustrate and simplify your findings
- 94. If you can’t explain it simply, you don’t understand it well enough. “ Albert Einstein Smart guy #edUiConf • @epublishmedia
- 95. #edUiConf • @epublishmedia Analytics story outline 1. Here’s where we were… 2. Then we changed x… 3. Here’s what happened… 4. Here’s what we should do next…
- 96. Your turn!
- 98. So, what else? #edUiConf • @epublishmedia
- 99. Thanks! #edUiConf • @epublishmedia Rick Allen ePublish Media, Inc. @epublishmedia www.epublishmedia.com