A glance at the uk economy (netsaving, fdi & debt) thienhuong
•
0 j'aime•333 vues

Part 2: A glance at the UK economy. Net Saving, FDI and National Debts

Recommandé
Recommandé
Contenu connexe
Tendances
Tendances (20)
En vedette
En vedette (11)
Similaire à A glance at the uk economy (netsaving, fdi & debt) thienhuong
Similaire à A glance at the uk economy (netsaving, fdi & debt) thienhuong (17)
Plus de Eva Do
Plus de Eva Do (19)
Dernier
Dernier (20)
A glance at the uk economy (netsaving, fdi & debt) thienhuong
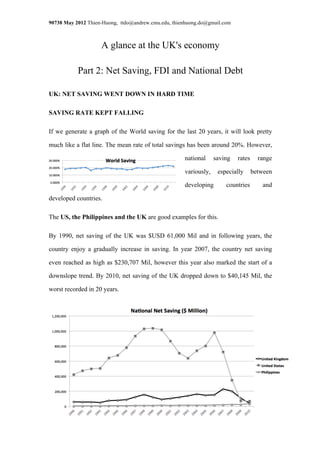
- 1. 90738 May 2012 Thien-Huong, ttdo@andrew.cmu.edu, thienhuong.do@gmail.com A glance at the UK's economy Part 2: Net Saving, FDI and National Debt UK: NET SAVING WENT DOWN IN HARD TIME SAVING RATE KEPT FALLING If we generate a graph of the World saving for the last 20 years, it will look pretty much like a flat line. The mean rate of total savings has been around 20%. However, national saving rates range variously, especially between developing countries and developed countries. The US, the Philippines and the UK are good examples for this. By 1990, net saving of the UK was $USD 61,000 Mil and in following years, the country enjoy a gradually increase in saving. In year 2007, the country net saving even reached as high as $230,707 Mil, however this year also marked the start of a downslope trend. By 2010, net saving of the UK dropped down to $40,145 Mil, the worst recorded in 20 years.
- 2. 90738 May 2012 Thien-Huong, ttdo@andrew.cmu.edu, thienhuong.do@gmail.com The US, being the most powerful economy in the world somehow experienced a similar trend. The country had done a good job beautifully increasing national saving from $422,387 Mil in 1990 to more than a billion in three continuous years of 1998- 1999-2000. In three years after that, net saving dropped down to $640,566 Mil and then went up again, nearly reached a billion in 2006. Since 2006, saving of the US can be considered the worst period of its two decades. By 2010, the giant only had $68,807 Mil in saving. Philippines, this populous developing country has managed to keep a nice increasing saving from only $5000 Mil in 1990 to almost 7 times greater in 2000; $34,688 Mil. This net saving is very modest as compared with The US and UK, but in 20 years, it drew a beautifully upward line. A look at the percentage of Saving Rate to Gross Net Income lets us understand this more. Started with only a few percent higher, the Philippines' been saving more and more. The mean rate saving of Philippines during the time was 22% and its saving for 2010 was 27%. The US & UK acted almost the same way. Both countries showed a downslope trending of saving, with a lower mean rate of 15%, both went down to some 10% by 2010. This makes the gap of saving rate between Philippines and 2 other countries as huge as 17%.
- 3. 90738 May 2012 Thien-Huong, ttdo@andrew.cmu.edu, thienhuong.do@gmail.com Saving becomes a sensitive subject in hard time; with worries people will save more. The graph showed that in gloomy year 2010, saving rate to GNI went up a bit. (The UK's saving rate, however still felt deeper. FDI FLOW: BECAME QUIETER Global business has been becoming more and more dynamic and flexible; Foreign Direct Investment plays a growing role. FDI flow is in theme with globalization, this observation seems true for all three countries: before "internet time" - 1995, FDI were quiet but it has become more exciting since then. The chart illustrates a net FDIs fluctuate considerable from one year to another, which is partly a function of busy economies. In the second half of 2000s, with the world financial crisis, the flow of FDI fluctuates in a narrower deviation. During 2008 time, FDI outflow of EU dropped some 30%. It's easy to predict a similar problem for UK; the economy dropped its FDI outflow by 28%. Its FDI inflow also fell, showed a smallest number since 2004 with total value of $USD 65.6 Bil. Industries that are most (outflow) affected was: Finance, Real Estate, Manufacturing, Trade and repairs. For inflow, those are industries with lots of
- 4. 90738 May 2012 Thien-Huong, ttdo@andrew.cmu.edu, thienhuong.do@gmail.com difficulties: Mining, Energy, Hotel and Restaurant. However, Mining stayed a shining industry as it increased in FDI outflow. The US had a high net FDI in 2000, right at time of Dotcom bubble but in recent years it facing a silent FDI flow, like the UK. Last, Philippines, as a country receiving FDI, its net FDI has a positive relations to its economy growth. In 2008 - 2010, three years that Philippine was doing better than UK and US, its net FDI ranged between $1.2 and 1.6 Bil. All in all, a country's FDI has a strong relation with its economy. It allows the transfer of expertise and technologies, thus broad and strong FDI flows often indicate a growing economy.
- 5. 90738 May 2012 Thien-Huong, ttdo@andrew.cmu.edu, thienhuong.do@gmail.com Among the three countries, Philippines has a stronger FDI than UK and the US as compared to its size of economy. NATIONAL DEBTS: RAISE MUCH WORRY In 1996, top foreign debt country was North Korea, by 2000 it's Mexico, in 2002 it's Brazil, in 2004 it's Japan, and since 2005 the US has been leading this. All countries had problem with foreign debts in history all went through a hard time, so this surely not a good news. Second to the US in 2005 -2006 -2007 was the UK (!). Foreign debts show a greater danger to one country's economy because its will become dependent on the economies it owes to. This make national debts become more of a serious problem. Above graph shows three countries' national debts since 1990, all with rising trend, and its GDP The US marked 2011 with its debt rose to $USD 14,122 Bil, as high as its GDP. Philippines also experienced a rising debt however it still keeps a safe margin Debt-GDP. The country seems doing the best is UK with its debt a lot lower than its GDPs
- 6. 90738 May 2012 Thien-Huong, ttdo@andrew.cmu.edu, thienhuong.do@gmail.com However it's not all. Next graph illustrates the National Debt per capita. By 1990 with $USD 3,206 Bil of national debt, divided by the population an American would have a debt of $USD 12,845. By 2010 it's $38,900. Similar, a Philippines's national debt per capita also has raised from a small number, $198 to nearly a thousand, or 21% increased from year to year. It would be higher if Philippines population has grown with lower rate. From this angle, UK appeared to have more troubles, in 20 years its Debt per capita raised from $7,613 to $18,860. With this 19% annually increasing debt per capita, by 2015, a English man will share a debt of $46,980 with its country.
- 7. 90738 May 2012 Thien-Huong, ttdo@andrew.cmu.edu, thienhuong.do@gmail.com Summary: UK at a glance Back to current financial situation, the UK is still doing fairly good as compared to the rest of world. Its GDP is going up. Its high unemployment rate (8.3%), plus low inflation (1.65%) and National debt raised worry but all in all it's still under control. It's remarkable that the country's economy in current time is quieter, thus, UK might want to look for possible solution for its future, such as: • Keep an eye on Finance and Banking industries: UK biggest banks HSBC Holdings, Standard Chartered and Barclays have a total market cap of $USD 250.65 Bil. So far the UK's giant banks are performing a lot better than the US. • In the US, City Group bailout costed US $12.3 Bil, plus recent $ 2 bn lost of JP Morgan prove that they have systematic problems and it's might not be all. • If UK banking can't stand stable in current situation, the outlook can be worse than the US because three mentioned banking institutions' size ($250.65 bil) are not small compare to that of US (388.34 Bil). • Improve and create good environment for FDI: in crisis time FDI flows seems resilient, it become quieter but it doesn't stop. Same recommendation for Philippines, they also should invest in infrastructures to attract more FDI inflow. • Set target for inflation rate. UK should set it higher, and Philippines should force it lower. • Create jobs. This is essential. References: Lecture Notes, TK Lim http://www.ukpublicspending.co.uk/ http://www.usgovernmentspending.com/ http://stats.oecd.org/ http://www.econstats.com/weo/CPHL.htm http://www.economist.com /http://www.nytimes.com/ http://www.guardian.co.uk/