

Recommandé
Contenu connexe
En vedette
En vedette (20)
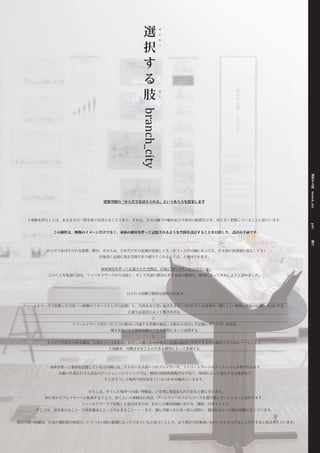
選択する肢/branch_city
- 1. 選 せ 択 ん た く す る 肢 あ し branch_city 選 択 す る 肢 branch_city 建築空間の「からだでおぼえられる」というあり方を提案します 土地勘を得ることは、あるまちの一帯を体でおぼえることであり、それは、自宅の廊下の幅や長さや家具の配置などを、何となく把握していることに似ています。 p.01 この制作は、映像のイメージだけでなく、身体の感覚を伴って記憶されるような空間を設計することを目指した、設計の手前です。 題 目 からだでおぼえられる建築/都市、それらは、どれだけその表層が変貌しても(オフィスが店舗になっても、住宅地が商業地に変化しても) 印象深く記憶に残る空間であり続けてくれるのでは、と期待されます。 身体感覚を伴って記憶された空間は、印象に残りやすいのではないか。 このことを仮説に設定、フィールドワークから実証し、そして任意の都市に対する私の感覚を、模型によって共有しようと試みました。 以下の 3 段階で制作は説明されます。 1. フィールドワークで収集した写真(=映像のイメージとしての記憶)と、写真をみて思い返されるそこでのわたしの身体の「感じ」 (=身体の感覚の記憶)を元にする、 2 通り記述法によって都市をみる 2. フィールドワークを行った5つの都市に共通する特徴の抽出・分析から見出した記憶に残りやすい状況を 覗き見ることで疑似体験のできる模型によって表現する 3. からだでおぼえられる都市、とはどういうものか、わたしの個人的身体感覚の記憶は他者と共有できるかを確認するためのツールとして 土地勘を、可動させることのできる模型によって表現する 身体を使って都市を記憶している人の例には、ストリートスポーツのプレイヤーや、ストリートアートのアーティストが挙げられます。 活動のために行う入念なロケーションハンティングでは、場所の図形的情報だけでなく、時刻によって変化する交通量など、 そこがどういう場所で何がおきているのかを見極めていきます。 わたしは、そうした場所への深い理解は、いま特に重要なものであると感じています。 歩行者からプレイヤーへと転身することで、歩くという単純な行為は、ゲームフィールドからコースを選び進んでいくことへと変わります。 フィールドワークで収集した地点は全てが、わたしの都市経験における「選択」のポイントで、 そこでは、道を曲がること・写真を撮ること・立ち止まること・・・など、選んだ様々な行為=肢と同時に、選ばれなかった肢が無数に生じています。 現実空間の経験は、行為の選択肢の密度と、いくつもの肢の蓄積によってできていると気づくことで、より豊かで印象深いものへと引き上げることができると私は考えています。
- 2. 記憶に依る都市の記述法① "drawing #1 ~ #5" 地図という大きなスケールで都市の全体像を捉え書き出し、そこから各スナップ写真の撮影ポイントへクローズアップしていく視点の記述法。 この "draawing #1~#5" にプロットされたスナップは、すべて "book #1~#5" に対応しています。 この "book" のなかで、一枚づつ写真を検討し、その撮影地点での自身の身体はどういった「感じ」であったか、視線はどのように推移したか、を図示しています。 記憶の地図を描くのは難しく、よく知る自宅周りでさえ中々正確にとはいきません。 スナップ写真をプロットすることができた場所とはつまり、「記憶を頼りに描き出せる・且つ・写真に収めておくべき何かがあった場所」といえます。 (場所は覚えていても地図に書けなかったためにふるい落とした写真も多い) 描いてみると、正方形と思った範囲がどれだけ歪んだ四角をしているか、道の長さがどれだけ実際とは異なるか、 また地図を描くとき無意識に、上とした方向が、広く共有される「地図の上は北」という認識とずれているか、偶然に一致するか (#3 Edinburgh の場合、南を上に描いたため、四角を結ぶ線はねじれて繋がった) ―知ったつもりの都市の認識がいかほど曖昧でおおざっぱであるかが分かります。 の 記 わ 地 フ 地 憶 6. り 図 ィ 1. 図 の に を ー を 地 記 見 ル 用 図 憶 ず ド 意 で だ に ワ し 書 け 都 ー ま い で 市 ク す た 地 を 範 図 歩 囲 を き と か 、 お き 一 お ま 日 よ す の そ 終 同 じ 範 囲 お 辿 フ の き っ ィ 2. 、 ま た ー 実 す 道 ル 際 を ド 、 ワ 選 常 ー 択 に ク す G る P 肢 S で の フ branch_city 7. 記 デ ィ 録 ー ー し タ ル て を ド 表 ワ 示 ー し ク も フ ま を の ィ 3. す 通 を ー し 使 ル p.02 て い ド 辿 ま ワ っ す ー た ク 道 で を 記 書 憶 記 い 録 に た 依 し 記 た る 憶 都 G の P 市 地 の S 図 記 の 述 う 法 ち ① 、 最 後 み 5 の "drawing #1 ~ #5" 、 . 8. 同 で 様 塗 の ら プ 記 濃 れ 写 憶 4. 淡 た 真 の を グ を 地 赤 リ プ 図 で ッ ロ に フ つ ド ッ 、 ィ け と ト フ ー ま 同 し ィ ル す じ て ー ド 範 い ル ワ 囲 き ド ー を ま ワ ク し す ー の め ク 手 す 中 順 部 に と 分 撮 記 を 影 述 囲 し 法 た の ス 解 ナ 説 ッ が 6 た 便 対 . 9. 写 宜 5. 応 の 真 上 し 正 の の て 方 数 グ い 形 に リ る と 比 ッ か 9 例 ド 、 . し を 線 の て か で 不 マ け 結 整 ス 、 ん 形 の 1 で な 色 マ 示 四 を ス し 角 濃 の ま 、 く 中 す 各 塗 に 々 り プ の ま ロ ど す ッ の ト 頂 さ 点 れ
- 3. branch_city p.03 "drawing #3 Edinburgh, Scotland" 選 択 す る 肢 記 憶 に 依 る 都 市 の 記 述 法 ① drawing #3_Edinburgh, Scotdland eXX (XX=01~90) : the photo numbering / correspond to "drawing book #3_Edinbrugh" ――――――red line : the GPS tracking data of the 3days' survay in Edinburgh, recorded by Android app "YAMATABI Logger" <drawn in monochrome = information depending on my memory> <drawn in red = information depending on the universal map> N monochromatic map : my recollection image after the 3days' survay in Edinburgh,(2~4 Sep. 2012) ※ NOT TO SCALE devided pieces of the map : each shape and color strength correspond to which of gray square, North is upper ">>>>>>" on the monochromatic map : my impression of the slant of the path / the steeper a slope is, the higher a density of ">>>>>>" is. 0 200m ■■■■■ gray squares : the color strength react towards the number of "eXX" per one square
- 4. 記憶に依る都市の記述法①と②の媒体 "drawing book #1 ~ #5" 記憶に依る都市の記述法、①の "drawing"、②の "activity_pulse"、これらをつなぐのが この各都市ごとに本として纏めた "drawing_book" に収められている、フィールドワークで採集した数十枚に及ぶスナップショットです。 それぞれの写真につけられた、「英字 + 二桁の数字」のナンバリングは、"drawing" や "activity_pulse" にプロットされているものに対応しています。 並んでいる三枚の画像は、以下を示しています。( ※ p.11 にて、ダイアグラムの立体的見方を図示解説する ) 左の写真 スナップショット 中央線画 そのスナップショットに写ったうちの、なにをみて、写真を手書き地図にプロットしたか。判断要素、重要なひと・ものを、抽出した線画 右のダイアグラム そのスナップを撮影した地点での、私の視覚的記憶を赤線で/身体的記憶を黒線で、図として示したもの。 赤横線:アイレベル・赤矢印:視線の動き / x 軸:左右・y 軸:前後・灰太線:重心軸の傾き、どの方向に道が傾斜していたかを示す・灰点線:撮影後の足取り g01 eXX the photo numbering correspond to "drawing #3_Edinburgh, Scotland" XX=01~90 snapshot line drawing diagram view direction taken at the place that a numbering "eXX" shows extract judgment materials for identiϐication of the ϐilming location eye level 選 択 す target transition to watch る 肢 view direction branch_city walking direction y y p.04 z c ion th direction of the degree of 記 leaning of the center of g f ter f gravity axis r 憶 に x x 依 z る 都 市 level gauge の 記 ...this steep based on my mental image at this point e 述 法 e.g.)upslope+upward to the left ① drawing book #5 Yotsuya drawing book #4 Meguro drawing book #3 Edinburgh drawing book #2 Stirling drawing book #1 Glasgow "drawing book #1 ~ #5" y01 ~ y57 m01 ~ m74 e01 ~ e90 s01 ~ s67 g01 ~ g43 解 説 y01 m30 e01 s01 g01 y y y y y z z x x x x x z z z
- 5. 記憶に依る都市の記述法② "activity_pulse #1 ~ #5" 各撮影ポイントごとで記憶している状況を、波形に変換し、それを時系列で並べます。 繋がった波形全体をみると、その都市で自分が辿ったルートの全容がみえる、各地点から全体像へズームアウトしていく記述法。 "book #1~#5" では、写真一枚ごとに付したスケッチによって、記憶を思い返すために重要と思われた要素を抜き出し、 ダイアグラムによってスナップ写真を撮影した各地点での記憶を、視覚的情報と身体感覚の二つを合わせてあらわしています。 それらを比較し、よく覚えている場所とそうでないところ、見るべきものはなくても身体の感覚としては強く記憶に残っている場所などを見つけるのにこの "activity_pulse" を使うことができます。 また、この "activity_pulse" はわたし自身の恣意が積み重なった経験のレールを表現しているということができます。 そして写真を採集した都市そのものをあらわしているのではなく、あくまでこの都市で取り得る無数のルートのうちの一例でしかない、ということが重要と考えます。 波形が大きく変化するほど経験は豊かだったといえますが、かといってよく目立つアイストップになるものが乱立し連続したら、それは単調な経験となってしまう。 経験の検証のみならず、経験を設計する手立てとなる記述法として、可能性があるのではと思っています。 あ 地 立 残 色 通 る 点 ち 4. る に 常 1. 。 の 止 、 対 の 写 ま 多 応 歩 真 っ く し 行 は て 写 て を 、 写 真 い 示 歩 真 を る し き を 撮 。 、 な 撮 影 つ 大 が 影 し ま き ら し た り さ 立 た 場 、 は ち 地 所 大 止 点 で き "drawing" ま で あ な ら あ る ず る 。 pulse に こ の シ と が 6 ャ を 示 . ッ 示 す で タ す 地 塗 ー 。 点 ら を こ は れ 選 き の 、 た 択 っ 表 強 グ す た 示 く リ る も 以 印 ッ 肢 の 外 象 ド で の に の branch_city T 対 る ア 字 5. 応 こ イ 2. p.05 路 し と ス 、 て を ト つ い 示 ッ き る し プ あ 、 ( 記 た 大 塔 憶 り き や に に さ 教 依 出 は 会 る 会 、 都 っ 高 市 "drawing" た い の こ ビ 記 と ル 述 を の な 法 示 6 ど ② す . 目 。 で を 塗 ひ "activity_pulse #1 ~ #5" ら く れ 建 た 築 グ や リ 工 ッ 作 ド 物 の ) 色 が に あ 解 説 す 足 を の 重 。 元 6. 示 傾 心 3. の す き が テ た ・ 傾 ク め 右 け ス 、 は ば チ 左 ュ 右 activity_pulse "activity_pulse" ア が x ( 目 軸 に 付 の ) は 傾 い 三 も た き 次 を 傾 り 元 く 、 示 で し 。 歩 表 左 行 て す い は に 必 前 影 る 要 。 後 響 が し こ あ ("book" た の る 前 り 。 し 後 に た 左 お こ 右 け と の る を 傾 y 示 き 軸 )
- 6. branch_city p.06 "activity_pulse #3 Edinburgh, Scotland" 選 択 す る 肢 記 憶 に 依 る 都 市 の 記 述 法 ② activity_pulse #3_Edinburgh Scotland visualize the experience of the way which I traced. this pulse is the representation of the 3days’ survay in Edinburgh.(2~4 Sep. 2012) inclining axis = the timeline (it starts from the lower left) vertical axis = impressiveness of �ive phases (�ive phases of impressiveness “■■■■■gray squares ” in “drawing #3_Edinburgh, Scotland“) impressiveness e49 e74 e47 time e41 e69 e67 e66 e59 e35 e36 (gravity Y) level_1 2 3 4 5 level_1 2 3 4 5 (gravity X) e13 e08 e01 neutral (walk) eye stop (walk) (stop) (turn) (texture) e01 e08 e13 e35 e36 e41 e47 e49 e59 e66 e67 e69 e74
- 7. drawing #1_Glasgow, Scotdland gXX (XX=01~43) : the photo numbering / correspond to "drawing book #1_Glasgow" ――――――red line : the GPS tracking data of the 3days' survay in Edinburgh, recorded by Android app "YAMATABI Logger" <drawn in monochrome = information depending on my memory> <drawn in red = information depending on the universal map> N monochromatic map : my recollection image after the 3days' survay in Glasgow, (25~27 Aug. 2012) ※ NOT TO SCALE devided pieces of the map : each shape and color strength correspond to which of gray square, North is upper ">>>>>>" on the monochromatic map : my impression of the slant of the path / the steeper a slope is, the higher a density of ">>>>>>" is. 0 200m ■■■■■ gray squares : the color strength react towards the number of "gXX" per one square 選 択 す る 肢 branch_city p.07 activity_pulse #1_Glasgow, Scotland 記 憶 に visualize the experience of the way which I traced. this pulse is the representation of the 3days’ survay in Glasgow.(25~27 Aug. 2012) 依 る inclining axis = the timeline (it starts from the lower left) 都 vertical axis = impressiveness of �ive phases (�ive phases of impressiveness “■■■■■gray squares ” in “drawing #1_Glasgow, Scotland“) 市 の 記 述 impressiveness 法 drawing & activity_pulse #1 Glasgow, Scotland time g42 g25 g36 g02 g17 g16 g15 (gravity Y) g06 g05 g04 level_1 2 3 4 5 level_1 2 3 4 5 (gravity X) neutral (walk) eye stop (walk) (stop) (turn) (texture) g02 g04 g05 g06 g15 g16 g17 g25 g36 g42
- 8. drawing #2_Stirling, Scotdland sXX (XX=01~67) : the photo numbering / correspond to "drawing book #2_Stirling" ――――――red line : the GPS tracking data of the 3days' survay in Edinburgh, recorded by Android app "YAMATABI Logger" <drawn in monochrome = information depending on my memory> <drawn in red = information depending on the universal map> N monochromatic map : my recollection image after the 3days' survay in Stirling, (28~30 Aug. 2012) ※ NOT TO SCALE devided pieces of the map : each shape and color strength correspond to which of gray square, North is upper ">>>>>>" on the monochromatic map : my impression of the slant of the path / the steeper a slope is, the higher a density of ">>>>>>" is. 0 200m ■■■■■ gray squares : the color strength react towards the number of "sXX" per one square 選 択 す る 肢 branch_city p.08 activity_pulse #2_Stirling, Scotland 記 憶 に visualize the experience of the way which I traced. 依 this pulse is the representation of the 3days’ survay in Stirling.(28~30 Aug. 2012) る inclining axis = the timeline (it starts from the lower left) 都 vertical axis = impressiveness of �ive phases (�ive phases of impressiveness “■■■■■gray squares ” in “drawing #2_Stirling, Scotland“) 市 の 記 述 impressiveness 法 s67 s62 drawing & activity_pulse #2 Stirling, Scotland s57 time s42 s21 s31 s07 s27 (gravity Y) level_1 2 3 4 5 level_1 2 3 4 5 (gravity X) neutral (walk) eye stop (walk) (stop) (turn) (texture) s07 s21 s27 s31 s42 s57 s62 s67 sXX sXX