Contenu connexe
Plus de MPP Consulting (20)
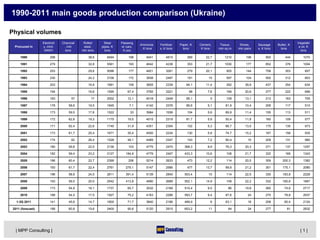
1990-2011 production volumes analysis (Ukraine)
- 1. 1990-2011 main goods production comparison (Ukraine)
Physical volumes
Electricit Charcoal Rolled Steel Passeng Vegetabl
Ammonia Fertilizer Paper, K Cement, Tissue, Shoes, Sausage Butter, K
Procuced in y, mlrd. , mln steel, pipes, K er cars, e oil, K
, K tons s, K tons tons K tons mln sq.m mln pairs s, K tons tons
kWt/H tons mln tons tons K pcs tons
1990 298 38,6 6494 196 4941 4815 369 22,7 1210 196 900 444 1070
1991 279 32,8 5561 193 4642 4238 353 21,7 1030 177 852 376 1004
1992 253 29,6 5096 177 4821 3261 279 20,1 925 144 758 303 857
1993 230 24,2 3106 172 3938 2497 181 15 597 104 500 312 803
1994 203 16,9 1661 109 3655 2339 94,1 11,4 292 39,9 437 254 634
1995 194 16,6 1595 67,4 3782 2221 98 7,6 169 20,6 277 222 696
1996 183 57 17 2002 12,1 4018 2449 95,1 5 109 13,1 213 163 705
1997 178 58,6 19,5 1845 7,1 4142 2376 86,6 5,1 81,9 10,4 206 117 510
1998 173 59,5 17,8 1522 33 3984 1936 104 5,6 89,9 11,4 155 113 511
1999 172 62,8 19,3 1175 19,5 4515 2319 81,7 5,8 50,4 11,9 160 109 577
2000 171 62,4 22,6 1740 31,9 4351 2304 102 5,3 66,7 13,5 175 135 973
2001 173 61,7 25,4 1671 35,4 4500 2234 130 5,8 74,7 15,2 167 158 935
2002 174 62 26,4 1528 48,1 4489 2347 143 7,2 90,4 15 209 131 980
2003 180 59,8 22,5 2136 103 4775 2470 368,3 8,9 76,3 20,3 271 137 1257
2004 182 59,4 23,2 2127 184,9 4779 2407 433,3 10,6 108 21,7 332 169 1343
2005 186 60,4 22,7 2399 206 5214 2633 473 12,2 114 20,5 309 200,3 1382
2006 193 61,7 22,4 2761 279,1 5147 2566 477 13,7 99,9 21,2 301 175,1 2080
2007 196 58,9 24,5 2811 391,4 5139 2840 553,4 15 114 22,5 330 183,8 2228
2008 193 59,5 20,5 2542 413,8 4890 2689 552,1 14,9 109 22,2 332 165,6 1867
2009 173 54,8 16,1 1737 65,7 3032 2169 510,4 9,5 86 19,8 260 74,6 2717
2010 188 54,5 17,5 1927 75,2 4163 2286 593,7 9,4 87,6 24 270 78,8 2937
1-3Q 2011 141 45,6 14,7 1800 71,7 3840 2186 489,9 8 63,1 18 208 60,4 2124
2011 (forecast) 188 60,8 19,6 2400 95,6 5120 2915 653,2 11 84 24 277 81 2832
| MPP Consulting | |1|
- 2. 1990-2011 main goods production comparison (Ukraine)
Comparison (year to year)
Electricit Charcoal Rolled Steel Passeng Vegetabl
Ammonia Fertilizer Paper, K Cement, Tissue, Shoes, Sausage Butter, K
y, mlrd. , mln steel, pipes, K er cars, e oil, K
, K tons s, K tons tons K tons mln sq.m mln pairs s, K tons tons
kWt/H tons mln tons tons K pcs tons
2011 to 1990 -36,91% -49,22% -63,04% -51,22% 3,62% -39,47% 77,02% -53,01% -93,05% -87,76% -69,19% -81,86% 164,67%
2011 to 2001 8,67% -1,46% -22,83% 43,63% 170,06% 13,78% 30,47% 402,46% 83,91% 12,63% 57,89% 66,07% -49,03% 202,89%
2011 to 2002 8,05% -1,94% -25,76% 57,07% 98,75% 14,06% 24,19% 356,78% 48,15% -6,93% 60,00% 32,70% -38,52% 188,98%
2011 to 2003 4,44% 1,67% -12,89% 12,36% -7,18% 7,23% 18,00% 77,36% 19,85% 10,27% 18,23% 2,34% -41,22% 125,30%
2011 to 2004 3,30% 2,36% -15,52% 12,83% -48,30% 7,14% 21,09% 50,75% 0,63% -22,10% 10,60% -16,47% -52,35% 110,87%
2001 to 2005 1,08% 0,66% -13,66% 0,04% -53,59% -1,80% 10,70% 38,10% -12,57% -26,20% 17,07% -10,25% -59,79% 104,92%
2011 to 2006 -2,59% -1,46% -12,50% -13,07% -65,75% -0,52% 13,59% 36,94% -22,14% -15,78% 13,21% -7,86% -54,01% 36,15%
1011 to 2007 -4,08% 3,23% -20,00% -14,62% -75,57% -0,37% 2,63% 18,03% -28,89% -26,20% 6,67% -15,96% -56,18% 27,11%
2011 to 2008 -2,59% 2,18% -4,39% -5,59% -76,90% 4,70% 8,39% 18,31% -28,41% -22,81% 8,11% -16,47% -51,37% 51,69%
2011 to 2009 8,67% 10,95% 21,74% 38,17% 45,51% 68,87% 34,38% 27,98% 12,28% -2,17% 21,21% 6,67% 7,95% 4,23%
2011 to 2010 0,00% 11,56% 12,00% 24,55% 27,13% 22,99% 27,50% 10,02% 13,48% -3,96% 0,00% 2,72% 2,20% -3,58%
| MPP Consulting | |2|