San Diego Regional Homeless Profile
•
1 j'aime•2,168 vues

The Regional Homeless Profile (RHP) is biennial (every two years), broad-based analysis of homelessness in the San Diego region. Data in the RHP includes: the AHAR (Annual Homeless Assessment Report) and the Point-In-Time Count (PITC). The RHP also includes summary counts of the 18 incorporated cities in San Diego County.

Recommandé
Recommandé
Contenu connexe
Tendances
Tendances (17)
En vedette
En vedette (14)
Similaire à San Diego Regional Homeless Profile
Similaire à San Diego Regional Homeless Profile (20)
Dernier
Dernier (20)
San Diego Regional Homeless Profile
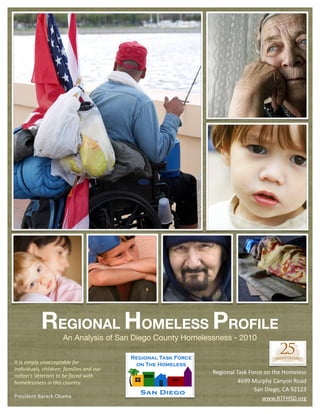
- 1. REGIONAL HOMELESS PROFILE An Analysis of San Diego County Homelessness - 2010 It is simply unacceptable for individuals, children, families and our Regional Task Force on the Homeless na7on’s Veterans to be faced with homelessness in this country. 4699 Murphy Canyon Road San Diego, CA 92123 President Barack Obama www.RTFHSD.org
- 2. Regional Homeless Profile 2010 – Table of Contents I. EXECUTIVE SUMMARY ............................................................................................... 2 About the Regional Task Force on the Homeless (RTFH) ................................................................... 3 Homeless Management Information System (HMIS) ......................................................................... 5 Regional Continuum of Care Council (RCCC) ...................................................................................... 6 National Perspective – A Snapshot .................................................................................................... 7 II. SAN DIEGO COUNTY REGIONAL DATA SUMMARY -‐ 2010 .............................................. 13 The 2009 Annual Homeless Assessment Report (AHAR) ................................................................. 14 AHAR – San Diego Regional Summary -‐ 2009 .................................................................................. 14 Local Perspective – A Point-‐In-‐Time (PIT) count Snapshot -‐ 2010 ................................................... 23 Summary By City I -‐ Point-‐In-‐Time (PIT) count -‐ 2010 ...................................................................... 24 Summary By City II -‐ Point-‐In-‐Time (PIT) count -‐ 2010 ..................................................................... 25 Demographics – San Diego Region (Point-‐In-‐Time count -‐ 2010) .................................................... 26 Unmet Needs in the San Diego Region -‐ 2010 ................................................................................. 27 The Point-‐In-‐Time count (PIT) & Street Survey -‐ 2010 ..................................................................... 28 2010 Point-‐In-‐Time (PIT) ‘Unsheltered Survey’ Executive Summary ............................................... 29 III. COMMUNITY & REGIONAL SUMMARIES -‐ 2010 ........................................................... 54 Summaries By City -‐ 2010 ................................................................................................................. 54 City of San Diego -‐ City Council Districts -‐ 2010 ............................................................................... 75 San Diego County Supervisorial Districts -‐ 2010 .............................................................................. 77 San Diego County Congressional Districts -‐ 2010 ............................................................................. 79 IV. INNOVATIONS AND INITIATIVES IN THE SAN DIEGO REGION ............................................ 81 Legal/Law Enforcement ................................................................................................................... 81 Homeless Data and Information Systems ........................................................................................ 83 Services and ‘One-‐Stop Shops’ ......................................................................................................... 85 Mental Health and Housing ............................................................................................................. 87 Emergency Shelter Innovations ....................................................................................................... 88 Policy ................................................................................................................................................ 88 Collaborative Planning Efforts .......................................................................................................... 89 Targeted Initiatives in 2010 .............................................................................................................. 91 V. CONCLUSION ........................................................................................................ 92 VI. APPENDIX ............................................................................................................ 93 The Point-‐In-‐Time (PIT) Process ...................................................................................................... 93 Homelessness Definition ................................................................................................................ 100 The HEARTH Act ............................................................................................................................. 101 HPRP – Homeless Prevention and Rapid Re-‐Housing Program ...................................................... 102 Registry Week – Downtown San Diego – Results ........................................................................... 103 Resources ....................................................................................................................................... 107 Regional Service Providers and other Stakeholders ....................................................................... 108 Acknowledgements ........................................................................................................................ 110 Glossary .......................................................................................................................................... 110 Regional Task Force on the Homeless (RTFH) Regional Homeless Profile 2010 Page 1 of 114
- 3. I. Executive Summary San Diego County’s 2010 Point-‐In-‐Time (PIT) count resulted in an estimate of 8,574 individuals who are homeless in the San Diego County region (both sheltered and living on the street). This represents a regional increase of 11.6% since the PIT count in 2008. According to the 2009 Annual Homeless Assessment Report (AHAR), there are 643,067 people experiencing homelessness on any given night in the United States1. In the coming year, it is estimated that approximately 3½ million people will experience homelessness. In the San Diego region, a total of 10,040 persons spent at least one night in a San Diego emergency shelter or transitional housing program2. About two-‐thirds (64.5%) of persons in shelters were individuals and one-‐third (35.5%) were persons in families. Overall, the number of persons experiencing homelessness is increasing due to many issues, including the national recession and high unemployment. In San Diego County, the poverty rate rose to 12.6% in 2009 up from 11.1% in 2007. In the city of San Diego The rate was 14.3%3. Homelessness takes different forms. Some individuals seek out emergency housing only for a short time because of a temporary crisis like a job loss, eviction or an episode of violence in their home. Americans sleep in shelters or on the street, under freeway bridges, in canyons or fields. Others may spend years on the street for a variety of reasons, such as substance abuse, mental illness, disabilities, and chronic “Homelessness cannot be solved by a single agency, or a single level of health conditions. government. Be reminded of the intricacies of homelessness as a policy area, and remember that preventing Since the mid 1980’s, the Regional Task Force on the and ending homelessness takes real Homeless (RTFH) has been providing homelessness data coordination, collaboration, and a collection and analysis to support the San Diego County constant exchange of ideas.” region. As the administrator of the regional HMIS (Homeless Kathleen Sebelius, Secretary Management Information System) and the Point-‐In-‐Time (PIT) U. S. Dept. of Health & Human Services count for San Diego County, the data gathered and shared by the RTFH helps provide a fuller, more descriptive picture of homelessness in the San Diego region. The Regional Homeless Profile (RHP) reflects data from ‘Point-‐in-‐Time’ summary as well as annualized data as reflected in the Annual Homeless Assessment Report (AHAR). The data in the report is intended to help monitor and understand trends in homelessness in our region, to provide context on the collaborative efforts in our region, to understand demographic profiles, to identify needs, and to help craft solutions. Thank you for your interest. We welcome your questions, suggestions and comments. Peter Callstrom, Executive Director -‐ Regional Task Force on the Homeless Note, as you read the electronic version, there are various hyperlinks that will take you to the source of the reference - either within the document, or on the internet. 1 National Alliance to End Homelessness 2 AHAR reporting period, of October 1, 2008 to September 30, 2009 3 The Center on Policy Initiatives (2010): http://www.onlinecpi.org/article.php?list=type&type=379 Regional Task Force on the Homeless (RTFH) Regional Homeless Profile 2010 Page 2 of 114
- 4. About the Regional Task Force on the Homeless (RTFH)4 • In 1984 the City of San Diego created the Mayor’s Task Force on Homelessness. From these early efforts, the RTFH expanded to serve the full region as a community collaborative. In 2004, the RTFH became an independent 501(c)3 nonprofit. • The RTFH manages a countywide Homeless Information System (HMIS) that is used by dozens of local service providers who manage 300+ distinct programs. • The RTFH supports and empowers San Diego County’s homeless service providers with key data and reports: regarding homeless counts, locations, beds, services, unmet needs, etc. • The RTFH publishes plans, special reports, and analysis “The need has never been on a variety of topics relating to the causes and greater for coordinated services conditions of, and the responses to homelessness. in our region. However, thanks to our many agency partners, • The RTFH manages the entire process for the annual the commitment of our elected Point-‐In-‐Time count: planning, volunteer coordination, officials, and the passion of our fellow San Diegans, we are well mapping, training, conducting ‘street’ surveys, and prepared to proactively collecting and analyzing data. respond to our shared goal of ending homelessness.” • The RTFH provides technical assistance, help desk, ongoing training, and critical data reporting to: service Peter Callstrom providers, cities in San Diego county, the county of San RTFH Executive Director Diego, elected officials, and the U.S. Department of Housing and Urban Development (HUD). • The RTFH also collaborates closely with community groups, local agencies, and public entities, in order to implement plans to address and alleviate homelessness. Regional Task Force on the Homeless 4699 Murphy Canyon Road • San Diego, CA 92123 (858) 292-‐7627 (phone) • (858) 292-‐27989 (fax) info@rtfhsd.org www.rtfhsd.org http://www.facebook.com/RTFHSD http://twitter.com/RTFHSD 4 National Alliance to End Homelessness -‐ 2009 Regional Task Force on the Homeless (RTFH) Regional Homeless Profile 2010 Page 3 of 114
- 6. Homeless Management Information System (HMIS) • The HMIS5 is an electronic system designed to record and store information on the characteristics and service needs of homeless persons. It implements and complies with HUD data specifications. The Annual Homeless Assessment Report (AHAR -‐ on page 6) uses HMIS data for the most recent, one-‐year reporting period (October -‐ September) and compares it with previous HMIS-‐based findings. Data is used to produce counts of the sheltered homeless population over a full year—that is, people who used emergency shelter or transitional housing programs at some time during the course of a year. • In 2000, the Regional Continuum of Care Council6 (RCCC on page 6) selected ServicePoint™ (Bowman Systems) as the primary software vendor for the regional HMIS and asked the RTFH to provide the implementation, technical and training support. The San Diego HMIS allows agencies to use a regional web-‐based client management system to enter client information, track services, referrals, shelter stays, and goals/outcomes. Agencies can collaborate with other providers to ensure clients are receiving all available services and not obtaining duplicate services. The use of the HMIS is mandated by the U.S. Department of Housing and Urban Development (HUD) for every continuum of care in the country through its Supportive Housing Program (SHP). • The San Diego County HMIS has a long-‐held reputation with HUD as being one of the top HMIS projects in the nation. At a HUD conference in Denver (September 2010) the RTFH was received the following recognition: “The AHAR Herculean Effort Award honors communities that go above and beyond data collection efforts to produce high quality AHAR. This year we honor the RTFH who worked tirelessly to submit data for the San Diego region. The RTFH took the time to put together extra data to confirm data quality. This extra effort led to a greater understanding of local data and seasonal bed fluctuations.” • The RTFH is responsible for implementation and support of the HMIS for 45+ homelessness service agencies and 300+ unique programs, including the data warehouse. The RTFH provides technical support, training, reporting and data quality assistance to 400+ users. • The RTFH has been very fortunate to partner with Father Joe’s Villages (FJV) and San Diego State University’s Institute of Public Health (IPH) to manage our regional data warehouse. The data warehouse is designed to combine data from disparate systems such as ServicePoint and CSTAR (a component of HMIS created and customized by FJV) which allows us to obtain unduplicated counts of clients served and to provide regional reports. • Father Joe’s Villages (FJV) took the lead to create, pilot, and fund the original data merge and AHAR tools which has made participation in the national AHAR possible. 5 http://www.hud.gov/offices/cpd/homeless/hmis/ 6 http://www.co.san-‐diego.ca.us/sdhcd/homeless/index_homeless.html Regional Task Force on the Homeless (RTFH) Regional Homeless Profile 2010 Page 5 of 114
- 7. Regional Continuum of Care Council (RCCC)7 Since the early 1990s, the U.S. Dept. of Housing and Urban Development (HUD) has required communities to assess homeless “According to the latest San Diego County grand jury report, a needs as part of the McKinney-‐Vento Act Continuum of Care (CoC) regional solution is needed to competitive funding process. Each CoC is required to undertake a reduce the number of homeless comprehensive public-‐private planning process that assesses local on San Diego-area streets. services; takes inventories of emergency, transitional, and permanent Plans should include year-round supportive housing for homeless persons; and determines homeless shelters.” needs through counts of persons in shelters and on the street. San Diego Union-Tribune MAY 22, 2010 The San Diego region has developed a system of coordinated services to address the needs of persons who are homeless. The mission of the RCCC is to engage organizations in a community-‐based process that works to address the underlying causes of homelessness and to lessen the negative impact on individuals, families and communities. The RCCC is comprised of representatives of local jurisdictions, community-‐based organizations, local housing authorities, government, academia, health service agencies, homeless advocates, consumers, the faith community, and research, policy and planning groups. This countywide organization develops and implements strategies, disseminates information, and provides a comprehensive vision for entities seeking to prevent and alleviate homelessness. RCCC representatives serve an immense geographic area and a diverse homeless population. To be effective, the CoC delivery system must meet the challenges this geography and population pose. To this end, the system provides for the particular demands of the City of San Diego and the larger cities with high concentrations of homeless persons. STRATEGIC GOALS • Ensure access for homeless persons to quality services and facilities in all phases of the Continuum of Care system (from street outreach to permanent housing.) • Coordinate services throughout the region to ensure that each special needs population has access to services in each geographic sub-‐region (evidence-‐based distribution of resources to ensure care for all groups.) • Provide a seamless system of care for the homeless to transition from the streets to permanent housing (“no wrong door”.) • Support development of a strategic plan to address homelessness in San Diego County. • Foster the plan for a permanent system focused on solving the root causes of homelessness 7 http://www.sdcounty.ca.gov/sdhcd/homeless/supportive_housing_program.html Regional Task Force on the Homeless (RTFH) Regional Homeless Profile 2010 Page 6 of 114
- 8. National Perspective – A Snapshot8 • The 2009 Annual Homeless Assessment Report (AHAR) (on page 14) reported 643,067 persons who were homeless throughout the United States. • Cities with populations exceeding 500,000 people account for 51% of the homeless population counted in urban areas • The rate of homelessness in urban areas is three times higher than the rates of homelessness in rural areas. • The next several pages, outlines a national and local perspective regarding… o Family Homelessness on page 8 o Youth Homelessness on page 9 o Veteran Homelessness on page 10 o Chronic Homelessness on page 11 8 National Alliance to End Homelessness -‐ 2009 Regional Task Force on the Homeless (RTFH) Regional Homeless Profile 2010 Page 7 of 114
- 9. FAMILY HOMELESSNESS9 • Throughout the United States, approximately 238,100 persons in families are homeless and 75,518 households are homeless on any given night10. • The majority of families experiencing homelessness are able to bounce back quickly, with relatively little public assistance. • Often, families experiencing homelessness require rental assistance, housing placement services, job assistance, and other short-‐term, one-‐time services before being able to return to independence. • Families experiencing homelessness are under considerable stress. They move frequently and many are doubled-‐up in overcrowded apartments with relatives or friends. Others sleep in cars and campgrounds, or send their children to stay with relatives to avoid shelter life. Homelessness increases the likelihood that families will separate or dissolve, which may compound the stress that the family feels. • Homeless mothers have three times the rate of Post Traumatic Stress Disorder (PTSD). • They have ulcers at four times the rate of other women. • In the San Diego region (persons in shelters): o 38% are family members § approximately 3 in 4 of children in these families are elementary age o 61% are individuals 9 The National Center on Family Homelessness -‐ 2009 10 Annual Homeless Assessment Report (AHAR)– 2009. Regional Task Force on the Homeless (RTFH) Regional Homeless Profile 2010 Page 8 of 114
- 10. YOUTH HOMELESSNESS • An estimated 50,000 youth experience long-‐term Homeless youth engage homelessness in the United States. The large majority of in risky behaviors, such as young people experience short-‐term homelessness. unprotected sex, sex with multiple partners, • Youth presents a particular challenge for several reasons; intravenous drug use and needle sharing, that there is little definitive data, and often they don’t interact place them at high risk with standard homeless assistance programs or government for contracting HIV/AIDS. agencies. Also, some services are often not applicable to (Wagner, L.S., 2001) minors (e.g., ineligible to rent an apartment). • The McKinney-‐Vento Act supports the rights to education for homeless children and mandates that all school districts identify a liaison to help homeless children to continue their education. The San Diego region has also worked to ensure that homeless youth have acccess to educational programs specific to their needs. • In 2008, the California Dept. of Justice reported 7,587 youth as runaways in San Diego County. There are only 85 beds targeted to homeless youth on their own in the San Diego regional Continuum of Care. CHILD HOMELESSNESS IN CALIFORNIA11 • Number of homeless children (292,624) o California Rank -‐ 49TH (1st is best, 50th worst) • 3.08% are homeless -‐ out of all children • 13% homeless among children living in poverty o Under 6 years 122,902 o Grades K-‐8 (enrolled) 135,766 o Grades 9-‐12 (enrolled) 33,956 o TOTAL 292,624 11 The National Center on Family Homelessness -‐ http://www.homelesschildrenamerica.org/pdf/report_cards/short/ca_short.pdf Regional Task Force on the Homeless (RTFH) Regional Homeless Profile 2010 Page 9 of 114
- 11. VETERAN HOMELESSNESS12 • The Department of Veterans Affairs estimates that there are 131,000 homeless veterans throughout the country, which accounts for 20% of the entire homeless population (13% of whom are sheltered at any point in time.)13 • 8% of the overall U.S. population can claim veteran status. • San Diego’s 2010 PIT count estimated 22.9% of persons on the street were veterans, higher than the national average. • Veterans often become homeless due to war-‐related disability (e.g., physical disability, mental anguish, post-‐traumatic stress, etc.) • Roughly 56% of all homeless veterans are African American or Hispanic, despite only accounting for 12.8% and 15.4% of the U.S. population respectively. • About 1.5 million other veterans are considered at risk of homelessness due to poverty, lack of support networks, and dismal living conditions in overcrowded or substandard housing. • In addition to the myriad factors influencing homelessness for anyone, the crisis related to the shortage of affordable housing, livable income and affordable health care – many displaced and at-‐risk veterans live with post-‐traumatic stress disorder (PTSD) and substance abuse, which are magnified by a lack of family and social support networks. • San Diego County is home to more recently separated veterans than anywhere else in the country14 o San Diego County: 27,080 (48.3% higher than L.A. County) o Los Angeles County: 14,000 (next highest in the country) • Stand Down is an annual week-‐end community-‐ based intervention program that helps homeless veterans combat life on the streets. Started in San Diego in 1988, it is now a national program that has been replicated throughout the country. • A “hand up, not a handout” philosophy is carried out through the work of thousands of volunteers throughout the nation. In 2010, Stand Down San Diego served 947 homeless veterans, up from 928 served in 2009. 12 National Coalition for Homeless Veterans 13 HUD – AHAR 2009 14 http://www1.va.gov/homeless/ Regional Task Force on the Homeless (RTFH) Regional Homeless Profile 2010 Page 10 of 114
- 12. CHRONIC HOMELESSNESS • Chronic homelessness involves either long-‐term and/or repeated homelessness coupled with a disability (mental or physical). • There are approximately 110,917 chronically homeless individuals nationwide on any given night15. Persons who are chronically homeless consume a disproportionate amount of publically funded services. • An estimated 63% of people who experience homelessness at any given point in time are single adults. Most enter and exit the homeless system fairly quickly. The remainder live in the homeless assistance system; shelters, hospitals, jails, and prisons; or on the streets. • An overwhelming majority (80%) of single adult shelter users enter the homeless system only once or twice, stay just over a month, and do not return. • Approximately 9% enter nearly five times a year and stay nearly two months each time. This group utilizes 18% of the system’s resources. • The remaining 10% enter the system just over twice a year and spend an average of nine months per stay— virtually living in the system and utilizing nearly half its resources. Many of these individuals are defined by HUD as chronically homeless. They often cycle between homelessness, hospitals, jails, and other institutional care and often have a complex medical problem, a serious mental illness like schizophrenia, and/or alcohol or drug addiction. • Despite the difficulties in serving chronically homeless people, many cities have launched initiatives to end chronic homelessness, including San Diego. The San Diego HMIS is an advanced data system that is able to track reductions for people who are living in shelters. • Many cities are also documenting the cost effectiveness of ending chronic homelessness. Portland found that 35 chronically homeless individuals each utilized over $42,000 in public resources per year. After entering permanent supportive housing, those individuals each used less than $26,000, (including the cost of housing). • The successes provide insight to effective strategies in ending chronic homelessness. Ending chronic homelessness requires permanent housing with supportive services, and implementing policies to prevent high-‐risk people from becoming chronically homeless. 15 Annual Homeless Assessment Report (AHAR)– 2009 Regional Task Force on the Homeless (RTFH) Regional Homeless Profile 2010 Page 11 of 114
- 13. • One model for housing people who experience chronic homelessness is permanent supportive housing (PSH) which combines affordable rental housing with supportive services: case management, mental health and substance abuse services, health care, and employment. • Another model, ‘Housing First’, provides immediate access to an apartment without requiring participation in psychiatric treatment or treatment for sobriety. After settling into housing, clients are offered a wide range of supportive services that focus primarily on helping them maintain their housing. • New initiatives focus on people who are leaving hospitals, psychiatric facilities, substance abuse treatment programs, prisons, and jails (see: Innovations and Initiatives in The San Diego Region -‐ on page 81) • In the San Diego region (on page 37): o In the 2010 Point-‐In-‐Time count, 24.3% were “To be homeless literally means that you have no home to live in, that you considered to be chronically homeless. are deprived of your sense of place o The majority were male 94.4% and privacy, your sense of belonging – all essential elements of identity, of self-worth.” New England Journal of Public Policy Regional Task Force on the Homeless (RTFH) Regional Homeless Profile 2010 Page 12 of 114
- 14. II. San Diego County Regional Data Summary - 2010 The Regional Homeless Profile summary data is addressed in the following sections: The Annual Homeless Assessment Report (AHAR) -‐ on page 14 • The AHAR is an annual report to Congress (mandated by McKinney-‐Vento -‐ on page 101) about the number and characteristics of people who use homeless residential services, and their patterns of use. The AHAR includes data on emergency shelters, transitional housing, and homeless veterans from two primary sources: the HMIS and the Point-‐In-‐Time (PIT). Summary By City I -‐ Point-‐In-‐Time (PIT) count – 2010 -‐ on page 24 • Summarizes homeless counts by each city in San Diego County. Summary By City II -‐ Point-‐In-‐Time (PIT) count – 2010 -‐ on page 25 • Summarizes homeless counts by each city along with population and income levels. Demographics – San Diego County -‐ on page 26 • Approximate aggregate summaries of primary demographic data (e.g., age, ethnicity, etc.) by different populations: unsheltered, emergency shelter, transitional housing. Unmet Needs in the San Diego Region -‐ on page 27 • Summary data regarding shelter bed usage, capacity, overlow. Point-‐In-‐Time (PIT) ‘Unsheltered Survey’ Executive Summary -‐ on page 29 • The Unsheltered Survey (on page 97) detail is summarized. Point-‐In-‐Time (PIT) Survey Results -‐ on page 30 • On January 29, 2010, the RTFH coordinated the work of hundreds of volunteers in order to conduct our annual Point-‐In-‐Time count (PIT). • In February, 2010, the RTFH and volunteers completed an ‘Unsheltered Street Characteristic Survey (on page 97). Results from that survey begin on page 31. Regional Task Force on the Homeless (RTFH) Regional Homeless Profile 2010 Page 13 of 114
- 15. The 2009 Annual Homeless Assessment Report (AHAR)16 • The AHAR is an annual report to Congress about the number and characteristics of people who use homeless residential services, and their patterns of use. Congress mandated this report in legislation for McKinney-‐Vento funding. • The AHAR includes data on emergency shelters, transitional housing programs, and homeless veterans from two primary sources: the HMIS and the Point-‐In-‐Time (PIT) counts for the reporting period, October 1 – September 30. • Data to be included AHAR is specified by HUD’s “universal data elements” (e.g., demographics, veteran status, disability status, previous housing, length of stay, etc.) • One goal of the AHAR is to produce an “unduplicated”17 count of all homeless persons in the United States and, on the basis of that information, develop a descriptive profile of the homeless population that uses these types of services throughout the nation. • The AHAR provides counts of homelessness nationwide—including counts of individuals, families, and demographics such as veterans and those who are chronically homeless. • The report also covers the types of locations where people use emergency shelters and transitional housing; prior living conditions just before they entered a residential program; how much time they spent in shelters over the course of a year; and the size and use of the U.S inventory of residential programs for homeless people. DATA FROM THE 2009 AHAR • While overall homelessness has increased in the past year, the national January 2009 Point-‐ In-‐Time (PIT) estimate of chronic homelessness is 110,917, more than a 10% drop from the PIT count of 124,135 chronically homeless people in 2008. • All of the decrease occurred among unsheltered chronically homeless people. While measuring the scope remains challenging, a majority of Continuums of Care (53%) reported a decrease in chronic homelessness between 2008 and 2009. • Homelessness is heavily concentrated in large coastal states, with California, New York, and Florida accounting for 39% of the PIT count in 2009. • On a single night in January 2009, the states with the highest concentrations of homeless people were Nevada, where .85% of the total population was homeless, followed by Oregon, Hawaii, California, and Washington. • Kansas, South Dakota, and West Virginia had the lowest concentrations of homelessness. AHAR – San Diego Regional Summary -‐ 200918 16 HUD – AHAR 2009 17 Individuals are only counted once regardless of the number of programs they enter. Records in the HMIS are unduplicated by using an algorithm (provided by HUD) to compare the First Name, Last Name, SSN, DOB, and Gender. Clients with matching identifiers are assumed to be the same client. Regional Task Force on the Homeless (RTFH) Regional Homeless Profile 2010 Page 14 of 114
- 16. The San Diego Regional Annual Homeless Assessment Report (SD-‐AHAR) provides information about the sheltered homeless population based on data collected in the HMIS. The main objective of the SD-‐AHAR is to report the number and demographic characteristics of people who use homeless residential services in the San Diego County Region using methodology consistent with the Continuum of Care-‐specific AHAR reports submitted to HUD. The San Diego Region includes both the San Diego City Continuum of Care and the San Diego County Continuum of Care. DATA INCLUDED IN THIS AHAR The 2009 SD-‐AHAR includes data from October 1, 2008 through September 30, 2009. All homeless shelter providers with good quality HMIS data from this time period were included (“participating” providers). Data in the AHAR includes HUD Universal Data Elements (UDE) from ServicePoint HMIS (Bowman Systems) merged with CSTAR HMIS (Father Joe’s Villages). This merge allows for unduplicated counts of persons entered into HMIS within the entire San Diego Region. WHO IS COUNTED IN THE AHAR Included: data describing persons who were sheltered in “participating” emergency shelters or transitional housing in the San Diego Region during the reporting period are in the AHAR. Not included: Data obtained from stays in permanent supportive housing, safe havens, youth and domestic violence programs, shelters not using HMIS or shelters with poor quality HMIS data19. REPORTING CATEGORIES Data is presented according to four AHAR reporting categories organized by shelter type and whether or not shelter was obtained as part of a family. • Persons in Families in Emergency Shelters (ES-‐FAM) • Persons in Families in Transitional Housing (TH-‐FAM) • Individuals in Emergency Shelters (ES-‐IND) • Individuals in Transitional Housing (TH-‐IND) For AHAR purposes, HUD defines persons in families as persons in households with at least one child, aged 17 or younger, and at least one adult, aged 18 or older. All persons not in a family are considered individuals – this includes single adults, unaccompanied youth, persons in multi-‐adult households and persons in multi-‐child households. Persons are counted only once in each category, but may be represented in two or more categories if they changed family status or were present in both shelter types. Demographic data and data collected at program entry is presented by category and cannot be summed into regional totals without double-‐ or triple-‐counting persons present in more than one category. 18 The SD-‐AHAR section was prepared by SDSU’s Institute for Public Health -‐ http://iph.sdsu.edu/ 19 Data from very few HMIS “participating” shelters was excluded – reasons for inadequate data included programs undergoing site closure (one ES-‐IND program and one TH-‐FAM program), misunderstanding of family/household data entry (one ES serving both FAM and IND) and a seasonal program (ES) with prior years’ end-‐date issues Regional Task Force on the Homeless (RTFH) Regional Homeless Profile 2010 Page 15 of 114
- 17. DATA LIMITATIONS Not all programs serving homeless in San Diego are included in the 2009 SD-‐AHAR, and not all persons accessing homeless services in San Diego are counted in the AHAR. Therefore, the numbers reflected here are representative of the majority of persons sheltered during the time period, but may not be applicable to persons in populations sheltered by programs not included in the report. SELECT HIGHLIGHTS FROM THE 2009 SD REGIONAL AHAR A total of 10,040 persons spent at least one night in a “participating” San Diego emergency shelter (ES) or transitional housing (TH) program during the AHAR reporting period, of October 1, 2008 to September 30, 2009. It is estimated that 92% of the region’s year-‐round-‐equivalent beds20 were available at AHAR “participating” providers. About two-‐thirds (64.5%) of sheltered persons were individuals and one-‐third (35.5%) were persons in families. This proportion matches that reported for the nation in the 2009 Annual Homeless Assessment Report to Congress21 Persons Sheltered at AHAR Participating Providers During a One-‐Year-‐Period in the San Diego Region (October 1, 2008 to September 30, 2009; HMIS data) Persons in Persons in Individuals in Individuals in Families in Families in Emergency Transitional Total Emergency Transitional Shelters Housing Shelters Housing 22 23 Total Unduplicated Counts 1172 2288 3704 4411 10040 Persons on an Average Night 85 959 329 1569 2942 Age24 • Children represented 61% of persons sheltered as part of a family in both Emergency Shelters and Transitional Housings o 705 (61%) in ES-‐FAM were children, aged 17 or less o 1389 (61%) in TH-‐FAM were children, aged 17 or less • A large proportion of children sheltered as part of a family were under the age of 6. o 322 (46%) of children in families at ES were under age 6 o 692 (50%) of children in families at TH were under age 6 • Less than one-‐tenth of adults sheltered as part of a family were over the age of 50 while nearly one-‐third of persons sheltered as individuals were over 50 years old. o 30 (7%) of adults in families at ES were aged 51 or greater o 36 (4%) of adults in families at TH were aged 51 or greater o 1233 (34%) of adult individuals at ES were aged 51 or greater o 1355 (31%) of adult individuals at TH were aged 51 or greater • Nearly all sheltered individuals were adults (98% in ES-‐IND; 99% in TH-‐IND). Individuals under 18 include unaccompanied youth or multi-‐child households – siblings or juvenile parents with children. 2020 Year-‐round-‐equivalent beds are calculated based on the amount of time a bed is available for use during the year. Hotel-‐Motel Voucher program “beds” are calculated based the number of beds required, assuming a person used their voucher for the all dates issued. 21 The 2009 Annual Homeless Assessment Report to Congress, HUD, Office of Community Planning and Development, June 2010 22 A subset of persons are represented in more than one reporting category. Category totals cannot be summed together to arrive at a grand total. 23 Total unduplicated count of persons sheltered at one or both of the program types, as an Individual, a member of a Family or Both. 24 Age is calculated at First Program Entry or October 1, 2008 First Program Entry was prior to that date Regional Task Force on the Homeless (RTFH) Regional Homeless Profile 2010 Page 16 of 114
- 18. Select Highlights from the 2009 SD Regional AHAR, continued… Gender • A large majority of adults sheltered as part of a family were female o 362 (81%) in ES-‐FAM were female o 707 (79%) in TH-‐FAM were female • The majority of adults sheltered as individuals were male o 2444 (67%) in ES-‐IND were male o 3347 (77%) in TH-‐IND were male • The gender of children in families was close to a 50-‐50 male-‐female split for both shelter types Race • Over half (54%) of persons in families at Emergency Shelters were identified as “White,” while two-‐thirds (64-‐67%) of persons in each of the other reporting categories were identified as “White” • No more than 5% of persons in each reporting category were identified as either “Asian”, or “American Indian or Alaska Native”, or “Native Hawaiian or other Pacific Islander” Veteran Status • Very few adults sheltered as part of a family were identified in HMIS as military veterans, while over one-‐ fifth of adults accessing Emergency Shelters as individuals and nearly one-‐third of adults accessing Transitional Housing as individuals were identified as military veterans o 13 (3%) of adults in families in ES were veterans o 40 (4%) of adults in families in TH were veterans o 791 (22%) of adults not in families in ES were veterans o 1334 (31%) of adults not in families in TH were veterans o 26% of total sheltered adults not in families were veterans o 22% of total adults were veterans Disabling Condition25 • Over three-‐quarters of adults accessing Transitional Housing as individuals were identified as having a disabling condition. o 3337 (77%) of adults not in families in TH-‐IND had a disabling condition • Over half of adults accessing Emergency Shelters as individuals were identified as having a disabling condition o 2071 (57%) of adults not in families in ES-‐IND had a disabling condition • Less than one-‐third of adults in families accessing Emergency Shelters were identified as having a disabling condition in HMIS while for adults in families accessing Transitional Housing nearly half were identified as having a disabling condition in HMIS o 135 (30%) of adults in families in ES-‐FAM had a disabling condition o 430 (48%) of adults in families in TH-‐FAM had a disabling condition 25 Disabling Condition is a specific disability of long term duration which significantly impedes a person’s ability to live independently; Persons were counted as having a disabling condition if the HMIS response value “Yes” was recorded at any program stay within the reporting year. Regional Task Force on the Homeless (RTFH) Regional Homeless Profile 2010 Page 17 of 114
- 19. Select Highlights from the 2009 SD Regional AHAR, continued… Previous Living Situation for adults the night before shelter program entry26 • One half of adult individuals spent the night before program entry in a place not meant for human habitation (on the street, in a car, etc) o Adult individuals the night before entry into an Emergency Shelter § Place not meant for human habitation – 1854 (50%) o Adult individuals the night before entry into a Transitional Housing program § Place not meant for human habitation – 2267 (51%) • Adults in families spent night before program entry in a variety of places: o Adults the night before entry into an Emergency Shelter as part of a family § Emergency Shelter – 67 (15%) § Staying with Family – 58 (13%) § Rented Housing – 57 (13%) § Staying with Friends – 51 (11%) § Place not meant for human habitation – 48 (11%) o Adults the night before entry into a Transitional Housing program as part of a family § Emergency Shelter – 199 (22%) § Staying with Family – 133 (15%) § Place not meant for human habitation – 137 (15%) § Transitional Housing – 123 (14%) 26 If a person had more than one program entry during the reporting year, the value reported represents data collected at the first program entry Regional Task Force on the Homeless (RTFH) Regional Homeless Profile 2010 Page 18 of 114
- 20. Select Highlights from the 2009 SD Regional AHAR, continued… Program Use • Point-‐in-‐Time counts of HMIS data in October 2008, January, April and July 2009 showed stable levels of sheltered persons in Transitional Housing (TH), while Emergency Shelters (ES) were accessed at a greater number in January compared to the other PIT dates. o Persons in families in ES § 1.3 to 1.7 times as many sheltered on a single night in January compared to a single night in October, April or July o Individuals in ES § 3 to 4 times as many sheltered on a single night in January compared to a single night in October, April or July • Of the 10,040 persons counted during the year, a large percentage (85%) was counted within single reporting categories. Nonetheless, a significant number of persons were served by both Emergency Shelters (ES) and Transitional Housing (TH) programs at some point in the year. o 8543 (85%) were counted in only one reporting category o 1462 (15%) were counted in two reporting categories, e.g.: § 343 persons were counted in both ES-‐FAM and TH-‐FAM only § 1010 persons were counted in both ES-‐IND and TH-‐IND only o 35 (<1%) were counted in three or four reporting categories, e.g.: § 21 persons were counted in ES-‐FAM, TH-‐FAM and ES-‐IND • Persons Sheltered as part of a Family vs. Persons Sheltered as Individuals o Individuals: 6949 (69% of 10,040) of persons served were sheltered as an individual only – never part of a family § Of the 6949 persons served as individuals never in a family, • 1010 (15%) of spent time in BOTH Emergency Shelters and Transitional Housing at some time during the reporting year • 2608 (38%) stayed in Emergency Shelter only • 3331 (48%) stayed in Transitional Housing only o Persons in Families: 2947 (29% of 10,040) of persons served were sheltered as a member of a family only – never an individual § Of the 2947 persons served only as part of a family, • 343 (12%) of spent time in BOTH Emergency Shelters and Transitional Housing at some time during the reporting year • 778 (26%) stayed in Emergency Shelter only • 1826 (62%) stayed in Transitional Housing only o Both: only 144 (1% of 10,040) of those sheltered during the year were identified as both a member of a sheltered family and a person sheltered as an individual Regional Task Force on the Homeless (RTFH) Regional Homeless Profile 2010 Page 19 of 114
- 21. SELECT DETAILS FROM THE 2009 SAN DIEGO REGIONAL AHAR Persons Sheltered -‐ 2009 SD-‐AHAR (October 1, 2008 to September 30, 2009; HMIS data) Persons in Persons in Individuals Individuals Families in Families in in Emergency in Transitional Total Emergency Transitional Shelters Housing Shelters Housing Total 28 Unduplicated 1172 2288 3704 4411 10040 27 Counts Persons on an 85 959 329 1569 2942 Average Night Point-‐in-‐Time Counts – 2009 SD-‐AHAR (October 1, 2008 to September 30, 2009; HMIS data) Persons in Persons in Individuals Individuals On a Families in Families in in Emergency in Transitional Total single night in… Emergency Transitional Shelters Housing Shelters Housing October 2008 73 917 155 1512 2657 January 2009 105 930 637 1563 3235 April 2009 62 902 208 1545 2717 July 2009 82 913 155 1565 2715 Age29 – 2009 SD-‐AHAR (October 1, 2008 to September 30, 2009; HMIS data) Persons in Families in Persons in Families Individuals Individuals Emergency in Transitional in Emergency in Transitional Shelters Housing Shelters Housing Under 1 69 (6%) 195 (9%) 9 (0%) 8 (0%) 1 to 5 253 (22%) 497 (22%) 20 (1%) 6 (0%) 6 to 12 261 (22%) 452 (20%) 13 (0%) 1 (0%) 13 to 17 122 (10%) 245 (11%) 15 (0%) 35 (1%) 18 to 30 170 (15%) 409 (18%) 558 (15%) 701 (16%) 31 to 50 245 (21%) 449 (20%) 1856 (50%) 2305 (52%) 51 to 61 26 (2%) 34 (1%) 1006 (27%) 1159 (26%) 62 and older 4 (0%) 2 (0%) 227 (6%) 196 (4%) Unknown 22 (2%) 5 (0%) 0 (0%) 0 (0%) 27 A subset of persons are represented in more than one reporting category. Category totals cannot be summed together to arrive at a grand total. 28 Total unduplicated count of persons sheltered at one or both of the program types, as an Individual, a member of a Family or Both. 29 Age is calculated at First Program Entry or October 1, 2008 if first program entry was prior to that date Regional Task Force on the Homeless (RTFH) Regional Homeless Profile 2010 Page 20 of 114