Generative Artificial Intelligence: How generative AI works.pdf
China E-commerce Analytics [Credit Suisse]
1. 12 November 2009
Asia Pacific/China
Equity Research
Consumer Internet (Internet) / OVERWEIGHT
China Internet Sector
Research Analysts
SECTOR REVIEW
Wallace Cheung, CFA
852 2101 7090
wallace.cheung@credit-suisse.com
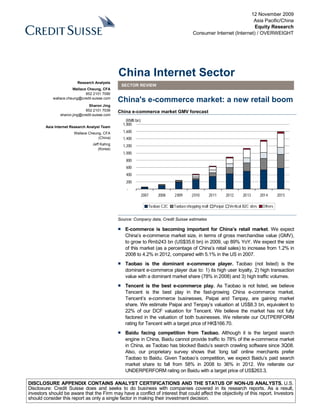
China's e-commerce market: a new retail boom
Sharon Jing
852 2101 7039 China e-commerce market GMV forecast
sharon.jing@credit-suisse.com
(RMB bn)
1,800
Asia Internet Research Analyst Team
Wallace Cheung, CFA 1,600
(China) 1,400
Jeff Kahng 1,200
(Korea)
1,000
800
600
400
200
-
2007 2008 2009 2010 2011 2012 2013 2014 2015
Taobao C2C Taobao shopping mall Paipai Vertical B2C sites Others
Source: Company data, Credit Suisse estimates
■ E-commerce is becoming important for China’s retail market. We expect
China’s e-commerce market size, in terms of gross merchandise value (GMV),
to grow to Rmb243 bn (US$35.6 bn) in 2009, up 89% YoY. We expect the size
of this market (as a percentage of China’s retail sales) to increase from 1.2% in
2008 to 4.2% in 2012, compared with 5.1% in the US in 2007.
■ Taobao is the dominant e-commerce player. Taobao (not listed) is the
dominant e-commerce player due to: 1) its high user loyalty, 2) high transaction
value with a dominant market share (78% in 2008) and 3) high traffic volumes.
■ Tencent is the best e-commerce play. As Taobao is not listed, we believe
Tencent is the best play in the fast-growing China e-commerce market.
Tencent’s e-commerce businesses, Paipai and Tenpay, are gaining market
share. We estimate Paipai and Tenpay’s valuation at US$8.3 bn, equivalent to
22% of our DCF valuation for Tencent. We believe the market has not fully
factored in the valuation of both businesses. We reiterate our OUTPERFORM
rating for Tencent with a target price of HK$166.70.
■ Baidu facing competition from Taobao. Although it is the largest search
engine in China, Baidu cannot provide traffic to 78% of the e-commerce market
in China, as Taobao has blocked Baidu’s search crawling software since 3Q08.
Also, our proprietary survey shows that ‘long tail’ online merchants prefer
Taobao to Baidu. Given Taobao’s competition, we expect Baidu’s paid search
market share to fall from 58% in 2008 to 36% in 2012. We reiterate our
UNDERPERFORM rating on Baidu with a target price of US$263.3.
DISCLOSURE APPENDIX CONTAINS ANALYST CERTIFICATIONS AND THE STATUS OF NON-US ANALYSTS. U.S.
Disclosure: Credit Suisse does and seeks to do business with companies covered in its research reports. As a result,
investors should be aware that the Firm may have a conflict of interest that could affect the objectivity of this report. Investors
should consider this report as only a single factor in making their investment decision.
2. 12 November 2009
Focus charts
Figure 1: Growth forecast for China’s e-commerce market Figure 2: e-commerce (as a % of retail sales) in the US
and China
(RMB bn) (%) (%)
8
1,800 128 200
89 7
1,600 71
53 100
1,400 40 28 20 17 6
1,200 814 - 5
1,000 739 4
-100
800 563 657
3
600 -200
775 2
400 446
324 620 -300 1
200 217 323 477
52 119 90 188
- 26 -400 -
4 9
2007 2008 2009 2010 2011 2012 2013 2014 2015 2002 2003 2004 2005 2006 2007 2008 2009E 2010E 2011E 2012E
B2C C2C YoY growth rate (%) China US
Source: iResearch, Credit Suisse estimates Source: iResearch, Company data, Credit Suisse estimates
Figure 3: Breakdown of China’s e-commerce market Figure 4: Taobao sellers’ storefront distribution
(C2C only) (on various C2C platforms)
(%) (%)
100 100
13 -
90 18 18 16
25
80 80
33 24
70 60 38 53
60
50 40 82
55 59
40 20 38 32
30
20 0
10 Blended <1 y ear 1-2 y ears 2-3 y ears >3 y ears
-
2007 2008 2009 2010 2011 2012 2013 2014 2015 Taobao shop age
Taobao Paipai Eachnet Youa Pure Taobao Taobao+Paipai Taobao+Paipai+others
Source: iResearch, Credit Suisse estimates Source: Credit Suisse estimates
Figure 5: Online payment market share (annual) in China Figure 6: Online merchants: “Which P4P advertising is
better?”
(%)
60
50 Baidu
40 0%
30 Same
20 3%
Taobao
10 97%
0
2007 2008 2009 2010 2011 2012 2013 2014 2015
Alipay Tenpay Shanghai Unionpay Others
Source: iResearch, Credit Suisse estimates Source: Credit Suisse estimates
China Internet Sector 2
3. 12 November 2009
China’s e-commerce market: a new
retail boom
e-commerce – from scale to profit
We are positive on the long-term growth of China’s e-commerce market, including both China’s e-commerce market
B2C and C2C, and expect its size, based on gross merchandise value (GMV), to increase (as a percentage of retail
to Rmb887 bn in 2012, a CAGR of 54% from 2009 to 2012. We expect the size of China’s sales) up from 1.2% in 2008
e-commerce market (as a percentage of China’s retail sales) to increase from 1.2% in to 4.2% in 2012
2008 to 4.2% in 2009 due to competitive pricing, convenience, and national coverage.
We expect China’s e-commerce companies to play an important role in China’s retail e-commerce will play a vital
market and remain competitive in the retail space due to: (1) better data mining and role in China’s retail market
working capital management capabilities, (2) ability to constantly interact with customers,
and (3) supportive government policies. A few e-commerce companies in China are
expanding through multi-channel strategies and are building a network of physical stores.
Unlike the US market, China’s e-commerce market is dominated by the C2C business C2C is the key business
model and has a highly concentrated market structure. In 2008, C2C accounted for 93% of model; Taobao accounted
the total e-commerce GMV. Taobao is the dominant player with a 2008 market share of for 82% of the C2C market
82%, followed by Paipai, owned by Tencent Holdings (0700.HK, HK$138.60,
OUTPERFORM, TP HK$153.60), at 10%.
The contribution of B2C’s market to the e-commerce market will rise from 7% in 2008 to Taobao‘s shopping mall also
36% in 2012. We expect Taobao’s mall to account for 38% of B2C market in 2009. dominant in the B2C market
Payment – the e-commerce highway
The third-party online payment platform, instead of credit cards, is the dominant payment Alipay, a sister company of
method in China’s e-commerce market. We expect the online payment platform’s TPV to Taobao, had an online
grow to Rmb566 bn in 2009, up 106% YoY. Alipay (not listed), Tenpay (owned by payment market share of
Tencent) had a TPV market share of 50.7% and 19.3%, respectively, in 2008. We believe 50.7%
Taobao’s owes a part of its success to the launch of Alipay, the sister company of Taobao.
We expect Alipay to remain the largest online payment platform in China in the near future.
Search versus e-commerce – ‘Yin-Yang’
The link between e-commerce and general search engines in China is much weaker than Baidu not linked to 78% of
that in the global market. Taobao has blocked Baidu’s crawling software (technology to e-commerce market
acquire information from websites online) since 3Q08. Baidu cannot directly provide
search traffic to Taobao, and the latter accounts for 78% of e-commerce market. Also,
Taobao launched its independent search engine in October 2009. Finally, based on our
survey, 97% of online merchants prefer Taobao’s pay-for-performance (P4P) advertising
products, instead of Baidu’s. Taobao and Baidu are competing in the long term.
Taobao is a valuable company due to its: (1) high user stickiness, (2) dominant market We estimate Taobao’s
share, and (3) high traffic volumes. Based on public information, we expect Taobao’s DCF valuation at US$12.0 bn,
enterprise value to be US$12.0 bn, translating into a 2010E non-GAAP P/E of 75x. equal to 75x 2010E P/E
Tencent’s Paipai and Tenpay are gaining market share. We estimate Paipai and Tenpay Paipai and Tenpay should
to account for US$8.3 bn of the valuation, 22% of our DCF valuation for Tencent. We contribute to 22% of our
believe the market has not factored in the valuation of both businesses fully. We reiterate valuation for Tencent
our OUTPERFORM rating on Tencent with a target price of HK$166.70.
Despite being the largest search engine in China, Baidu’s paid search business will face Baidu’s paid search
competition from Taobao. We expect Taobao’s search market share to rise from 3% in business to face competition
2008 to 22% in 2012, whereas Baidu would be down from 58% in 2008 to 36% in 2012. from Taobao
We reiterate our UNDERPERFORM rating on Baidu with a target price at US$263.3
China Internet Sector 3
5. 12 November 2009
Table of contents
e-commerce – from scale to profit ..................................................................................... 6
History of China’s e-commerce market.......................................................................... 6
Reasons behind e-commerce expansion in China......................................................... 6
e-commerce market growth estimate ............................................................................ 7
e-commerce growth drivers........................................................................................... 8
Is e-commerce important for China’s retail market? .................................................... 10
Price competitiveness of the e-commerce platform ..................................................... 14
Difference between the US and China e-commerce markets ...................................... 16
C2C market – on its way to profitability ....................................................................... 19
B2C market – still seeking the right business model.................................................... 25
Online shoppers’ demographics – consumer survey ................................................... 28
Online merchants’ profiles - Taobao seller survey ....................................................... 38
Payment – the e-commerce highway............................................................................... 46
What is an online payment platform? .......................................................................... 46
Third-party online payment market.............................................................................. 46
Alipay has contributed to Taobao’s success................................................................ 52
Search versus e-commerce – ‘yin-yang’ .......................................................................... 54
e-commerce companies reliant on search engines?.................................................... 54
Baidu and Taobao – on the path to direct competition................................................. 56
C2C platform for P4P advertising – for ‘long tail’ online merchants.............................. 60
Paid search market – Baidu’s share to fall due to Taobao........................................... 65
Taobao – elevating to the next level ................................................................................ 66
Taobao – basics.......................................................................................................... 66
Strategies.................................................................................................................... 67
Challenges.................................................................................................................. 71
Monetisation and Valuation ......................................................................................... 72
Tencent Holdings (0700.HK / 700 HK)............................................................................ 75
‘Crouching tiger, hidden dragon’.................................................................................. 75
Background................................................................................................................. 76
Products...................................................................................................................... 76
Strategies.................................................................................................................... 76
Business model........................................................................................................... 78
Monetisation and valuation.......................................................................................... 78
Financial forecast........................................................................................................ 80
Baidu Inc (BIDU.OQ / BIDU US)..................................................................................... 83
Rebuilding the missing link of e-commerce ................................................................. 83
NetEase.com (NTES.OQ / NTES US) ............................................................................ 85
Value of shopping search not yet unveiled .................................................................. 85
Appendix I: Regulatory .................................................................................................... 87
Expect positive policies to be released........................................................................ 87
Online store registration .............................................................................................. 88
Online payment or third-party payment platform.......................................................... 88
e-commerce taxation................................................................................................... 89
Other e-commerce rules ............................................................................................. 89
Appendix II: e-commerce company profiles ..................................................................... 91
Vancl........................................................................................................................... 91
M18 (MecoxLane) ....................................................................................................... 91
Eachnet ...................................................................................................................... 92
360buy ........................................................................................................................ 92
Joyo ............................................................................................................................ 93
Zbird ........................................................................................................................... 94
Appendix III: Case studies ............................................................................................... 95
China Internet Sector 5
6. 12 November 2009
E-commerce – from scale to profit
History of China’s e-commerce market
China’s e-commerce market has experienced 10 years of development till now. The first
e-commerce company in China was 8848, a B2C site founded in 1999. According to AC
Nielsen, China has about 3,000 B2C companies currently.
Figure 8: Milestones in China e-commerce market
Year Company Milestone
1999 8848 Founded (China's first online B2C company)
Eachnet Founded
2000 8848 Monthly revenue reached Rmb10 mn
Joyo Founded by Kingsoft and Lenovo
2001 8848 Divided into two parts, B2C and new business, and soon exited the market
2002 Eachnet EBay acquired 33% of Eachnet
2003 Eachnet EBay acquired the rest (66%) of Eachnet
Taobao Founded by Alibaba Group
Alipay Founded by Alibaba Group
2004 Joyo Amazon acquired 100% of Joyo at US$75 mn
2005 Paipai Launched by Tencent
2006 Eachnet EBay and Tom founded JV to co-operate with Eachnet
2008 Youa Launched by Baidu
Source: Company data, Credit Suisse
Reasons behind e-commerce expansion in China
E-commerce has a broad scope, including business-to-business (B2B), business-to-
consumer (B2C) and consumer-to-consumer (C2C). We define e-commerce as consumer-
related e-commerce i.e., only B2C and C2C.
We are positive on the long-term growth story of the e-commerce market in China:
We believe China’s general consumers are price-sensitive. E-commerce companies do Low price, low costs
not have to run physical stores, operate an on-the-ground sales team, or lower inventory
levels (without physical stores), resulting in significant cost savings. Channel costs are
also high, as general department stores share 20-30% of the revenues of the retailers and
franchise stores will likely share about 20% (some high-end shopping malls can take
40-50%). Finally, we believe many online merchants on the C2C platform are individuals
and have not deliberately paid taxes. The low operating cost structure allows e-commerce
companies to provide low-priced products. We believe low-price e-commerce platform is
attractive for general consumers in China. In the analysis on page 15, products sold on
e-commerce platform are, on average, 21% cheaper than that in physical stores.
A few branded companies or shopping malls have been providing differentiated pricing Price impartiality
strategies, e.g., different prices for different areas. However, e-commerce companies will
provide only one price point for all customers in the entire country.
After 10 years of development, logistics system and companies in China are robust. Most Convenience
logistics companies can ship products to most of the cities in China within three-seven
days. For instance, our best experience was the shipping of a product from Guangzhou to
Hong Kong within two days.
A large variety of products is available in tier-one cities. However, major brands’ physical National coverage
stores network do not cover all of the 300 prefecture-level cities, 370 county-level cities
and 1,600-plus counties in China. With the rising wealth in lower tier cities, e-commerce
provides national coverage for all products in China. Based on Credit Suisse China
Consumer Survey (see page 29), growth in e-commerce spend and time spent on online
China Internet Sector 6
7. 12 November 2009
shopping in tier-two cities are much stronger than that in tier-one cities. We expect e-
commerce market potential in tier-two cities to be much higher.
E-commerce provides a variety of products, besides products from the mainstream Product variety
brands. Consumers can find many niche products through search functions of e-
commerce companies or through general search engines. For instance, after buying a
dress in a physical store, a person can buy many accessories to complement her dress.
Besides branded retail companies, many small- to medium-scale retail stores do not have Extra consumer protection,
a well-planned product return policy. To increase consumer confidence, e-commerce improved customer
platforms and companies are providing attractive product protection plans, e.g., one of the experience
Taobao’s customer protection plans “providing three times penalty if one product is fake”
(see page 23). Also, in order to further increase consumer confidence, M18 (Mexcolane),
one of the largest online apparel companies, sends courier staff to pick up returned goods
from customers’ premises. Finally, the popular third-party payment platforms, e.g. Alipay
and Tenpay, normally settle their online payments after a few days of purchase, normally
about seven. If they are not satisfied with the product quality, customers can hold up the
payment and seek dispute redressal. (See section on Payment – the e-commerce
highway.)
E-commerce market growth estimate
E-commerce market includes both B2C and C2C markets. According to iResearch, the
size of China’s e-commerce market was Rmb128 bn (or US$18.3 bn) based on gross
merchandise value (GMV). We expect China’s e-commerce market to grow to Rmb243 bn,
up 89% YoY and to Rmb887 bn, a CAGR of 54% from 2009 to 2012.
Figure 9: Growth forecast for China’s e-commerce market
(RMB bn) (%)
2,000 128 150
89 71
1,800 53 40 28 20 50
1,600 17
1,400
814 -50
1,200 739
1,000 657 -150
800 563
-250
600
446
400 775
324 620 -350
200 52 477
217 323
4 119 90 188
- 9 26 -450
2007 2008 2009 2010 2011 2012 2013 2014 2015
B2C C2C YoY growth rate (%)
Source: iResearch, Credit Suisse estimates
In China’s e-commerce market, C2C is the dominant business model, accounting for 93% C2C is the dominant
of the total GMV in 2008. We expect share of the B2C market to increase in the future due business model
to: 1) rising consumer confidence in e-commerce and demand for B2C products, 2) larger
product variety, 3) traditional branded companies’ participation in e-commerce, and
4) Taobao’s diversion of its GMV into Taobao shopping malls.
Within the C2C market, Taobao is the dominant player with a 82% market share, followed Taobao is the dominant
by Paipai (operated by Tencent) at a 10% share and Eachnet (JV between eBay and TOM C2C player
Online) at 8%.
China Internet Sector 7
8. 12 November 2009
Figure 10: C2C market breakdown (2008) Figure 11: B2C market breakdown (2008)
Othe rs
20% Taobao mall
Paipai 21%
10%
Redb aby
4%
Taobao 139shop
4% 360 buy
82% Eachnet 16%
8% Vancl
4%
M18
Joyo
8% Dan gdang 12%
11%
Source: iResearch Source: iResearch
B2C market is more fragmented. In 2008, Taobao’s shopping mall was the largest player Fragmented B2C market
with a 20% market share, followed by 360buy (private company, a consumer electronics
platform) at 16%, Joyo (private company, owned by Amazon) and Dangdang (private
company, the largest book store player)
E-commerce growth drivers
We believe the underlying key growth drivers of China’s e-commerce market are as
follows.
China’s e-commerce market accounted for 1.2% of China’s retail sales in 2008, China’s e-commerce market
substantially lower than that of the US at 5.1% in 2007. Given sustainable economic will follow US’
growth, we expect China’s e-commerce market (as a percentage of retail sales) to be
close to that of the US market.
Figure 12: e-commerce market (excluding B2B) as a % of retail sales – China and the US
(%)
8
7
6
5
4
3
2
1
-
2002 2003 2004 2005 2006 2007 2008 2009E 2010E 2011E 2012E
China US
Source: comScore, iResearch, Credit Suisse estimates
China Internet Sector 8
9. 12 November 2009
We believe the rising Internet user base and e-commerce penetration rate are the key Rising Internet user base
growth drivers of China’s e-commerce market. According to China Internet Network and e-commerce
Information Center (CNNIC), China had 338 mn internet users in 1H09, up 33.6% YoY, penetration rate as key
representing a penetration rate of 25.6%. We expect the number of Internet users in China growth drivers
to grow to 571 mn by 2012 (a penetration rate of 39%) and 780 mn by 2020 (a penetration
rate of 57%). Also, China had 80 mn e-commerce users in 2008, representing a
penetration rate of 26% (as a percentage of China’s Internet user). (a Credit Suisse
Consumer survey in 2008 indicated a penetration rate of 31%.) We expect e-commerce
users to reach 287 mn in 2012 and e-commerce penetration rate to increase to 50.3%
by 2012.
Figure 13: Internet users and Internet penetration forecast Figure 14: e-commerce customers and penetration
forecast
(mn) (%) (mn) (%)
900 100 600 90
60 65
800 500 56 70
44 50
700 80 37 426
383 50
400 26 27 30
600 337
19 30
60 287
500 300
231 10
400 170
40 200
113 -10
300 80
100 55
200 26 -30
20
100 - -50
0 0 2006 2007 2008 2009 2010 2011 2012 2013 2014 2015
1999 2002 2005 2008 2011 2014 2017 2020
e-Commerce customers (LHS)
Internet users [LHS] Intern et pene tration rate (RHS) e-Commerce penetration among internet users (RHS)
Source: CNNIC, Credit Suisse estimates Source: iResearch, Credit Suisse estimates
According to iResearch, among the 80 mn China e-commerce users in 2008, 65 mn were B2C user base will grow
C2C users, 75% higher than the B2C user base at 40 mn. We expect the C2C user base faster than C2C
to remain higher than B2C’s, due to low costs and large variety of products provided by
C2C platforms. However, we expect the B2C user base to grow faster versus C2C, as
experienced C2C users will demand higher quality products and become B2C users. (User
base for both B2C and C2C are overlapping. In 2008, about 77% of C2C users were the
same as B2C users.)
Figure 15: e-commerce users forecast Figure 16: B2C spending and C2C spending comparison
(mn) (%) (RMB per month)
350
600 89 91 93 100
79 85 300
500 80 250
400
71 71 255 60 200
232
300 57 57 62 207 150
180 40
200 150
100
120
100 85 212 237 20
65 154 184 50
24 48 118
60 85
- 28 40 -
14 -
2006 2007 2008 2009 2010 2011 2012 2013 2014 2015 2007 2008 2009 2010 2011 2012 2013 2014 2015
B2C (LHS) C2C (LHS) B2C/C2C % (RHS) B2C C2C
Source: iResearch, Credit Suisse estimates Source: Credit Suisse estimates
China Internet Sector 9
10. 12 November 2009
Rising e-commerce spending is another key driver. Monthly spending per e-commerce Rising e-commerce
user in 2008 was Rmb158, up 38% YoY (compared with surveyed spending at Rmb100 of spending as another
Credit Suisse Consumer Survey (see page 31). We expect monthly e-commerce to be up growth driver
by 32% to Rmb210 in 2009. In 2008, C2C monthly spend was about Rmb177 per user,
whereas B2C spend was Rmb22 per user. Due to rising popularity of e-commerce and
higher demand for branded products, we expect B2C spending per user to increase to
Rmb43 in 2009 and to Rmb287 in 2015, exceeding the C2C spending levels. However, we
expect C2C monthly spending level to be flattish after 2010 due the increasing number of
new e-commerce users with low ARPU.
Is e-commerce important for China’s retail market?
We believe China’s e-commerce market will play an important role in the China’s retail
market. Compared with traditional physical stores, e-commerce companies have the
following strengths to justify an increase in their market share.
E-commerce companies advantages
(1) Superior data mining capability
Internet companies have a detailed database management system and track user Huge user database, with
behaviour, e.g. visit time, frequency, duration and products that users have been clicked high quality of information
on and have been purchased. Also, internet companies normally have personal
information of users, e.g. name and phone numbers. Database of e-commerce companies
would be even more reliable than regular Internet companies’, as e-commerce users
normally enter genuine personal information and even provide their real addresses, as
logistics companies have to deliver products to buyers’ home or office. This information is
essential for users to understand user demographics, trends and develop better products.
For instance, Amazon, the largest B2C company in the world, has been popular in data
mining and has successfully recommended products to users based on user profile and
previous visit/purchase behaviour.
Figure 17: Screen snapshot of Amazon’s front page
Source: Company data, Credit Suisse estimates
China Internet Sector 10
11. 12 November 2009
On a relative basis, traditional retail chains find it difficult to collect a large amount of user Difficulties for Traditional
information. Customer information collected offline is normally less detailed and retail chains for information
comprehensive than online information. For instance, it is virtually impossible to record the collection
name and frequency of customers visiting physical stores, while this is not the case for
online stores. Separately, many large scale, self-branded retail chains rely heavily on
franchise stores, limiting their ability for data collection, as franchise store systems cannot
be fully linked to their headquarter systems.
Also, franchise stores’ sales staff are trained mostly for sales jobs and less on data
collection. For instance, only 5% of the Li-Ning’s (2331.HK, HK$22.20, OUTPERFORM,
TP HK$27.60) distribution network of 6,800 are directly managed retail stores. We
understand some well-operated retail chain have linked only 60-70% of the retail network
to the centralised point-of-sale (POS) system.
A few well-managed traditional retail chains have already developed a VIP system with
detailed customer information, e.g. Belle (1880.HK, HK$8.06, OUTPERFORM, TP
HK$7.80) and Ports (0589.HK, HK$20.50). However, we expect VIP to remain a small
fraction of the total customer base and revenue. On the other hand, through its 10-year
effort, M18, one of the largest online apparel firms in China, has accumulated 10 mn-plus
identifiable customer database. We believe most traditional retail chains are still behind e-
commerce companies in terms of database development and data mining capability.
(2) Improved working capital management
e-commerce can easily reduce a substantial amount of working capital (or inventory), as E-commerce companies
physical stores need to store inventory for demonstration and customer trials. This require less working capital
advantage is more applicable for items with high price tags. For instance, without a large
physical store network, Zbird (private), one of the largest online diamond stores in China,
can save substantial working capital. Also, as e-commerce companies can forecast
customer demand better than traditional retail chains. Well-operated e-commerce
companies can shorten inventory turnover cycle by about a month from suppliers to
customers. (Most listed traditional retail chains calculate inventory turnover dates from
only suppliers to franchise stores, as franchise stores are regarded as third-party
companies.)
(3) National brand, not regional brand
All e-commerce/Internet companies can reach customers across country and are national E-commerce companies
brand companies, whereas many traditional retail chains are strong on a regional basis, cover the whole nation
not on a national basis. Thus, when these regional retail companies are expanded to the
entire country or other provinces, incremental marketing expenses would be significant
and execution would also be challenging.
(4) Positive government policies
We expect China’s government policies to favour growth of e-commerce market (see Government supporting e-
Appendix I: Regulatory), as e-commerce market development will fuel economic growth commerce market
and reduce unemployment rate. Thus, the Chinese government will likely formulate
favourable policies to facilitate e-commerce development in China. For instance, e-
commerce companies may be identified as hi-tech companies enjoying favourable taxation
policies. Currently, the corporate tax for hi-tech companies rate is about 15% or even
lower, whereas traditional retail chains are taxed at 25%.
(5) Short history of retail branding in China
We understand that successful China retail brand companies were founded in mid to late E-commerce brand as
1990s, whereas successful e-commerce companies were founded only five-10 years later, strong as traditional brand
e.g. M18 in 1996, 360buy in 1998 and Taobao in 2003. In China, we believe the relatively
shorter history of Chinese retail brand provides a good opportunity for new, fast growing e-
commerce companies to build own brand as strong as traditional retail brand.
China Internet Sector 11
12. 12 November 2009
(6) Ability to constantly interact with customers
E-commerce companies can promote their products and platform through multiple direct Interaction with e-commerce
and customised approaches, e.g. emails, SMS/MMS, catalogue mailing. But without a customers
detailed customer database, traditional retail companies can only advertise their products
through traditional methods e.g., TV or outdoor advertising.
E-commerce companies allow customers to interact and exchange views, leading to Interaction leading to higher
higher user stickiness and possibly higher trading volumes for the platform. Also, through user stickiness
various forums, customers can understand product features and differentiate between high
and low quality products. For instance, in Taobao’s social networking service (SNS),
customers can comment on specific products. Such networking effect is unrivalled by
traditional retail chains.
Figure 18: Screen snapshot of Taobao SNS
3,410 Taobao customers shared
views on Nokia handset 5300
Source: Company data, Credit Suisse estimates
E-commerce companies challenges
We expect e-commerce companies to face serious of challenges during expansion.
Many e-commerce companies are garnering market share from traditional retail stores. Potential price war
After growing to a certain scale, e-commerce companies compete directly with larger scale
retail brands. We expect traditional retail companies could engage in price wars to
compete against e-commerce companies. With higher economies of scale, traditional retail
companies may be able to undercut their margins to maintain market share, thus exerting
pressure on e-commerce companies. For instance, 360buy, one of the largest online
consumer electronics companies, generated Rmb1.4 bn in revenues in 2008, versus
Gome’s Rmb45.9 bn and Suning’s at Rmb49.7 bn in 2008. We expect 360buy to generate
e-commerce transaction volume (GMV) of Rmb3.5 bn in 2009.
China Internet Sector 12
13. 12 November 2009
We believe pure online e-commerce services business model is more suitable for low- E-commerce not applicable
priced, standardised products, and they are less suitable for tailor-made products, e.g. to all products
men’s suits. Thus, we expect e-commerce business model would be evolved into a hybrid
model (online/ offline), depending on product type and service requirement.
The growth of e-commerce companies is driving internet penetration. On the other hand, Internet user base as a
the size of the e-commerce market is limited by the number of Internet users. bottleneck of expansion
In our view, the branding strategies of most e-commerce companies are not different from Weak brand management
those of their traditional counterparts’. However, brands of e-commerce companies are
less prominent than those of their traditional brand counterparts, because: 1) Business
models of many e-commerce companies are platform-based online shopping malls without
or with limited owned brand products. Also, product categories among online shopping
malls are similar. 2) Most e-commerce companies have been focusing on technological
platform development and have hired fewer marketing professionals to refine market
segments and build brand image. 3) Many traditional retail brands have been advertising
aggressively on TV, whereas e-commerce companies have been marketing mostly online.
Although online advertising provides higher return on investment (ROI), TV advertising can
help build brand image in a shorter period. Among all e-commerce companies, Vancl
(private), founded in October 2007, is one of the few successfully cases to have developed
a strong brand through aggressive online brand advertising strategies in two years. Also,
among all e-commerce companies, Taobao is one of the few e-commerce companies
have developed differentiated brand strategies and advertised on CCTV.
Due to the fast growing e-commerce market, many traditional retail companies are Traditional retail companies’
opening online stores. For instance, Li-Ning is among the most aggressive in the online expansion into online space
space, and has opened multiple online stores, including:
■ Official online stores with a unique domain name (http://www.e-lining.com).
■ Taobao online store (http://lining.mall.taobao.com/).
■ Partnership with Youdao shopping search (http://gouwu.youdao.com/mdetail?site=e-
lining.com&keyfrom=gouwu.index.merchant).
Figure 19: Li ning official online store snapshot Figure 20: Li ning Taobao Mall online store
Source: Company data Source: Company data
China Internet Sector 13
14. 12 November 2009
Besides Li-Ning, GOME, Sunning and Lenovo have all developed their online stores. All Traditional retail companies
these traditional retail companies all entered into e-commerce market to diversify its entering into e-commerce
channels. Thus, competition in the e-commerce market is intensifying. market
Multi-channel strategies – the success formulae?
Despite their efforts to diversify into the e-commerce market, none of the traditional retail In US, 22 out of the top-25
companies has disclosed their online sales breakdown, and we expect online sales e-commerce companies
contribution of total revenues to remain insignificant. The situation is different from that in were traditional retail
the US market. According to US e-commerce report Web 2.009, dated 22 October 2008, companies
22 out of the top-25 e-commerce companies in the US were traditional retail companies.
On average, only 5.1% of the total revenues of top-25 e-commerce companies in 2007
were generated online and we believe this percentage is rising.
Traditional retail companies’ low e-commerce revenue contribution is likely due to Low e-commerce revenue
inadequate resources allocated to their online stores. Also, we believe traditional retail contribution of traditional
companies have not developed balanced channel strategies in China, including those on retail companies
pricing, discount, rebate and channel mix.
On the other hand, e-commerce companies are building their physical presence based on e-commerce companies are
their business strategies and product characteristics. building their distribution
network
M18 (or Mecoxlane), one of the largest online apparel firms, was founded in 1996 as a
catalogue company, which later expanded into the online space and is now operating 300 M18 - online apparel firms
stores in China. Revenue from each business line is evenly distributed among three operate 300 stores
various channels in 2009. M18 aims to develop physical stores to improve its brand image
and to reach customers unwilling to buy apparels online.
Zbird, one of the largest online diamond and jewellery stores, was founded in 2002 as an Zbird – online diamond firm
online diamond store. Since 2005, Zbird has opened its flagship store in Shanghai, and to open one flagship per city
now has 10 flagship stores in 10 cities (one flagship store in each city). Instead of opening
the store on the street, all Zbird stores are located in high-rise commercial buildings to
serve only online customers.
As such, we have observed that both traditional retail chains and e-commerce companies E-commerce companies find
are expanding their respective territories. In the meantime, we believe that e-commerce it easier to strike the right
companies finding easier to strike the right balance on channels compared with traditional balance on channels
retail companies, as physical network is more complimentary to online store network in
terms of presence and demographics. However, traditional retail companies’ online stores
would cannibalise its fast growing physical store network.
Price competitiveness of the e-commerce platform
On average, buyers get a 21% discount for goods purchased online. Among all the Online products are 21%
categories, price discount for apparel, cosmetics, and accessories on C2C platforms are cheaper than goods sold in
the highest. physical stores
China Internet Sector 14
15. 12 November 2009
Figure 21: Price discounts on online products (% of offline price)*
Offline price Taobao Paipai Eachnet Youa Average
Product Category (Rmb) (%) (%) (%) (%) (%)
Sharp handset - 9130 Handset 3,580 17 20 25 12 19
Apple Laptop - MB990CH/A IT 9,498 6 7 0 2 4
LiNing basketball shoes - 2BMC369-2 Apparel 366 50 45 40 45
Dior perfume - J'adore L'absolu 75ml Cosmetics 1,250 46 29 53 26 39
Sony Camera - T900 Digital 2,450 11 16 2 -22 2
Supor pan - PC32T Household 387 13 46 29 29 29
JAK dried vegetable 150g Food 17 18 26 26 30 25
China Mobile front payment card Rmb100 Front payment 100 5 2 1 1 2
Swatch children watch - ZFPN029 Accessories 398 40 40 46 45 43
Zhui Fengzheng de Ren Book 25 25 25 0 -20 8
Meadjohnson milk powder - A+1 900g Baby 230 10 4 0 5 5
The North Face hiking bag - AS9U 35L Outdoor 1,198 26 24 25
Philips recorder - AZ1022 Electronics 488 31 39 28 28 31
Average 23 25 19 15 21
Note: * Offline prices are taken from typical offline distribution channel for each product, e.g. YongLe for handset and IT, Yaohan for apparel
Source: Credit Suisse estimates
For online air ticket booking, Taobao offers a 8% discount on average, compared to the Airline tickets on Taobao are
price offered by airline companies’ telephone sale or website, but most of the tickets 8% lower than airline
cannot be rescheduled or refunded, whereas Ctrip (CTRP.OQ, $60.40, NEUTRAL, TP companies’
$49.60) provides the most flexible air ticket and best value added services.
Figure 22: Air ticket price discount (% of offline price)
Flight Airline operator price (Rmb) Taobao (%) C-trip (%)
CZ39080 740 1*^° -7°
MU2518 360° 22*^° 11°ª
HU7787 307° 16*^° -7°ª
CA1596 630° -6° -10°
FM9217 1,120° 5*^° 0°ª
Average 8 -3
* Not eligible for rescheduling ^ Not eligible for a refund ° Not eligible for change of airline ª set discount
offer of air ticket + hotel is available
Source: Credit Suisse estimates
Entry barriers for online stores are much lower than that for offline stores, due to fewer Low entry barriers for
procedural requirements, lower initial investment and expenses. Figure 23 shows a online stores
comparison for procedure, initial investment, time needed, and tax rate between an online
store and an offline store.
Figure 23: Initial procedure and investment to open an apparel store in a tier-two city
Offline store Online store
Procedures Four steps Two step
Registration at local Administration for Industry & Commerce Registration on Taobao or other C2C platforms
Registration at local office of State Administration of Taxation Registration on Alipay and/or other online payment platforms
Registration at Administration of Local Taxation
Rental contract/ property ownership certificate
Initial investment Rmb55,000 Rmb10,000
Rmb500-1,000: Registration fee Rmb 5,000: Camera
Rmb24,000: Rental deposit (assuming Rmb8,000 per month * 3months) Rmb5,000: First bunch of inventories
Rmb30,000: First bunch of inventories or Franchise deposit
Time needed Two months Less than one week
15 days: Looking for shop site and signing of the contact with landlord, 1 day: register online and get familiar with transaction procedures
market place, or shopping mall
7days: Register with the above mentioned regulators. Total time needed 2-3 days: photo the products and decorate online store
varies in different locations, fastest one-two days.
30 days: shop decoration
Tax 8% (approximately) 0
Source: Credit Suisse estimates
China Internet Sector 15
16. 12 November 2009
Difference between the US and China e-commerce
markets
We believe China’s e-commerce market will follow the growth trend of the US market.
However, we have identified a few key differences between China and US markets.
In the US e-commerce market, B2C accounted for 69% of total e-commerce market in C2C dominant in China,
2007. In China, C2C has been the dominant business model with 93% of the total whereas B2C is the
e-commerce market share in 2008. We believe Taobao (private), founded in 2003, has mainstream in the US
been the key driver of the China’s e-commerce market (for the section on Taobao, please
refer to page 66). Taobao, including Alipay, has provided additional buyer protection
system and improved buyer confidence in e-commerce, especially on Taobao platform.
Also, C2C platforms provide comprehensive product categories and competitive pricing,
and have attracted significant consumer attention versus B2C companies. Chinese buyers
are generally price-sensitive. Also, in the US, B2C is more dominant, as: 1) traditional
retail brand companies have actively provided online B2C platforms in the early stages of
the e-commerce market and 2) C2C is an auction-based platform (whereas China C2C
has a more fixed price and direct-sale approach) and is always regarded as a niche
product platform. Also, in the US market, besides pricing, consumers are willing to pay for
product quality and after-sales services.
Figure 24: US and China e-commerce market forecast Figure 25: US and China e-commerce (as a % of retail sales)
(US$ bn) (%)
8
350 7
300 6
250 5
200 4
150 3
100 2
50 1
- -
2002 2004 2006 2008 2010E 2012E 2002 2003 2004 2005 2006 2007 2008 2009E 2010E 2011E 2012E
China US China US
Source: iResearch, Credit Suisse estimates Source: iResearch, Company data, Credit Suisse estimates
Figure 26: US B2C and C2C market breakdown Figure 27: China B2C and C2C market breakdown
(% of total e-Commerce GMV) (% of total e-Commerce GMV)
100 100
90 90
80 80
70 70
60 60
50 50
40 76% 40
73% 70% 68% 69%
30 66%
30
20 20 36%
30%
10 10 22%
8% 7% 11%
0 0
2002 2003 2004 2005 2006 2007 2007 2008 2009E 2010E 2011E 2012E
B2C C2C B2C C2C
Source: Credit Suisse estimates Source: iResearch
China Internet Sector 16
17. 12 November 2009
China’s e-commerce market is highly concentrated, with the top-three players (in terms of The e-commerce market in
GMV) i.e., Taobao, Paipai and Eachnet, accounting for 94% of the total e-commerce China is highly concentrated
market in China in 2008. Similar to the retail market, US e-commerce market is more versus the fragmented
fragmented, as the top-three players account for 27% of the market. This implies that nature of the US
China’s e-commerce buyers rely heavily on e-commerce platforms that are reliable and e-commerce market
provide comprehensive product categories. In the long run, we expect China’s B2C market
to grow faster than C2C market and China’s e-commerce market to be less concentrated.
However, in the medium term, we believe the market structure of China’s e-commerce
market will not change significantly, and platform players such as Taobao will continue to
the most dominant in the Chinese e-commerce market.
Figure 28: China and US e-commerce player comparison
US e-commerce market (2007) China e-commerce market (2008)
B2C GMV (US$ mn) % of B2C B2C GMV (US$ mn) % of B2C
Amazon.com 14,835 12 Taobao mall 251 20
Staples Inc. 5,600 5 360buy 200 16
Office Depot Inc. 4,900 4 Joyo 150 12
C2C GMV (US$ mn) % of C2C C2C GMV (US$ mn) % of C2C
Ebay (domestic only) 28,452 53 Taobao 14,002 82
Paipai 1,686 10
Eachnet 1,346 8
Total e-commerce GMV % of total Total e-commerce GMV % of total
(B2C + C2C) (US$ mn) e-commerce (B2C + C2C) (US$ mn) e-commerce
EBay (domestic only) 28,452 16 Taobao 14,253 78
Amazon.com 14,835 8 Paipai 1,686 9
Staples Inc. 5,600 3 Eachnet 1,346 7
Office Depot Inc. 4,900 3 360buy 200 1
Joyo 150 1
Source: US Census, iResearch, Credit Suisse estimates
The US retail market has diversified after 100 years of development. Compared with the Limited catalogue and
US retail market, China retail market remains in the early stage of development and many discounted store market
successful sub-sectors in US retail market, e.g. discount stores, have not been well in China
developed in China. Thus, it provides a good opportunity for e-commerce to gain share in
the developing retail market For instance, according to US Census, the size of the US
catalogue market was US$87 bn and that of discounted department stores (including
factory outlet) was US$75 bn, together representing 6.8% of total US retail market size in
2008. In China, both catalogue and discounted store markets are very limited. In the
catalogue market, most global players have exited their businesses in China, e.g.
Bertelsmann’s termination of its China book club in July 2008.
We understand that M18 (or MexcoLane), one of the largest online apparel companies in E-commerce likely to gain
China, is one of the few profitable companies in the catalogue industry and probably the shares given that the
largest catalogue company in China. Separately, discounted stores have not been well discounted store market is
developed in China market, due to consumer behaviour and transportation reasons. As under developed
the China retail market is still evolving, e-commerce will likely gain further market share in
China versus the US, due to the limited scale of catalogue and discount stores market.
US C2C market is auction-based and its offers are valid for a certain auction period, US C2C seller is in for ‘fun’;
whereas China’s C2C market is mostly fixed-price, direct sale model. This difference is China C2C seller does this
partly due to differences in consumer behaviour, as the offline auction market in China is for a living
very small. Also, in the China C2C market, we believe that most participants, mainly
individuals or families, run C2C online stores as real businesses and owners of C2C
stores are run those stores on a full-time basis, i.e. they normally quit full-time jobs.
In the initial stages, the US C2C market was similar to the flea market, with most sellers More professional sellers in
running online stores on a part-time basis. After years of development, the C2C market in China C2C market than that
the US has evolved and now represents a mix of semi-professional and casual sellers. in the US
China Internet Sector 17
18. 12 November 2009
Moreover, the trends seems to be shifting to the semi-professional direction given Amazon's
3P platform and eBay's new DSR (detailed seller rating) emphasis, which prioritises
professional and semi-professional sellers over casual ones. As such, eBay’s fixed price
GMV (gross merchandise value) was has seen a rising trend in the past few years. Also,
most Chinese C2C platforms provide instant messaging (IM) tools for online store staff to
communicate with buyers, e.g. Taobao’s Aliwangwang, Paipai’s QQ IM and Youa’s Hi, as
most China C2C online stores operate on a full-time basis. However, EBay has failed to
integrate with Skype as, in our view, most sellers are unavailable for chats with buyers.
Figure 29: EBay fixed price (% of total GMV)
(%)
60
55
50
45
40
35
4Q06 1Q07 2Q07 3Q07 4Q07 1Q08 2Q08 3Q08 4Q08 1Q09 2Q09 3Q09
Source: Company data
Apparels/garments are products that are popular in both the US and China, as China has Online apparel commonly
many low cost apparel producers and most apparel manufacturers produce products popular in US and China,
based on the latest fashion trends. In the US, although consumers are able to buy low- but rest are different
cost, high quality brand apparels in discounted department stores or factory outlets,
apparels remained the No. 1 item in 2007. This shows that apparel demand is very strong
in China. Besides apparel/garment, the remainder of the popular product categories for US
and China are different. For instance, office products’ supplies were ranked No. 2 in the
US due to online procurement for the commercial sector, whereas virtual items were the
second most saleable items, due to the high popularity of online games in China.
Figure 30: Top product categories in the US and China (in terms of revenue)
US (2007) China (2008)
1 Apparel & Accessories Garment
2 Office Supplies Virtual items
3 Consumer Packaged Goods Digital
4 Consumer Electronics Cosmetics
5 Furniture, Appliances IT
6 Books & Magazines Books/DVD
7 Home & Garden Handset
8 Music, Movies & Videos Household
9 Computer Software Top-up cards
10 Toys & Hobbies Accessories
11 Jewellery & Watches Gifts & toys
12 Flowers, Greetings, Gifts Food
13 Sports & Fitness Appliance electronics
Source: ComScore, iResearch, Credit Suisse estimates
China Internet Sector 18
19. 12 November 2009
Credit card is the most dominant payment and settlement tool in the e-commerce market COD/third- party payment
in the US. Even Paypal (private) is a payment platform based on credit cards. As the platform dominant in China,
banking system has not provided enough protection for buyers and credit cards are not not credit cards
very popular across the country, cash on delivery (COD) is the dominant approach for e-
commerce. Based on our interviews with a few leading B2C companies, we understand
that COD is the key payment approach (except high price tag items). In some cases, COD
can represent for 60%-plus of revenues. On the other hand, third-party escrow payment
platform, e.g. Alipay, Tenpay, are the dominant approaches for C2C platforms in China.
After years of development, Alipay has 200 mn+ registered accounts, and Tenpay has 50
mn+ registered users. We expect 70-80% of Taobao GMV to be settled through Alipay.
Although China has issued over 150 mn credit cards as of 2008, we expect third-party
escrow payment platform to remain the dominant payment approach for e-commerce in
the long run, due to its extra buyer protection system and its high popularity among
Internet users. (Please refer to Section 2 for more details on third-party payment
platforms.)
Figure 31: Payment platform availability on multiple B2C and C2C platform
Cash Umpay
Credit Alipay on Tenpay (China Western
Website Card (Alibaba) Delivery (Tencent) Baifubao 99bill Mobile) e-Banking Union
C2C
Taobao
Paipai
Youa
B2C
360buy
Newegg
joyo
Vancl
Dangdang
mall.taobao
Zbird
M18
Source: Credit Suisse estimates
C2C market – on its way to profitability
Although B2C was the first business model founded in China, C2C is the more successful C2C is the more successful
e-commerce business model, so far, and is the key driver of e-commerce market in China, e-commerce business
instead of B2C. According to iResearch, the total C2C market size was Rmb120 bn in model
2008, up 131% YoY. C2C accounted for 93% of total e-commerce GMV in 2008, slightly
up from 92% in 2007. It shows that C2C growth in China remains strong, despite the
emergence of B2C market.
In terms of traffic, Taobao has been ranked No. 5 in China since mid-2008, whereas Taobao - No. 5 traffic
Paipai’s traffic ranking rebounded from 70 in mid-2008 to 45 in early November 2009. ranking in China
Eachnet was ranked below 1,000, implying a small user base.
China Internet Sector 19
20. 12 November 2009
Figure 32: China C2C market size (Rmb bn) Figure 33: C2C players traffic ranking
(RMB bn) (%) 0 0
900 100
800 20
90 5
700
600 80
40
500
70 10
400
60
300 60
200 15
50 80
100
- 40
2007 2008 2009 2010 2011 2012 2013 2014 2015 20 100
Dec 06 Jun 07 Nov 07 May 08 Nov 08 May 09 Oct 09
C2C market size (RMB bn) (LHS)
C2C (% of total e-commerce market) (RHS) Taobao Paipai
Source: iResearch, Credit Suisse estimates Source: Alexa, Credit Suisse estimates
We expect the C2C market to grow from Rmb120 bn in 2008 to Rmb203 bn (up 70% YoY) C2C market to record a
and then further up to Rmb491 bn in 2012, a 2009-12 CAGR of 34%, due to: 1) sustainable CAGR 34% from 2009 to
growth in Internet user base, 2) rising e-commerce penetration rate, 3) continuous growth in 2012 to Rmb491 bn
disposal income, 4) inclusion of new product categories, e.g. airline tickets in 2008 and 5)
improvement in logistics coverage and reduction of logistics cost.
However, we expect the C2C (as a percentage of the total e-commerce market) to decline C2C (as a percentage of
from 83% in 2009 to 55% in 2012. We expect the growth rate in C2C GMV to slow down total e-commerce market)
due to: 1) C2C market becoming larger in scale, 2) experienced e-commerce consumers will decline from 83% in
showing higher demand for B2C products due to their better quality and services and 2009 to 55% in 2012
3) strategic diversion of Taobao’s traffic from C2C to B2C.
Reasons for the dominance of the C2C model in the Chinese market
Low price and comprehensive product categories are the key attractions of the C2C
platform. Besides these, some unique China characteristics have ensured the popularity of
C2C platforms.
China has the world’s largest manufacturing base, with one of the lowest production costs Largest amount of low cost
and widest product varieties. Due to the financial crisis, many export-oriented producers in China
manufacturers have shifted their production focus to the domestic market and have started
selling products online.
Due to the abundant supply of low-cost labour force in China, logistics cost is low and Low cost logistics system
improves the attractiveness of online purchases, even for the purchase of small items. For
instance, the purchase of a Rmb10 mobile phone screen protector comes with a delivery
cost of Rmb5. Based on the interviews that we have conducted, delivery cost of major
B2C companies is about Rmb5-10 per transaction, and will increase subject to the delivery
location and product size. Generally speaking, current logistics cost in China is low and
attractive for e-commerce users. Finally, after years of development, a few large-scale
logistics companies, such as TTK Express, YunDa, ShenTong Express and Yuan Tong
Express, were formed. Improving scalability and system of logistics companies would
further reduce logistics cost for e-commerce.
In the offline world, it is more expensive to set up a retail store compared with an online High cost and risk for
store (see page 157 for cost sensitivity of online and offline stores). Also, without any entrepreneurship in the
explicit regulation, individual online stores of C2C platforms mostly do not voluntarily pay offline world
VAT and corporate taxes (see Appendix I on on e-commerce regulation). Thus, many
entrepreneurs and unemployed people have opened online stores on C2C platforms in the
past few years. A high number of online stores on the C2C platform have further reduced
China Internet Sector 20