[대한병리학회] 의료 인공지능 101: 병리를 중심으로
•
4 j'aime•2,035 vues

2020년 11월 5일 대한병리학회에서 키노트 발표한 자료입니다. 병리학 부분만 발췌해서 공유해드립니다.

Recommandé
Recommandé
Contenu connexe
Tendances
Tendances (20)
Similaire à [대한병리학회] 의료 인공지능 101: 병리를 중심으로
Similaire à [대한병리학회] 의료 인공지능 101: 병리를 중심으로 (20)
Plus de Yoon Sup Choi
Plus de Yoon Sup Choi (18)
Dernier
Dernier (20)
[대한병리학회] 의료 인공지능 101: 병리를 중심으로
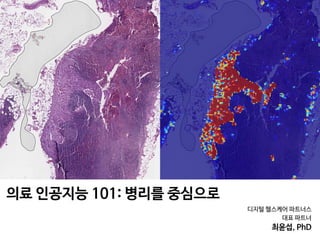
- 1. 디지털 헬스케어 파트너스 대표 파트너 최윤섭, PhD 의료 인공지능 101: 병리를 중심으로
- 2. Pathology
- 3. A B DC Benign without atypia / Atypic / DCIS (ductal carcinoma in situ) / Invasive Carcinoma Interpretation? Elmore etl al. JAMA 2015 Diagnostic Concordance Among Pathologists 유방암 병리 데이터 판독하기
- 4. Figure 4. Participating Pathologists’ Interpretations of Each of the 240 Breast Biopsy Test Cases 0 25 50 75 100 Interpretations, % 2 4 6 8 10 12 14 16 18 20 22 24 26 28 30 32 34 36 38 40 42 44 46 48 50 52 54 56 58 60 62 64 66 68 70 72 Case Benign without atypia 72 Cases 2070 Total interpretations A 0 25 50 75 100 Interpretations, % 218 220 222 224 226 228 230 232 234 236 238 240 Case Invasive carcinoma 23 Cases 663 Total interpretations D 0 25 50 75 100 Interpretations, % 147 145 149 151 153 155 157 159 161 163 165 167 169 171 173 175 177 179 181 183 185 187 189 191 193 195 197 199 201 203 205 207 209 211 213 215 217 Case DCIS 73 Cases 2097 Total interpretations C 0 25 50 75 100 Interpretations, % 74 76 78 80 82 84 86 88 90 92 94 96 98 100 102 104 106 108 110 112 114 116 118 120 122 124 126 128 130 132 134 136 138 140 142 144 Case Atypia 72 Cases 2070 Total interpretations B Benign without atypia Atypia DCIS Invasive carcinoma Pathologist interpretation DCIS indicates ductal carcinoma in situ. Diagnostic Concordance in Interpreting Breast Biopsies Original Investigation Research Elmore etl al. JAMA 2015 유방암 판독에 대한 병리학과 전문의들의 불일치도
- 5. Elmore etl al. JAMA 2015 •정확도: 75.3% (정답은 경험이 많은 세 명의 병리학과 전문의가 협의를 통해 정하였음) spentonthisactivitywas16(95%CI,15-17);43participantswere awarded the maximum 20 hours. Pathologists’ Diagnoses Compared With Consensus-Derived Reference Diagnoses The 115 participants each interpreted 60 cases, providing 6900 total individual interpretations for comparison with the con- sensus-derived reference diagnoses (Figure 3). Participants agreed with the consensus-derived reference diagnosis for 75.3% of the interpretations (95% CI, 73.4%-77.0%). Partici- pants (n = 94) who completed the CME activity reported that Patient and Pathologist Characteristics Associated With Overinterpretation and Underinterpretation The association of breast density with overall pathologists’ concordance (as well as both overinterpretation and under- interpretation rates) was statistically significant, as shown in Table 3 when comparing mammographic density grouped into 2 categories (low density vs high density). The overall concordance estimates also decreased consistently with increasing breast density across all 4 Breast Imaging- Reporting and Data System (BI-RADS) density categories: BI-RADS A, 81% (95% CI, 75%-86%); BI-RADS B, 77% (95% Figure 3. Comparison of 115 Participating Pathologists’ Interpretations vs the Consensus-Derived Reference Diagnosis for 6900 Total Case Interpretationsa Participating Pathologists’ Interpretation ConsensusReference Diagnosisb Benign without atypia Atypia DCIS Invasive carcinoma Total Benign without atypia 1803 200 46 21 2070 Atypia 719 990 353 8 2070 DCIS 133 146 1764 54 2097 Invasive carcinoma 3 0 23 637 663 Total 2658 1336 2186 720 6900 DCIS indicates ductal carcinoma in situ. a Concordance noted in 5194 of 6900 case interpretations or 75.3%. b Reference diagnosis was obtained from consensus of 3 experienced breast pathologists. Diagnostic Concordance in Interpreting Breast Biopsies Original Investigation Research 총 240개의 병리 샘플에 대해서, 115명의 병리학과 전문의들이 판독한 총 6,900건의 사례를 정답과 비교 유방암 판독에 대한 병리학과 전문의들의 불일치도
- 6. PERSPECTIVES Diagnosis of malignant from benign or inflammation and/or reactive changes Pathologist Detection of intratumoural heterogeneity by analyzing variance across the tissue block Delineation or annotation of which area is malignant or suspicious of pathology on a whole slide image Detection of cells, cellular subtypes and histologic primitives (such as mitotic figures, tubules or nuclei) Quantification of cells or objects (such as types of blood cells or haemoglobin) Grading of the tissue according to severity of disease (for example, Gleason grading in prostate cancer) Low risk High risk Identification of novel prognostic approaches beyond visual identification (such as spatial architecture or degree of multinucleation) Precision medicine approaches: treatment tailored to an individual patient Identification of unique morphological features associated with gene alterations or signalling pathways Stratification of patients on the basis of their risk of progression or recurrence to guide intensification or de-intensification therapy Identification of patients who are more likely to respond to a particular therapeutic regimen or treatment As a companion diagnostic assay to evaluate patient prognosis to determine optimum management plan Early assessment of response to a specific drug or treatment Oncologist Fig. 4 | Artificial intelligence (AI) and machine learning approaches complement the expertise and support the pathologist and oncologist.Some AI and machine learning approaches complement the expertise and support the pathologist and oncologist Nat Rev Clin Onco 2019 Detection Quantification Grading Detction Diagnosis PrognosisAnnotation
- 7. (domain-inspired features) of pathologists of numerous hand-crafted feature-based These features were subsequently used in PERSPECTIVES Patient with suspected malignancy has biopsy and/or surgical resection Deep learning (deep neural network) approach Hand-crafted AI approach Pathologist fixes and sections the tissue specimen, and makes multiple whole slides using several stains Pathologist provides reference comparison for the region of interest based on the problem Pathologist digitizes physical slide using whole-slide scanner; oncologist collates adjoining database of relevant clinical and/or outcome information AI-based approach from both modalities gives a prediction based on input data Prediction is compared against the reference to evaluate performance of the model Performance evaluation is done by reporting area under the curve as well as survival analysis using hazard models Input Convolution Convolutional layer Pooling layer Output Pooling Flattening Construct a hand-crafted model to build the AI-based prediction; classification approach for the clinical problem Pathologist, oncologist, and AI expert use intrinsic domain knowledge to engineer features to be analysed with AI Fig. 2 | Workflow and general framework for artificial intelligence (AI) approaches in digital pathology. Typical steps involved in the use of two popular categories of AI approaches: deep learning and hand-crafted feature engineering. Workflow and general framework for AI approaches in digital pathology Nat Rev Clin Onco 2019
- 8. PERSPECTIVES a b c d e f g h Fig. 3 | Visual representations of hand-crafted features across cancer types.a|Spatialarrangementofclustersoftissue-infiltratinglymphocytesin a non-small-cell lung carcinoma (NSCLC) whole-slide image. b | Features developedusingquantitativeimmunofluorescenceoftissue-infiltratinglym- phocyte subpopulations (including detection of CD4+ and CD8+ T cells and + d | Features computing the relative orientation of the glands present in prostate cancer tissue.e | Diversity of texture of cancer cell nuclei in an oral cavitysquamouscellcarcinoma.f|Nuclearshapefeaturecomputedoncan- cercellnucleiinahumanpapillomavirus-positiveoropharyngealcarcinoma. g | Graph feature showing the spatial relationships of different cancer cell Visual representations of hand-crafted features across cancer types. Nat Rev Clin Onco 2019
- 9. I M A G I N G Systematic Analysis of Breast Cancer Morphology Uncovers Stromal Features Associated with Survival Andrew H. Beck,1,2 * Ankur R. Sangoi,1,3 Samuel Leung,4 Robert J. Marinelli,5 Torsten O. Nielsen,4 Marc J. van de Vijver,6 Robert B. West,1 Matt van de Rijn,1 Daphne Koller7† The morphological interpretation of histologic sections forms the basis of diagnosis and prognostication for cancer. In the diagnosis of carcinomas, pathologists perform a semiquantitative analysis of a small set of mor- phological features to determine the cancer’s histologic grade. Physicians use histologic grade to inform their assessment of a carcinoma’s aggressiveness and a patient’s prognosis. Nevertheless, the determination of grade in breast cancer examines only a small set of morphological features of breast cancer epithelial cells, which has been largely unchanged since the 1920s. A comprehensive analysis of automatically quantitated morphological features could identify characteristics of prognostic relevance and provide an accurate and reproducible means for assessing prognosis from microscopic image data. We developed the C-Path (Computational Pathologist) system to measure a rich quantitative feature set from the breast cancer epithelium and stroma (6642 features), including both standard morphometric descriptors of image objects and higher-level contextual, relational, and global image features. These measurements were used to construct a prognostic model. We applied the C-Path system to microscopic images from two independent cohorts of breast cancer patients [from the Netherlands Cancer Institute (NKI) cohort, n = 248, and the Vancouver General Hospital (VGH) cohort, n = 328]. The prognostic model score generated by our system was strongly associated with overall survival in both the NKI and the VGH cohorts (both log-rank P ≤ 0.001). This association was independent of clinical, pathological, and molecular factors. Three stromal features were significantly associated with survival, and this association was stronger than the association of survival with epithelial characteristics in the model. These findings implicate stromal morpho- logic structure as a previously unrecognized prognostic determinant for breast cancer. INTRODUCTION In the mid-19th century, it was first appreciated that the process of carcinogenesis produces characteristic morphologic changes in can- cer cells (1). Patey and Scarff showed in 1928 (2) that three histologic features—tubule formation, epithelial nuclear atypia, and epithelial mitotic activity—could each be scored qualitatively, and the assessments could be combined to stratify breast cancer patients into three groups that showed significant survival differences. This semiquantitative mor- phological scoring scheme has been refined over the years (3–5) but still remains the standard technique for histologic grading in invasive breast cancer. Although considerable effort has been devoted recently to molecular profiling for assessment of prognosis and prediction of treatment response in cancer (6, 7), microscopic image assessment is still the most commonly available (and in some places in the world, the only) tool that is financially and logistically feasible. Although the three epithelial features scored in current grading sys- tems are useful in assessing cancer prognosis, valuable prognostic information can also be derived from other factors, including proper- ties of the cancer stroma such as its molecular characteristics (8–15) and morphological features [such as stromal fibrotic focus, a scar- like area in the center of a carcinoma (16)]. Thus, we sought to de- velop a high-accuracy, image-based predictor to identify new clinically predictive morphologic phenotypes of breast cancers, thereby pro- viding new insights into the biological factors driving breast cancer progression. The development of such a system could also address other prob- lems relevant to the clinical treatment of breast cancer. A limitation to the current grading system is that there is considerable variability in histologic grading among pathologists (17), with potentially neg- ative consequences for determining treatment. An automated system could provide an objective method for predicting patient prognosis directly from image data. Moreover, once established, this system could be used in breast cancer clinical trials to provide an accurate, objective means for assessing breast cancer morphologic character- istics, allowing objective stratification of breast cancer patients on the basis of morphologic criteria and facilitating the discovery of mor- phologic features associated with response to specific therapeutic agents. RESULTS Experimental design overview We developed the Computational Pathologist (C-Path), a machine learning–based method for automatically analyzing cancer images and predicting prognosis. To construct and evaluate the model, we acquired hematoxylin and eosin (H&E)–stained histological images from breast cancer tissue microarrays (TMAs) (figs. S4 and S5). The 1 Department of Pathology, Stanford University School of Medicine, Stanford, CA 94305, USA. 2 Biomedical Informatics Training Program, Stanford University School of Medicine, Stanford, CA 94305, USA. 3 Department of Pathology, El Camino Hospital, Mountain View, CA 94040, USA. 4 Genetic Pathology Evaluation Centre, University of British Co- lumbia, Vancouver, British Columbia V6H 3Z6, Canada. 5 Department of Biochemistry, Stanford University, Stanford, CA 94305, USA. 6 Department of Pathology, Academic Medical Center, Meibergdreef 9, 1105AZ Amsterdam, Netherlands. 7 Department of Com- puter Science, Stanford University, Stanford, CA 94305, USA. *Present address: Department of Pathology, Beth Israel Deaconess Medical Center, Harvard Medical School, Boston, MA 02115, USA. †To whom correspondence should be addressed. E-mail: koller@cs.stanford.edu R E S E A R C H A R T I C L E www.ScienceTranslationalMedicine.org 9 November 2011 Vol 3 Issue 108 108ra113 1 Sci Transl Med. 2011
- 10. n all Constructing higher-level contextual/relational features: Relationships between epithelial nuclear neighbors Relationships between morphologically regular and irregular nuclei Relationships between epithelial and stromal objects Relationships between epithelial nuclei and cytoplasm Characteristics of stromal nuclei Characteristics of epithelial nuclei and Building an epithelial/stromal classifier: Epithelial vs.stroma classifier Epithelial vs.stroma classifier B Basic image processing and feature construction: H&E image Image broken into superpixels Nuclei identified within each superpixel A Relationships of contiguous epithelial regions with underlying nuclear objects C ne sic d- es es nd of e- els a al- to or al/ al- ed nd g- ue; en; ed ay; nd = ch D) al. er er g- as ot gh onNovember17,2011stm.sciencemag.orgfrom TMAs contain 0.6-mm-diameter cores (median of two cores per case) that represent only a small sample of the full tumor. We acquired data from two separate and independent cohorts: Nether- lands Cancer Institute (NKI; 248 patients) and Vancouver General Hospital (VGH; 328 patients). Unlike previous work in cancer morphom- etry (18–21), our image analysis pipeline was not limited to a predefined set of morphometric features selected by pathologists. Rather, C-Path measures an extensive, quantitative feature set from the breast cancer epithelium and the stro- ma (Fig. 1). Our image processing system first performed an automated, hierarchical scene seg- mentation that generated thousands of measure- ments, including both standard morphometric descriptors of image objects and higher-level contextual, relational, and global image features. The pipeline consisted of three stages (Fig. 1, A to C, and tables S8 and S9). First, we used a set of processing steps to separate the tissue from the background, partition the image into small regions of coherent appearance known as superpixels, find nuclei within the superpixels, and construct Constructing higher-level contextual/relational features: Relationships between epithelial nuclear neighbors Relationships between morphologically regular and irregular nuclei Relationships between epithelial and stromal objects Relationships between epithelial nuclei and cytoplasm Characteristics of stromal nuclei and stromal matrix Characteristics of epithelial nuclei and epithelial cytoplasm Building an epithelial/stromal classifier: Epithelial vs.stroma classifier Epithelial vs.stroma classifier B Relationships of contiguous epithelial regions with underlying nuclear objects Learning an image-based model to predict survival Processed images from patients alive at 5 years Processed images from patients deceased at 5 years L1-regularized logisticregression modelbuilding 5YS predictive model Unlabeled images Time P(survival) C D Identification of novel prognostically important morphologic features stroma. (C) Constructing higher-level contextual/ relational features. After application of the epithelial- stromal classifier, all image objects are subclassified and colored on the basis of their tissue region and basic cellular morphologic properties (epithelial reg- ular nuclei = red; epithelial atypical nuclei = pale blue; epithelial cytoplasm = purple; stromal matrix = green; stromal round nuclei = dark green; stromal spindled nuclei = teal blue; unclassified regions = dark gray; spindled nuclei in unclassified regions = yellow; round nuclei in unclassified regions = gray; background = white). (Left panel) After the classification of each image object, a rich feature set is constructed. (D) Learning an image-based model to predict survival. Processed images from patients alive at 5 years after surgery and from patients deceased at 5 years after surgery were used to construct an image-based prog- nostic model. After construction of the model, it was applied to a test set of breast cancer images (not used in model building) to classify patients as high or low risk of death by 5 years. Sci Transl Med. 2011 I M A G I N G Systematic Analysis of Breast Cancer Morphology Uncovers Stromal Features Associated with Survival Andrew H. Beck,1,2 * Ankur R. Sangoi,1,3 Samuel Leung,4 Robert J. Marinelli,5 Torsten O. Nielsen,4 Marc J. van de Vijver,6 Robert B. West,1 Matt van de Rijn,1 Daphne Koller7† The morphological interpretation of histologic sections forms the basis of diagnosis and prognostication for cancer. In the diagnosis of carcinomas, pathologists perform a semiquantitative analysis of a small set of mor- phological features to determine the cancer’s histologic grade. Physicians use histologic grade to inform their assessment of a carcinoma’s aggressiveness and a patient’s prognosis. Nevertheless, the determination of grade in breast cancer examines only a small set of morphological features of breast cancer epithelial cells, which has been largely unchanged since the 1920s. A comprehensive analysis of automatically quantitated morphological features could identify characteristics of prognostic relevance and provide an accurate and reproducible means for assessing prognosis from microscopic image data. We developed the C-Path (Computational Pathologist) system to measure a rich quantitative feature set from the breast cancer epithelium and stroma (6642 features), including both standard morphometric descriptors of image objects and higher-level contextual, relational, and global image features. These measurements were used to construct a prognostic model. We applied the C-Path system to microscopic images from two independent cohorts of breast cancer patients [from the Netherlands Cancer Institute (NKI) cohort, n = 248, and the Vancouver General Hospital (VGH) cohort, n = 328]. The prognostic model score generated by our system was strongly associated with overall survival in both the NKI and the VGH cohorts (both log-rank P ≤ 0.001). This association was independent of clinical, pathological, and molecular factors. Three stromal features were significantly associated with survival, and this association was stronger than the association of survival with epithelial characteristics in the model. These findings implicate stromal morpho- logic structure as a previously unrecognized prognostic determinant for breast cancer. INTRODUCTION In the mid-19th century, it was first appreciated that the process of carcinogenesis produces characteristic morphologic changes in can- cer cells (1). Patey and Scarff showed in 1928 (2) that three histologic features—tubule formation, epithelial nuclear atypia, and epithelial mitotic activity—could each be scored qualitatively, and the assessments could be combined to stratify breast cancer patients into three groups that showed significant survival differences. This semiquantitative mor- phological scoring scheme has been refined over the years (3–5) but still remains the standard technique for histologic grading in invasive breast cancer. Although considerable effort has been devoted recently to molecular profiling for assessment of prognosis and prediction of treatment response in cancer (6, 7), microscopic image assessment is still the most commonly available (and in some places in the world, the only) tool that is financially and logistically feasible. Although the three epithelial features scored in current grading sys- tems are useful in assessing cancer prognosis, valuable prognostic information can also be derived from other factors, including proper- ties of the cancer stroma such as its molecular characteristics (8–15) and morphological features [such as stromal fibrotic focus, a scar- like area in the center of a carcinoma (16)]. Thus, we sought to de- velop a high-accuracy, image-based predictor to identify new clinically predictive morphologic phenotypes of breast cancers, thereby pro- viding new insights into the biological factors driving breast cancer progression. The development of such a system could also address other prob- lems relevant to the clinical treatment of breast cancer. A limitation to the current grading system is that there is considerable variability in histologic grading among pathologists (17), with potentially neg- ative consequences for determining treatment. An automated system could provide an objective method for predicting patient prognosis directly from image data. Moreover, once established, this system could be used in breast cancer clinical trials to provide an accurate, objective means for assessing breast cancer morphologic character- istics, allowing objective stratification of breast cancer patients on the basis of morphologic criteria and facilitating the discovery of mor- phologic features associated with response to specific therapeutic agents. RESULTS Experimental design overview We developed the Computational Pathologist (C-Path), a machine learning–based method for automatically analyzing cancer images and predicting prognosis. To construct and evaluate the model, we acquired hematoxylin and eosin (H&E)–stained histological images from breast cancer tissue microarrays (TMAs) (figs. S4 and S5). The 1 Department of Pathology, Stanford University School of Medicine, Stanford, CA 94305, USA. 2 Biomedical Informatics Training Program, Stanford University School of Medicine, Stanford, CA 94305, USA. 3 Department of Pathology, El Camino Hospital, Mountain View, CA 94040, USA. 4 Genetic Pathology Evaluation Centre, University of British Co- lumbia, Vancouver, British Columbia V6H 3Z6, Canada. 5 Department of Biochemistry, Stanford University, Stanford, CA 94305, USA. 6 Department of Pathology, Academic Medical Center, Meibergdreef 9, 1105AZ Amsterdam, Netherlands. 7 Department of Com- puter Science, Stanford University, Stanford, CA 94305, USA. *Present address: Department of Pathology, Beth Israel Deaconess Medical Center, Harvard Medical School, Boston, MA 02115, USA. †To whom correspondence should be addressed. E-mail: koller@cs.stanford.edu R E S E A R C H A R T I C L E www.ScienceTranslationalMedicine.org 9 November 2011 Vol 3 Issue 108 108ra113 1
- 11. Sci Transl Med. 2011 patients; 192 of 328 VGH patients), these statistics were summarized as their mean across the images (Supplementary Material). The NKI images were used to build an image feature–based prognos- tic model to predict the binary outcome of 5-year survival (5YS model) (Fig. 1D) using L1-regularized logistic regression, implemented in the R package glmnet (22). Model performance on the NKI data set was assessed by eightfold cross-validation, where the data set is split into allowing each case to be classifi cancer molecular signatures: the the genomic grade index score (26), the hypoxia gene signatu type (28). The subtype classific the original publications or fr prevalidation C-Path scores we su cli tro siz ch tu sig sic 1A ass sig gr ca tat by pa tem sam pa im A 0 5 10 15 20 25 0.00.20.40.60.81.0 181 153 100 27 4 Low-risk (black) 67 46 29 10 1 High-risk (red) P < 0.001 B C-Path 5YS model on the NKI cohort (n = 248) 0 5 10 15 20 25 30 0.00.20.40.60.81.0 223 174 139 90 22 7 63 39 27 16 3 1 Low-risk (black) High-risk (red) P = 0.001 C-Path 5YS model on the VGH cohort (n = 286) Fig. 2. Kaplan-Meier survival curves of the 5YS model predictions and overall survival on the NKI and VGH data sets. Cases classified as high risk are plotted on the red dotted line and cases classified as low risk on the black solid line. The error bars represent 95% CIs. The y axis is probability of overall survival, and the x I M A G I N G Systematic Analysis of Breast Cancer Morphology Uncovers Stromal Features Associated with Survival Andrew H. Beck,1,2 * Ankur R. Sangoi,1,3 Samuel Leung,4 Robert J. Marinelli,5 Torsten O. Nielsen,4 Marc J. van de Vijver,6 Robert B. West,1 Matt van de Rijn,1 Daphne Koller7† The morphological interpretation of histologic sections forms the basis of diagnosis and prognostication for cancer. In the diagnosis of carcinomas, pathologists perform a semiquantitative analysis of a small set of mor- phological features to determine the cancer’s histologic grade. Physicians use histologic grade to inform their assessment of a carcinoma’s aggressiveness and a patient’s prognosis. Nevertheless, the determination of grade in breast cancer examines only a small set of morphological features of breast cancer epithelial cells, which has been largely unchanged since the 1920s. A comprehensive analysis of automatically quantitated morphological features could identify characteristics of prognostic relevance and provide an accurate and reproducible means for assessing prognosis from microscopic image data. We developed the C-Path (Computational Pathologist) system to measure a rich quantitative feature set from the breast cancer epithelium and stroma (6642 features), including both standard morphometric descriptors of image objects and higher-level contextual, relational, and global image features. These measurements were used to construct a prognostic model. We applied the C-Path system to microscopic images from two independent cohorts of breast cancer patients [from the Netherlands Cancer Institute (NKI) cohort, n = 248, and the Vancouver General Hospital (VGH) cohort, n = 328]. The prognostic model score generated by our system was strongly associated with overall survival in both the NKI and the VGH cohorts (both log-rank P ≤ 0.001). This association was independent of clinical, pathological, and molecular factors. Three stromal features were significantly associated with survival, and this association was stronger than the association of survival with epithelial characteristics in the model. These findings implicate stromal morpho- logic structure as a previously unrecognized prognostic determinant for breast cancer. INTRODUCTION In the mid-19th century, it was first appreciated that the process of carcinogenesis produces characteristic morphologic changes in can- cer cells (1). Patey and Scarff showed in 1928 (2) that three histologic features—tubule formation, epithelial nuclear atypia, and epithelial mitotic activity—could each be scored qualitatively, and the assessments could be combined to stratify breast cancer patients into three groups that showed significant survival differences. This semiquantitative mor- phological scoring scheme has been refined over the years (3–5) but still remains the standard technique for histologic grading in invasive breast cancer. Although considerable effort has been devoted recently to molecular profiling for assessment of prognosis and prediction of treatment response in cancer (6, 7), microscopic image assessment is still the most commonly available (and in some places in the world, the only) tool that is financially and logistically feasible. Although the three epithelial features scored in current grading sys- tems are useful in assessing cancer prognosis, valuable prognostic information can also be derived from other factors, including proper- ties of the cancer stroma such as its molecular characteristics (8–15) and morphological features [such as stromal fibrotic focus, a scar- like area in the center of a carcinoma (16)]. Thus, we sought to de- velop a high-accuracy, image-based predictor to identify new clinically predictive morphologic phenotypes of breast cancers, thereby pro- viding new insights into the biological factors driving breast cancer progression. The development of such a system could also address other prob- lems relevant to the clinical treatment of breast cancer. A limitation to the current grading system is that there is considerable variability in histologic grading among pathologists (17), with potentially neg- ative consequences for determining treatment. An automated system could provide an objective method for predicting patient prognosis directly from image data. Moreover, once established, this system could be used in breast cancer clinical trials to provide an accurate, objective means for assessing breast cancer morphologic character- istics, allowing objective stratification of breast cancer patients on the basis of morphologic criteria and facilitating the discovery of mor- phologic features associated with response to specific therapeutic agents. RESULTS Experimental design overview We developed the Computational Pathologist (C-Path), a machine learning–based method for automatically analyzing cancer images and predicting prognosis. To construct and evaluate the model, we acquired hematoxylin and eosin (H&E)–stained histological images from breast cancer tissue microarrays (TMAs) (figs. S4 and S5). The 1 Department of Pathology, Stanford University School of Medicine, Stanford, CA 94305, USA. 2 Biomedical Informatics Training Program, Stanford University School of Medicine, Stanford, CA 94305, USA. 3 Department of Pathology, El Camino Hospital, Mountain View, CA 94040, USA. 4 Genetic Pathology Evaluation Centre, University of British Co- lumbia, Vancouver, British Columbia V6H 3Z6, Canada. 5 Department of Biochemistry, Stanford University, Stanford, CA 94305, USA. 6 Department of Pathology, Academic Medical Center, Meibergdreef 9, 1105AZ Amsterdam, Netherlands. 7 Department of Com- puter Science, Stanford University, Stanford, CA 94305, USA. *Present address: Department of Pathology, Beth Israel Deaconess Medical Center, Harvard Medical School, Boston, MA 02115, USA. †To whom correspondence should be addressed. E-mail: koller@cs.stanford.edu R E S E A R C H A R T I C L E www.ScienceTranslationalMedicine.org 9 November 2011 Vol 3 Issue 108 108ra113 1
- 12. I M A G I N G Systematic Analysis of Breast Cancer Morphology Uncovers Stromal Features Associated with Survival Andrew H. Beck,1,2 * Ankur R. Sangoi,1,3 Samuel Leung,4 Robert J. Marinelli,5 Torsten O. Nielsen,4 Marc J. van de Vijver,6 Robert B. West,1 Matt van de Rijn,1 Daphne Koller7† The morphological interpretation of histologic sections forms the basis of diagnosis and prognostication for cancer. In the diagnosis of carcinomas, pathologists perform a semiquantitative analysis of a small set of mor- phological features to determine the cancer’s histologic grade. Physicians use histologic grade to inform their assessment of a carcinoma’s aggressiveness and a patient’s prognosis. Nevertheless, the determination of grade in breast cancer examines only a small set of morphological features of breast cancer epithelial cells, which has been largely unchanged since the 1920s. A comprehensive analysis of automatically quantitated morphological features could identify characteristics of prognostic relevance and provide an accurate and reproducible means for assessing prognosis from microscopic image data. We developed the C-Path (Computational Pathologist) system to measure a rich quantitative feature set from the breast cancer epithelium and stroma (6642 features), including both standard morphometric descriptors of image objects and higher-level contextual, relational, and global image features. These measurements were used to construct a prognostic model. We applied the C-Path system to microscopic images from two independent cohorts of breast cancer patients [from the Netherlands Cancer Institute (NKI) cohort, n = 248, and the Vancouver General Hospital (VGH) cohort, n = 328]. The prognostic model score generated by our system was strongly associated with overall survival in both the NKI and the VGH cohorts (both log-rank P ≤ 0.001). This association was independent of clinical, pathological, and molecular factors. Three stromal features were significantly associated with survival, and this association was stronger than the association of survival with epithelial characteristics in the model. These findings implicate stromal morpho- logic structure as a previously unrecognized prognostic determinant for breast cancer. INTRODUCTION In the mid-19th century, it was first appreciated that the process of carcinogenesis produces characteristic morphologic changes in can- cer cells (1). Patey and Scarff showed in 1928 (2) that three histologic features—tubule formation, epithelial nuclear atypia, and epithelial mitotic activity—could each be scored qualitatively, and the assessments could be combined to stratify breast cancer patients into three groups that showed significant survival differences. This semiquantitative mor- phological scoring scheme has been refined over the years (3–5) but still remains the standard technique for histologic grading in invasive breast cancer. Although considerable effort has been devoted recently to molecular profiling for assessment of prognosis and prediction of treatment response in cancer (6, 7), microscopic image assessment is still the most commonly available (and in some places in the world, the only) tool that is financially and logistically feasible. Although the three epithelial features scored in current grading sys- tems are useful in assessing cancer prognosis, valuable prognostic information can also be derived from other factors, including proper- ties of the cancer stroma such as its molecular characteristics (8–15) and morphological features [such as stromal fibrotic focus, a scar- like area in the center of a carcinoma (16)]. Thus, we sought to de- velop a high-accuracy, image-based predictor to identify new clinically predictive morphologic phenotypes of breast cancers, thereby pro- viding new insights into the biological factors driving breast cancer progression. The development of such a system could also address other prob- lems relevant to the clinical treatment of breast cancer. A limitation to the current grading system is that there is considerable variability in histologic grading among pathologists (17), with potentially neg- ative consequences for determining treatment. An automated system could provide an objective method for predicting patient prognosis directly from image data. Moreover, once established, this system could be used in breast cancer clinical trials to provide an accurate, objective means for assessing breast cancer morphologic character- istics, allowing objective stratification of breast cancer patients on the basis of morphologic criteria and facilitating the discovery of mor- phologic features associated with response to specific therapeutic agents. RESULTS Experimental design overview We developed the Computational Pathologist (C-Path), a machine learning–based method for automatically analyzing cancer images and predicting prognosis. To construct and evaluate the model, we acquired hematoxylin and eosin (H&E)–stained histological images from breast cancer tissue microarrays (TMAs) (figs. S4 and S5). The 1 Department of Pathology, Stanford University School of Medicine, Stanford, CA 94305, USA. 2 Biomedical Informatics Training Program, Stanford University School of Medicine, Stanford, CA 94305, USA. 3 Department of Pathology, El Camino Hospital, Mountain View, CA 94040, USA. 4 Genetic Pathology Evaluation Centre, University of British Co- lumbia, Vancouver, British Columbia V6H 3Z6, Canada. 5 Department of Biochemistry, Stanford University, Stanford, CA 94305, USA. 6 Department of Pathology, Academic Medical Center, Meibergdreef 9, 1105AZ Amsterdam, Netherlands. 7 Department of Com- puter Science, Stanford University, Stanford, CA 94305, USA. *Present address: Department of Pathology, Beth Israel Deaconess Medical Center, Harvard Medical School, Boston, MA 02115, USA. †To whom correspondence should be addressed. E-mail: koller@cs.stanford.edu R E S E A R C H A R T I C L E www.ScienceTranslationalMedicine.org 9 November 2011 Vol 3 Issue 108 108ra113 1 Sci Transl Med. 2011 Top stromal features associated with survival. laborious image object identification by skilled pathologists, followed by the measurement of a small number of expert predefined features, primarily characterizing epithelial nuclear characteristics, such as size, color, and texture (21, 36). In contrast, after initial filtering of im- ages to ensure high-quality TMA images and training of the C-Path models using expert-derived image annotations (epithelium and stroma labels to build the epithelial-stromal classifier and survival time and survival status to build the prognostic model), our image analysis system is automated with no manual steps, which greatly in- creases its scalability. Additionally, in contrast to previous approaches, our system measures thousands of morphologic descriptors of diverse elements of the microscopic cancer image, including many relational features from both the cancer epithelium and the stroma, allowing identification of prognostic features whose significance was not pre- viously recognized. Using our system, we built an image-based prognostic model on the NKI data set and showed that in this patient cohort the model was a strong predictor of survival and provided significant additional prognostic information to clinical, molecular, and pathological prog- nostic factors in a multivariate model. We also demonstrated that the image-based prognostic model, built using the NKI data set, is a strong prognostic factor on another, independent data set with very different SD of the ratio of the pixel intensity SD to the mean intensity for pixels within a ring of the center of epithelial nuclei A The sum of the number of unclassified objects SD of the maximum blue pixel value for atypical epithelial nuclei Maximum distance between atypical epithelial nuclei B C D Maximum value of the minimum green pixel intensity value in epithelial contiguous regions Minimum elliptic fit of epithelial contiguous regions SD of distance between epithelial cytoplasmic and nuclear objects Average border between epithelial cytoplasmic objects E F G H Fig. 5. Top epithelial features. The eight panels in the figure (A to H) each shows one of the top-ranking epithelial features from the bootstrap anal- ysis. Left panels, improved prognosis; right panels, worse prognosis. (A) SD of the (SD of intensity/mean intensity) for pixels within a ring of the center of epithelial nuclei. Left, relatively consistent nuclear intensity pattern (low score); right, great nuclear intensity diversity (high score). (B) Sum of the number of unclassified objects. Red, epithelial regions; green, stromal re- score; right, low score. (D) Maximum distance between atypical epithe- lial nuclei. Left, high score; right, low score. (Insets) Red, atypical epithelial nuclei; black, typical epithelial nuclei. (E) Minimum elliptic fit of epithelial contiguous regions. Left, high score; right, low score. (F) SD of distance between epithelial cytoplasmic and nuclear objects. Left, high score; right, low score. (G) Average border between epithelial cytoplasmic objects. Left, high score; right, low score. (H) Maximum value of the minimum green onNovember17,2011stm.sciencemag.orgDownloadedfrom and stromal matrix throughout the image, with thin cords of epithe- lial cells infiltrating through stroma across the image, so that each stromal matrix region borders a relatively constant proportion of ep- ithelial and stromal regions. The stromal feature with the second largest coefficient (Fig. 4B) was the sum of the minimum green in- tensity value of stromal-contiguous regions. This feature received a value of zero when stromal regions contained dark pixels (such as inflammatory nuclei). The feature received a positive value when stromal objects were devoid of dark pixels. This feature provided in- formation about the relationship between stromal cellular composi- tion and prognosis and suggested that the presence of inflammatory cells in the stroma is associated with poor prognosis, a finding con- sistent with previous observations (32). The third most significant stromal feature (Fig. 4C) was a measure of the relative border between spindled stromal nuclei to round stromal nuclei, with an increased rel- ative border of spindled stromal nuclei to round stromal nuclei asso- ciated with worse overall survival. Although the biological underpinning of this morphologic feature is currently not known, this analysis sug- gested that spatial relationships between different populations of stro- mal cell types are associated with breast cancer progression. Reproducibility of C-Path 5YS model predictions on samples with multiple TMA cores For the C-Path 5YS model (which was trained on the full NKI data set), we assessed the intrapatient agreement of model predictions when predictions were made separately on each image contributed by pa- tients in the VGH data set. For the 190 VGH patients who contributed two images with complete image data, the binary predictions (high or low risk) on the individual images agreed with each other for 69% (131 of 190) of the cases and agreed with the prediction on the aver- aged data for 84% (319 of 380) of the images. Using the continuous prediction score (which ranged from 0 to 100), the median of the ab- solute difference in prediction score among the patients with replicate images was 5%, and the Spearman correlation among replicates was 0.27 (P = 0.0002) (fig. S3). This degree of intrapatient agreement is only moderate, and these findings suggest significant intrapatient tumor heterogeneity, which is a cardinal feature of breast carcinomas (33–35). Qualitative visual inspection of images receiving discordant scores suggested that intrapatient variability in both the epithelial and the stromal components is likely to contribute to discordant scores for the individual images. These differences appeared to relate both to the proportions of the epithelium and stroma and to the appearance of the epithelium and stroma. Last, we sought to analyze whether sur- vival predictions were more accurate on the VGH cases that contributed multiple cores compared to the cases that contributed only a single core. This analysis showed that the C-Path 5YS model showed signif- icantly improved prognostic prediction accuracy on the VGH cases for which we had multiple images compared to the cases that con- tributed only a single image (Fig. 7). Together, these findings show a significant degree of intrapatient variability and indicate that increased Heat map of stromal matrix objects mean abs.diff to neighbors H&E image separated into epithelial and stromal objects A B C Worse prognosis Improved prognosis Improved prognosis Improved prognosis Worse prognosis Worse prognosis Fig. 4. Top stromal features associated with survival. (A) Variability in ab- solute difference in intensity between stromal matrix regions and neigh- R E S E A R C H A R T I C L E onNovember17,2011stm.sciencemag.orgDownloadedfrom Top epithelial features.The eight panels in the figure (A to H) each shows one of the top-ranking epithelial features from the bootstrap analysis. Left panels, improved prognosis; right panels, worse prognosis.
- 13. (domain-inspired features) of pathologists of numerous hand-crafted feature-based These features were subsequently used in PERSPECTIVES Patient with suspected malignancy has biopsy and/or surgical resection Deep learning (deep neural network) approach Hand-crafted AI approach Pathologist fixes and sections the tissue specimen, and makes multiple whole slides using several stains Pathologist provides reference comparison for the region of interest based on the problem Pathologist digitizes physical slide using whole-slide scanner; oncologist collates adjoining database of relevant clinical and/or outcome information AI-based approach from both modalities gives a prediction based on input data Prediction is compared against the reference to evaluate performance of the model Performance evaluation is done by reporting area under the curve as well as survival analysis using hazard models Input Convolution Convolutional layer Pooling layer Output Pooling Flattening Construct a hand-crafted model to build the AI-based prediction; classification approach for the clinical problem Pathologist, oncologist, and AI expert use intrinsic domain knowledge to engineer features to be analysed with AI Fig. 2 | Workflow and general framework for artificial intelligence (AI) approaches in digital pathology. Typical steps involved in the use of two popular categories of AI approaches: deep learning and hand-crafted feature engineering. Workflow and general framework for AI approaches in digital pathology Nat Rev Clin Onco 2019
- 14. interoperative tumor diagnosis of surgical specimen cancer immunotherapy response assessment augmentation of pathologists’ manual assessment analytical validity additive effect with pathologist Prediction of genetic characteristic AI in Pathology
- 15. interoperative tumor diagnosis of surgical specimen cancer immunotherapy response assessment augmentation of pathologists’ manual assessment analytical validity additive effect with pathologist Prediction of genetic characteristic AI in Pathology
- 16. ISBI Grand Challenge on Cancer Metastases Detection in Lymph Node
- 18. International Symposium on Biomedical Imaging 2016 H&E Image Processing Framework Train whole slide image sample sample training data normaltumor Test whole slide image overlapping image patches tumor prob. map 1.0 0.0 0.5 Convolutional Neural Network P(tumor)
- 21. Diagnostic Assessment of Deep Learning Algorithms for Detection of Lymph Node Metastases in Women With Breast Cancer Babak Ehteshami Bejnordi, MS; Mitko Veta, PhD; Paul Johannes van Diest, MD, PhD; Bram van Ginneken, PhD; Nico Karssemeijer, PhD; Geert Litjens, PhD; Jeroen A. W. M. van der Laak, PhD; and the CAMELYON16 Consortium IMPORTANCE Application of deep learning algorithms to whole-slide pathology images can potentially improve diagnostic accuracy and efficiency. OBJECTIVE Assess the performance of automated deep learning algorithms at detecting metastases in hematoxylin and eosin–stained tissue sections of lymph nodes of women with breast cancer and compare it with pathologists’ diagnoses in a diagnostic setting. DESIGN, SETTING, AND PARTICIPANTS Researcher challenge competition (CAMELYON16) to develop automated solutions for detecting lymph node metastases (November 2015-November 2016). A training data set of whole-slide images from 2 centers in the Netherlands with (n = 110) and without (n = 160) nodal metastases verified by immunohistochemical staining were provided to challenge participants to build algorithms. Algorithm performance was evaluated in an independent test set of 129 whole-slide images (49 with and 80 without metastases). The same test set of corresponding glass slides was also evaluated by a panel of 11 pathologists with time constraint (WTC) from the Netherlands to ascertain likelihood of nodal metastases for each slide in a flexible 2-hour session, simulating routine pathology workflow, and by 1 pathologist without time constraint (WOTC). EXPOSURES Deep learning algorithms submitted as part of a challenge competition or pathologist interpretation. MAIN OUTCOMES AND MEASURES Thepresenceofspecificmetastaticfociandtheabsencevs presenceoflymphnodemetastasisinaslideorimageusingreceiveroperatingcharacteristic curveanalysis.The11pathologistsparticipatinginthesimulationexerciseratedtheirdiagnostic confidenceasdefinitelynormal,probablynormal,equivocal,probablytumor,ordefinitelytumor. RESULTS The area under the receiver operating characteristic curve (AUC) for the algorithms ranged from 0.556 to 0.994. The top-performing algorithm achieved a lesion-level, true-positive fraction comparable with that of the pathologist WOTC (72.4% [95% CI, 64.3%-80.4%]) at a mean of 0.0125 false-positives per normal whole-slide image. For the whole-slide image classification task, the best algorithm (AUC, 0.994 [95% CI, 0.983-0.999]) performed significantly better than the pathologists WTC in a diagnostic simulation (mean AUC, 0.810 [range, 0.738-0.884]; P < .001). The top 5 algorithms had a mean AUC that was comparable with the pathologist interpreting the slides in the absence of time constraints (mean AUC, 0.960 [range, 0.923-0.994] for the top 5 algorithms vs 0.966 [95% CI, 0.927-0.998] for the pathologist WOTC). CONCLUSIONS AND RELEVANCE In the setting of a challenge competition, some deep learning algorithms achieved better diagnostic performance than a panel of 11 pathologists participating in a simulation exercise designed to mimic routine pathology workflow; algorithm performance was comparable with an expert pathologist interpreting whole-slide images without time constraints. Whether this approach has clinical utility will require evaluation in a clinical setting. JAMA. 2017;318(22):2199-2210. doi:10.1001/jama.2017.14585 Editorial page 2184 Related articles page 2211 and page 2250 Supplemental content CME Quiz at jamanetwork.com/learning and CME Questions page 2252 Author Affiliations: Diagnostic Image Analysis Group, Department of Radiology and Nuclear Medicine, Radboud University Medical Center, Nijmegen, the Netherlands (Ehteshami Bejnordi, van Ginneken, Karssemeijer); Medical Image Analysis Group, Eindhoven University of Technology, Eindhoven, the Netherlands (Veta); Department of Pathology, University Medical Center Utrecht, Utrecht, the Netherlands (Johannes van Diest); Department of Pathology, Radboud University Medical Center, Nijmegen, the Netherlands (Litjens, van der Laak). GroupInformation:TheCAMELYON16 Consortiumauthorsandcollaboratorsare listedattheendofthisarticle. Corresponding Author: Babak Ehteshami Bejnordi, MS, Radboud University Medical Center, Postbus 9101, 6500 HB Nijmegen (ehteshami@babakint.com). Research JAMA | Original Investigation (Reprinted) 2199 © 2017 American Medical Association. All rights reserved. Downloaded From: by a University of Florida User on 12/13/2017 JAMA 2017
- 22. Diagnostic Assessment of Deep Learning Algorithms for Detection of Lymph Node Metastases in Women With Breast Cancer Babak Ehteshami Bejnordi, MS; Mitko Veta, PhD; Paul Johannes van Diest, MD, PhD; Bram van Ginneken, PhD; Nico Karssemeijer, PhD; Geert Litjens, PhD; Jeroen A. W. M. van der Laak, PhD; and the CAMELYON16 Consortium IMPORTANCE Application of deep learning algorithms to whole-slide pathology images can potentially improve diagnostic accuracy and efficiency. OBJECTIVE Assess the performance of automated deep learning algorithms at detecting metastases in hematoxylin and eosin–stained tissue sections of lymph nodes of women with breast cancer and compare it with pathologists’ diagnoses in a diagnostic setting. DESIGN, SETTING, AND PARTICIPANTS Researcher challenge competition (CAMELYON16) to develop automated solutions for detecting lymph node metastases (November 2015-November 2016). A training data set of whole-slide images from 2 centers in the Netherlands with (n = 110) and without (n = 160) nodal metastases verified by immunohistochemical staining were provided to challenge participants to build algorithms. Algorithm performance was evaluated in an independent test set of 129 whole-slide images (49 with and 80 without metastases). The same test set of corresponding glass slides was also evaluated by a panel of 11 pathologists with time constraint (WTC) from the Netherlands to ascertain likelihood of nodal metastases for each slide in a flexible 2-hour session, simulating routine pathology workflow, and by 1 pathologist without time constraint (WOTC). EXPOSURES Deep learning algorithms submitted as part of a challenge competition or pathologist interpretation. MAIN OUTCOMES AND MEASURES Thepresenceofspecificmetastaticfociandtheabsencevs presenceoflymphnodemetastasisinaslideorimageusingreceiveroperatingcharacteristic curveanalysis.The11pathologistsparticipatinginthesimulationexerciseratedtheirdiagnostic confidenceasdefinitelynormal,probablynormal,equivocal,probablytumor,ordefinitelytumor. RESULTS The area under the receiver operating characteristic curve (AUC) for the algorithms ranged from 0.556 to 0.994. The top-performing algorithm achieved a lesion-level, true-positive fraction comparable with that of the pathologist WOTC (72.4% [95% CI, 64.3%-80.4%]) at a mean of 0.0125 false-positives per normal whole-slide image. For the whole-slide image classification task, the best algorithm (AUC, 0.994 [95% CI, 0.983-0.999]) performed significantly better than the pathologists WTC in a diagnostic simulation (mean AUC, 0.810 [range, 0.738-0.884]; P < .001). The top 5 algorithms had a mean AUC that was comparable with the pathologist interpreting the slides in the absence of time constraints (mean AUC, 0.960 [range, 0.923-0.994] for the top 5 algorithms vs 0.966 [95% CI, 0.927-0.998] for the pathologist WOTC). CONCLUSIONS AND RELEVANCE In the setting of a challenge competition, some deep learning algorithms achieved better diagnostic performance than a panel of 11 pathologists participating in a simulation exercise designed to mimic routine pathology workflow; algorithm performance was comparable with an expert pathologist interpreting whole-slide images without time constraints. Whether this approach has clinical utility will require evaluation in a clinical setting. JAMA. 2017;318(22):2199-2210. doi:10.1001/jama.2017.14585 Editorial page 2184 Related articles page 2211 and page 2250 Supplemental content CME Quiz at jamanetwork.com/learning and CME Questions page 2252 Author Affiliations: Diagnostic Image Analysis Group, Department of Radiology and Nuclear Medicine, Radboud University Medical Center, Nijmegen, the Netherlands (Ehteshami Bejnordi, van Ginneken, Karssemeijer); Medical Image Analysis Group, Eindhoven University of Technology, Eindhoven, the Netherlands (Veta); Department of Pathology, University Medical Center Utrecht, Utrecht, the Netherlands (Johannes van Diest); Department of Pathology, Radboud University Medical Center, Nijmegen, the Netherlands (Litjens, van der Laak). GroupInformation:TheCAMELYON16 Consortiumauthorsandcollaboratorsare listedattheendofthisarticle. Corresponding Author: Babak Ehteshami Bejnordi, MS, Radboud University Medical Center, Postbus 9101, 6500 HB Nijmegen (ehteshami@babakint.com). Research JAMA | Original Investigation (Reprinted) 2199 © 2017 American Medical Association. All rights reserved. Downloaded From: by a University of Florida User on 12/13/2017 cells in cases for which lear. This illustrates the erlooking tumor cells in sue sections. At the slide and specificity for the thologists in a routine di- WTC assessed the SLNs esembled diagnostic prac- IHCismandatoryforcases xylin and eosin–stained ogist WOTC interpreting were less accurate, espe- tained micrometastases. gist on the panel missed only micrometastases. ten missed. Specificity re- k did not lead to a high rate imilar true-positive frac- en producing a mean of whole-slide images and Figure 1. FROC Curves of the Top 5 Performing Algorithms vs Pathologist WOTC for the Metastases Identification Task (Task 1) From the CAMELYON16 Competition 1.0 0.8 0.6 0.4 0.2 0 0 8 MetastasesDetectionSensitivity Mean No. of False-Positives per Whole-Slide Image 0.25 0.5 1 2 4 Diagnostic machine-learning algorithm teams CULab III HMS and MIT II HMS and MGH III HMS and MGH II HMS and MIT I Pathologist WOTC 0.125 CAMELYON16 indicates Cancer Metastases in Lymph Nodes Challenge 2016; CULab, Chinese University Lab; FROC, free-response receiver operator characteristic; HMS, Harvard Medical School; MGH, Massachusetts General Hospital; MIT, Massachusetts Institute of Technology; WOTC, without time constraint. The range on the x-axis is linear between 0 and 0.125 (blue) and base ristic; HMS, Harvard Medical MIT, Massachusetts Institute of TC, with time constraint. iled a description of each Supplement. For a glossary in the Supplement. Table) to lowest (bottom of true-positive fraction scores (FROC scores) and AUCs. d The results of the significant test with MRMC ROC analysis for the comparison of each individual algorithm with the pathologists WTC. The P values were adjusted for multiple comparisons using the Bonferroni correction, in which the P values are multiplied by the number of comparisons (32; comparison of the 32 submitted algorithms with the panel of pathologists). FROC Curves of the Top 5 Performing Algorithms vs. Pathologist WOTC for the Metastases Identification Task (Task 1) From the CAMELYON16 Competition JAMA 2017
- 23. Diagnostic Assessment of Deep Learning Algorithms for Detection of Lymph Node Metastases in Women With Breast Cancer Babak Ehteshami Bejnordi, MS; Mitko Veta, PhD; Paul Johannes van Diest, MD, PhD; Bram van Ginneken, PhD; Nico Karssemeijer, PhD; Geert Litjens, PhD; Jeroen A. W. M. van der Laak, PhD; and the CAMELYON16 Consortium IMPORTANCE Application of deep learning algorithms to whole-slide pathology images can potentially improve diagnostic accuracy and efficiency. OBJECTIVE Assess the performance of automated deep learning algorithms at detecting metastases in hematoxylin and eosin–stained tissue sections of lymph nodes of women with breast cancer and compare it with pathologists’ diagnoses in a diagnostic setting. DESIGN, SETTING, AND PARTICIPANTS Researcher challenge competition (CAMELYON16) to develop automated solutions for detecting lymph node metastases (November 2015-November 2016). A training data set of whole-slide images from 2 centers in the Netherlands with (n = 110) and without (n = 160) nodal metastases verified by immunohistochemical staining were provided to challenge participants to build algorithms. Algorithm performance was evaluated in an independent test set of 129 whole-slide images (49 with and 80 without metastases). The same test set of corresponding glass slides was also evaluated by a panel of 11 pathologists with time constraint (WTC) from the Netherlands to ascertain likelihood of nodal metastases for each slide in a flexible 2-hour session, simulating routine pathology workflow, and by 1 pathologist without time constraint (WOTC). EXPOSURES Deep learning algorithms submitted as part of a challenge competition or pathologist interpretation. MAIN OUTCOMES AND MEASURES Thepresenceofspecificmetastaticfociandtheabsencevs presenceoflymphnodemetastasisinaslideorimageusingreceiveroperatingcharacteristic curveanalysis.The11pathologistsparticipatinginthesimulationexerciseratedtheirdiagnostic confidenceasdefinitelynormal,probablynormal,equivocal,probablytumor,ordefinitelytumor. RESULTS The area under the receiver operating characteristic curve (AUC) for the algorithms ranged from 0.556 to 0.994. The top-performing algorithm achieved a lesion-level, true-positive fraction comparable with that of the pathologist WOTC (72.4% [95% CI, 64.3%-80.4%]) at a mean of 0.0125 false-positives per normal whole-slide image. For the whole-slide image classification task, the best algorithm (AUC, 0.994 [95% CI, 0.983-0.999]) performed significantly better than the pathologists WTC in a diagnostic simulation (mean AUC, 0.810 [range, 0.738-0.884]; P < .001). The top 5 algorithms had a mean AUC that was comparable with the pathologist interpreting the slides in the absence of time constraints (mean AUC, 0.960 [range, 0.923-0.994] for the top 5 algorithms vs 0.966 [95% CI, 0.927-0.998] for the pathologist WOTC). CONCLUSIONS AND RELEVANCE In the setting of a challenge competition, some deep learning algorithms achieved better diagnostic performance than a panel of 11 pathologists participating in a simulation exercise designed to mimic routine pathology workflow; algorithm performance was comparable with an expert pathologist interpreting whole-slide images without time constraints. Whether this approach has clinical utility will require evaluation in a clinical setting. JAMA. 2017;318(22):2199-2210. doi:10.1001/jama.2017.14585 Editorial page 2184 Related articles page 2211 and page 2250 Supplemental content CME Quiz at jamanetwork.com/learning and CME Questions page 2252 Author Affiliations: Diagnostic Image Analysis Group, Department of Radiology and Nuclear Medicine, Radboud University Medical Center, Nijmegen, the Netherlands (Ehteshami Bejnordi, van Ginneken, Karssemeijer); Medical Image Analysis Group, Eindhoven University of Technology, Eindhoven, the Netherlands (Veta); Department of Pathology, University Medical Center Utrecht, Utrecht, the Netherlands (Johannes van Diest); Department of Pathology, Radboud University Medical Center, Nijmegen, the Netherlands (Litjens, van der Laak). GroupInformation:TheCAMELYON16 Consortiumauthorsandcollaboratorsare listedattheendofthisarticle. Corresponding Author: Babak Ehteshami Bejnordi, MS, Radboud University Medical Center, Postbus 9101, 6500 HB Nijmegen (ehteshami@babakint.com). Research JAMA | Original Investigation (Reprinted) 2199 © 2017 American Medical Association. All rights reserved. Downloaded From: by a University of Florida User on 12/13/2017 JAMA 2017 Figure 3. ROC Curves of the Top-Performing Algorithms vs Pathologists for Metastases Classification (Task 2) From the CAMELYON16 Competition 1.0 0.8 1.0 0.9 1.0 0.9 0.8 0.6 0.7 0.5 1.0 0.8 0.6 0.4 CULab III HMS and MIT II HMS and MGH III HMS and MGH II HMS and MIT I Pathologist WOTC Pathologist WTC 0.2 0 0 1.00.8 Sensitivity 1–Specificity 0.60.40.2 0 0.10 1–Specificity 0.080.060.040.02 Comparison of top 5 machine learning system teams and pathologistsA Mean of pathologists WTC HMS and MIT II HMS and MGH III Pathologist WOTC Pathologist with Comparison of top 2 machine learning system teams and pathologistsB 0.4 Machine Learning Detection of Breast Cancer Lymph Node Metastases Original Investigation Research ROC Curves of the Top-Performing Algorithms vs. Pathologists for Metastases Classification (Task 2) From the CAMELYON16 Competition
- 24. 구글의 유방 병리 판독 인공지능 • The localization score(FROC) for the algorithm reached 89%, which significantly exceeded the score of 73% for a pathologist with no time constraint. Yun Liu et al. Detecting Cancer Metastases on Gigapixel Pathology Images (2017)
- 25. 인공지능의 민감도 + 인간의 특이도 Yun Liu et al. Detecting Cancer Metastases on Gigapixel Pathology Images (2017) • 구글의 인공지능은 민감도에서 큰 개선 (92.9%, 88.5%) •@8FP: FP를 8개까지 봐주면서, 달성할 수 있는 민감도 •FROC: FP를 슬라이드당 1/4, 1/2, 1, 2, 4, 8개를 허용한 민감도의 평균 •즉, FP를 조금 봐준다면, 인공지능은 매우 높은 민감도를 달성 가능 • 인간 병리학자는 민감도 73%에 반해, 특이도는 거의 100% 달성 •인간 병리학자와 인공지능 병리학자는 서로 잘하는 것이 다름 •양쪽이 협력하면 판독 효율성, 일관성, 민감도 등에서 개선 기대 가능
- 26. ARTICLES https://doi.org/10.1038/s41591-018-0177-5 1 Applied Bioinformatics Laboratories, New York University School of Medicine, New York, NY, USA. 2 Skirball Institute, Department of Cell Biology, New York University School of Medicine, New York, NY, USA. 3 Department of Pathology, New York University School of Medicine, New York, NY, USA. 4 School of Mechanical Engineering, National Technical University of Athens, Zografou, Greece. 5 Institute for Systems Genetics, New York University School of Medicine, New York, NY, USA. 6 Department of Biochemistry and Molecular Pharmacology, New York University School of Medicine, New York, NY, USA. 7 Center for Biospecimen Research and Development, New York University, New York, NY, USA. 8 Department of Population Health and the Center for Healthcare Innovation and Delivery Science, New York University School of Medicine, New York, NY, USA. 9 These authors contributed equally to this work: Nicolas Coudray, Paolo Santiago Ocampo. *e-mail: narges.razavian@nyumc.org; aristotelis.tsirigos@nyumc.org A ccording to the American Cancer Society and the Cancer Statistics Center (see URLs), over 150,000 patients with lung cancer succumb to the disease each year (154,050 expected for 2018), while another 200,000 new cases are diagnosed on a yearly basis (234,030 expected for 2018). It is one of the most widely spread cancers in the world because of not only smoking, but also exposure to toxic chemicals like radon, asbestos and arsenic. LUAD and LUSC are the two most prevalent types of non–small cell lung cancer1 , and each is associated with discrete treatment guidelines. In the absence of definitive histologic features, this important distinc- tion can be challenging and time-consuming, and requires confir- matory immunohistochemical stains. Classification of lung cancer type is a key diagnostic process because the available treatment options, including conventional chemotherapy and, more recently, targeted therapies, differ for LUAD and LUSC2 . Also, a LUAD diagnosis will prompt the search for molecular biomarkers and sensitizing mutations and thus has a great impact on treatment options3,4 . For example, epidermal growth factor receptor (EGFR) mutations, present in about 20% of LUAD, and anaplastic lymphoma receptor tyrosine kinase (ALK) rearrangements, present in<5% of LUAD5 , currently have tar- geted therapies approved by the Food and Drug Administration (FDA)6,7 . Mutations in other genes, such as KRAS and tumor pro- tein P53 (TP53) are very common (about 25% and 50%, respec- tively) but have proven to be particularly challenging drug targets so far5,8 . Lung biopsies are typically used to diagnose lung cancer type and stage. Virtual microscopy of stained images of tissues is typically acquired at magnifications of 20×to 40×, generating very large two-dimensional images (10,000 to>100,000 pixels in each dimension) that are oftentimes challenging to visually inspect in an exhaustive manner. Furthermore, accurate interpretation can be difficult, and the distinction between LUAD and LUSC is not always clear, particularly in poorly differentiated tumors; in this case, ancil- lary studies are recommended for accurate classification9,10 . To assist experts, automatic analysis of lung cancer whole-slide images has been recently studied to predict survival outcomes11 and classifica- tion12 . For the latter, Yu et al.12 combined conventional thresholding and image processing techniques with machine-learning methods, such as random forest classifiers, support vector machines (SVM) or Naive Bayes classifiers, achieving an AUC of ~0.85 in distinguishing normal from tumor slides, and ~0.75 in distinguishing LUAD from LUSC slides. More recently, deep learning was used for the classi- fication of breast, bladder and lung tumors, achieving an AUC of 0.83 in classification of lung tumor types on tumor slides from The Cancer Genome Atlas (TCGA)13 . Analysis of plasma DNA values was also shown to be a good predictor of the presence of non–small cell cancer, with an AUC of ~0.94 (ref. 14 ) in distinguishing LUAD from LUSC, whereas the use of immunochemical markers yields an AUC of ~0.94115 . Here, we demonstrate how the field can further benefit from deep learning by presenting a strategy based on convolutional neural networks (CNNs) that not only outperforms methods in previously Classification and mutation prediction from non–small cell lung cancer histopathology images using deep learning Nicolas Coudray 1,2,9 , Paolo Santiago Ocampo3,9 , Theodore Sakellaropoulos4 , Navneet Narula3 , Matija Snuderl3 , David Fenyö5,6 , Andre L. Moreira3,7 , Narges Razavian 8 * and Aristotelis Tsirigos 1,3 * Visual inspection of histopathology slides is one of the main methods used by pathologists to assess the stage, type and sub- type of lung tumors. Adenocarcinoma (LUAD) and squamous cell carcinoma (LUSC) are the most prevalent subtypes of lung cancer, and their distinction requires visual inspection by an experienced pathologist. In this study, we trained a deep con- volutional neural network (inception v3) on whole-slide images obtained from The Cancer Genome Atlas to accurately and automatically classify them into LUAD, LUSC or normal lung tissue. The performance of our method is comparable to that of pathologists, with an average area under the curve (AUC) of 0.97. Our model was validated on independent datasets of frozen tissues, formalin-fixed paraffin-embedded tissues and biopsies. Furthermore, we trained the network to predict the ten most commonly mutated genes in LUAD. We found that six of them—STK11, EGFR, FAT1, SETBP1, KRAS and TP53—can be pre- dicted from pathology images, with AUCs from 0.733 to 0.856 as measured on a held-out population. These findings suggest that deep-learning models can assist pathologists in the detection of cancer subtype or gene mutations. Our approach can be applied to any cancer type, and the code is available at https://github.com/ncoudray/DeepPATH. NATURE MEDICINE | www.nature.com/naturemedicine • TCGA의 병리 이미지(whole-slide image)를 구글넷(Inception v3)으로 학습 • 정상, adenocarcinoma(LUAD), squamous cell carcinoma(LUSC) 정확하게 구분 • Tumor vs. normal, LUAD vs. LUSC 의 구분에 AUC 0.99, 0.95 이상 • Normal, LUAD, LUSC 중 하나를 다른 두 가지와 구분하는 것도 5x 20x 모두 AUC 0.9 이상 • 이 정확도는 세 명의 병리과 전문의와 동등한 수준 • 딥러닝이 틀린 것 중에 50%는, 병리과 전문의 세 명 중 적어도 한 명이 틀렸고, • 병리과 전문의 세 명 중 적어도 한 명이 틀린 케이스 중, 83%는 딥러닝이 정확히 분류했다. Nat Med 2018
- 27. • 더 나아가서 TCGA를 바탕으로 개발된 인공지능을, • 완전히 독립적인 데이터셋, 특히 fresh frozen, FFPE, biopsy 의 세 가지 방식으로 얻은 • LUAD, LUSC 데이터에 적용해보았을 때에도 대부분 AUC 0.9 이상으로 정확하게 판독 fibrosis, inflammation or blood was also present, but also in very poorly differentiated tumors. Sections obtained from biopsies are usually much smaller, which reduces the number of tiles per slide, but the performance of our model remains consistent for the 102 samples tested (AUC ~0.834–0.861 using 20×magnification and 0.871–0.928 using 5×magnification; Fig. 2c), and the accuracy the tumor area on the frozen and FFPE samples, then applied this model to the biopsies and finally applied the TCGA-trained three- way classifier on the tumor area selected by the automatic tumor selection model. The per-tile AUC of the automatic tumor selection model (using the pathologist’s tumor selection as reference) was 0.886 (CI, 0.880–0.891) for the biopsies, 0.797 (CI, 0.795–0.800) LUAD at 5× AUC = 0.919, CI = 0.861–0.949 1 a b c 0.5 Truepositive 0 0 0.5 False positive 1 1 0.5 Truepositive 0 0 0.5 False positive 1 1 0.5 Truepositive 0 0 0.5 False positive 1 Frozen FFPE Biopsies LUSC at 5× AUC = 0.977, CI = 0.949–0.995 LUAD at 20× AUC = 0.913, CI = 0.849–0.963 LUSC at 20× AUC = 0.941, CI = 0.894–0.977 LUAD at 5× AUC = 0.861, CI = 0.792–0.919 LUSC at 5× AUC = 0.975, CI = 0.945–0.996 LUAD at 20× AUC = 0.833, CI = 0.762–0.894 LUSC at 20× AUC = 0.932, CI = 0.884–0.971 LUAD at 5× AUC = 0.871, CI = 0.784–0.938 LUSC at 5× AUC = 0.928, CIs = 0.871–0.972 LUAD at 20× AUC = 0.834, CI = 0.743–0.909 LUSC at 20× AUC = 0.861, CI = 0.780–0.928 Fig. 2 | Classification of presence and type of tumor on alternative cohorts. a–c, Receiver operating characteristic (ROC) curves (left) from tests on frozen sections (n=98 biologically independent slides) (a), FFPE sections (n=140 biologically independent slides) (b) and biopsies (n=102 biologically independent slides) from NYU Langone Medical Center (c). On the right of each plot, we show examples of raw images with an overlap in light gray of the mask generated by a pathologist and the corresponding heatmaps obtained with the three-way classifier. Scale bars, 1mm. Frozen FFPE Biopsy
- 28. interoperative tumor diagnosis of surgical specimen cancer immunotherapy response assessment augmentation of pathologists’ manual assessment analytical validity additive effect with pathologist Prediction of genetic characteristic AI in Pathology
- 29. https://www.facebook.com/groups/TensorFlowKR/permalink/633902253617503/ 구글 엔지니어들이 AACR 2018 에서 의료 인공지능 기조 연설
- 30. Downloadedfromhttps://journals.lww.com/ajspbyBhDMf5ePHKav1zEoum1tQfN4a+kJLhEZgbsIHo4XMi0hCywCX1AWnYQp/IlQrHD3MyLIZIvnCFZVJ56DGsD590P5lh5KqE20T/dBX3x9CoM=on10/14/2018 Impact of Deep Learning Assistance on the Histopathologic Review of Lymph Nodes for Metastatic Breast Cancer David F. Steiner, MD, PhD,* Robert MacDonald, PhD,* Yun Liu, PhD,* Peter Truszkowski, MD,* Jason D. Hipp, MD, PhD, FCAP,* Christopher Gammage, MS,* Florence Thng, MS,† Lily Peng, MD, PhD,* and Martin C. Stumpe, PhD* Abstract: Advances in the quality of whole-slide images have set the stage for the clinical use of digital images in anatomic pathology. Along with advances in computer image analysis, this raises the possibility for computer-assisted diagnostics in pathology to improve histopathologic interpretation and clinical care. To evaluate the potential impact of digital assistance on interpretation of digitized slides, we conducted a multireader multicase study utilizing our deep learning algorithm for the detection of breast cancer metastasis in lymph nodes. Six pathologists reviewed 70 digitized slides from lymph node sections in 2 reader modes, unassisted and assisted, with a wash- out period between sessions. In the assisted mode, the deep learning algorithm was used to identify and outline regions with high like- lihood of containing tumor. Algorithm-assisted pathologists demon- strated higher accuracy than either the algorithm or the pathologist alone. In particular, algorithm assistance significantly increased the sensitivity of detection for micrometastases (91% vs. 83%, P=0.02). In addition, average review time per image was significantly shorter with assistance than without assistance for both micrometastases (61 vs. 116 s, P=0.002) and negative images (111 vs. 137 s, P=0.018). Lastly, pathologists were asked to provide a numeric score regarding the difficulty of each image classification. On the basis of this score, pathologists considered the image review of micrometastases to be significantly easier when interpreted with assistance (P=0.0005). Utilizing a proof of concept assistant tool, this study demonstrates the potential of a deep learning algorithm to improve pathologist accu- racy and efficiency in a digital pathology workflow. Key Words: artificial intelligence, machine learning, digital pathology, breast cancer, computer aided detection (Am J Surg Pathol 2018;00:000–000) The regulatory approval and gradual implementation of whole-slide scanners has enabled the digitization of glass slides for remote consults and archival purposes.1 Digitiza- tion alone, however, does not necessarily improve the con- sistency or efficiency of a pathologist’s primary workflow. In fact, image review on a digital medium can be slightly slower than on glass, especially for pathologists with limited digital pathology experience.2 However, digital pathology and image analysis tools have already demonstrated po- tential benefits, including the potential to reduce inter-reader variability in the evaluation of breast cancer HER2 status.3,4 Digitization also opens the door for assistive tools based on Artificial Intelligence (AI) to improve efficiency and con- sistency, decrease fatigue, and increase accuracy.5 Among AI technologies, deep learning has demon- strated strong performance in many automated image-rec- ognition applications.6–8 Recently, several deep learning– based algorithms have been developed for the detection of breast cancer metastases in lymph nodes as well as for other applications in pathology.9,10 Initial findings suggest that some algorithms can even exceed a pathologist’s sensitivity for detecting individual cancer foci in digital images. How- ever, this sensitivity gain comes at the cost of increased false positives, potentially limiting the utility of such algorithms for automated clinical use.11 In addition, deep learning algo- rithms are inherently limited to the task for which they have been specifically trained. While we have begun to understand the strengths of these algorithms (such as exhaustive search) and their weaknesses (sensitivity to poor optical focus, tumor mimics; manuscript under review), the potential clinical util- ity of such algorithms has not been thoroughly examined. While an accurate algorithm alone will not necessarily aid pathologists or improve clinical interpretation, these benefits may be achieved through thoughtful and appropriate in- tegration of algorithm predictions into the clinical workflow.8 From the *Google AI Healthcare; and †Verily Life Sciences, Mountain View, CA. D.F.S., R.M., and Y.L. are co-first authors (equal contribution). Work done as part of the Google Brain Healthcare Technology Fellowship (D.F.S. and P.T.). Conflicts of Interest and Source of Funding: D.F.S., R.M., Y.L., P.T., J.D.H., C.G., F.T., L.P., M.C.S. are employees of Alphabet and have Alphabet stock. Correspondence: David F. Steiner, MD, PhD, Google AI Healthcare, 1600 Amphitheatre Way, Mountain View, CA 94043 (e-mail: davesteiner@google.com). Supplemental Digital Content is available for this article. Direct URL citations appear in the printed text and are provided in the HTML and PDF versions of this article on the journal’s website, www.ajsp.com. Copyright © 2018 The Author(s). Published by Wolters Kluwer Health, Inc. This is an open-access article distributed under the terms of the Creative Commons Attribution-Non Commercial-No Derivatives License 4.0 (CCBY-NC-ND), where it is permissible to download and share the work provided it is properly cited. The work cannot be changed in any way or used commercially without permission from the journal. ORIGINAL ARTICLE Am J Surg Pathol Volume 00, Number 00, ’’ 2018 www.ajsp.com | 1 • 구글이 개발한 병리 인공지능, LYNA(LYmph Node Assistant) • 유방암의 림프절 전이에 대해서, • 병리학 전문의 + 인공지능의 시너지를 증명하는 연구 • 정확성(민감도) / 판독 시간 / (micrometa의) 판독 난이도 Am J Sure Pathol 2018
- 31. Downloadedfromhttps://journals.lww.com/ajspbyBhDMf5ePHKav1zEoum1tQfN4a+kJLhEZgbsIHo4XMi0hCywCX1AWnYQp/IlQrHD3MyLIZIvnCFZVJ56DGsD590P5lh5KqE20T/dBX3x9CoM=on10/14/2018 Impact of Deep Learning Assistance on the Histopathologic Review of Lymph Nodes for Metastatic Breast Cancer David F. Steiner, MD, PhD,* Robert MacDonald, PhD,* Yun Liu, PhD,* Peter Truszkowski, MD,* Jason D. Hipp, MD, PhD, FCAP,* Christopher Gammage, MS,* Florence Thng, MS,† Lily Peng, MD, PhD,* and Martin C. Stumpe, PhD* Abstract: Advances in the quality of whole-slide images have set the stage for the clinical use of digital images in anatomic pathology. Along with advances in computer image analysis, this raises the possibility for computer-assisted diagnostics in pathology to improve histopathologic interpretation and clinical care. To evaluate the potential impact of digital assistance on interpretation of digitized slides, we conducted a multireader multicase study utilizing our deep learning algorithm for the detection of breast cancer metastasis in lymph nodes. Six pathologists reviewed 70 digitized slides from lymph node sections in 2 reader modes, unassisted and assisted, with a wash- out period between sessions. In the assisted mode, the deep learning algorithm was used to identify and outline regions with high like- lihood of containing tumor. Algorithm-assisted pathologists demon- strated higher accuracy than either the algorithm or the pathologist alone. In particular, algorithm assistance significantly increased the sensitivity of detection for micrometastases (91% vs. 83%, P=0.02). In addition, average review time per image was significantly shorter with assistance than without assistance for both micrometastases (61 vs. 116 s, P=0.002) and negative images (111 vs. 137 s, P=0.018). Lastly, pathologists were asked to provide a numeric score regarding the difficulty of each image classification. On the basis of this score, pathologists considered the image review of micrometastases to be significantly easier when interpreted with assistance (P=0.0005). Utilizing a proof of concept assistant tool, this study demonstrates the potential of a deep learning algorithm to improve pathologist accu- racy and efficiency in a digital pathology workflow. Key Words: artificial intelligence, machine learning, digital pathology, breast cancer, computer aided detection (Am J Surg Pathol 2018;00:000–000) The regulatory approval and gradual implementation of whole-slide scanners has enabled the digitization of glass slides for remote consults and archival purposes.1 Digitiza- tion alone, however, does not necessarily improve the con- sistency or efficiency of a pathologist’s primary workflow. In fact, image review on a digital medium can be slightly slower than on glass, especially for pathologists with limited digital pathology experience.2 However, digital pathology and image analysis tools have already demonstrated po- tential benefits, including the potential to reduce inter-reader variability in the evaluation of breast cancer HER2 status.3,4 Digitization also opens the door for assistive tools based on Artificial Intelligence (AI) to improve efficiency and con- sistency, decrease fatigue, and increase accuracy.5 Among AI technologies, deep learning has demon- strated strong performance in many automated image-rec- ognition applications.6–8 Recently, several deep learning– based algorithms have been developed for the detection of breast cancer metastases in lymph nodes as well as for other applications in pathology.9,10 Initial findings suggest that some algorithms can even exceed a pathologist’s sensitivity for detecting individual cancer foci in digital images. How- ever, this sensitivity gain comes at the cost of increased false positives, potentially limiting the utility of such algorithms for automated clinical use.11 In addition, deep learning algo- rithms are inherently limited to the task for which they have been specifically trained. While we have begun to understand the strengths of these algorithms (such as exhaustive search) and their weaknesses (sensitivity to poor optical focus, tumor mimics; manuscript under review), the potential clinical util- ity of such algorithms has not been thoroughly examined. While an accurate algorithm alone will not necessarily aid pathologists or improve clinical interpretation, these benefits may be achieved through thoughtful and appropriate in- tegration of algorithm predictions into the clinical workflow.8 From the *Google AI Healthcare; and †Verily Life Sciences, Mountain View, CA. D.F.S., R.M., and Y.L. are co-first authors (equal contribution). Work done as part of the Google Brain Healthcare Technology Fellowship (D.F.S. and P.T.). Conflicts of Interest and Source of Funding: D.F.S., R.M., Y.L., P.T., J.D.H., C.G., F.T., L.P., M.C.S. are employees of Alphabet and have Alphabet stock. Correspondence: David F. Steiner, MD, PhD, Google AI Healthcare, 1600 Amphitheatre Way, Mountain View, CA 94043 (e-mail: davesteiner@google.com). Supplemental Digital Content is available for this article. Direct URL citations appear in the printed text and are provided in the HTML and PDF versions of this article on the journal’s website, www.ajsp.com. Copyright © 2018 The Author(s). Published by Wolters Kluwer Health, Inc. This is an open-access article distributed under the terms of the Creative Commons Attribution-Non Commercial-No Derivatives License 4.0 (CCBY-NC-ND), where it is permissible to download and share the work provided it is properly cited. The work cannot be changed in any way or used commercially without permission from the journal. ORIGINAL ARTICLE Am J Surg Pathol Volume 00, Number 00, ’’ 2018 www.ajsp.com | 1 modality and session (mode 1 or mode 2) treated as fixed effects. For statistical significance evaluation, P-values were obtained using the Likelihood Ratio Test with the anova function in R, comparing the full model to a null model with the fixed effect of interest (eg, assistance mode) removed. For statistical significance of accuracy, binomial mixed-effect models across all observations were generated using the glmer function. All models were generated using the lme4 package in R and each category (eg, negative or micrometastases) was modeled separately. details in Supplemental Table 2, Supplementary Digital Content 1, http://links.lww.com/PAS/A677). Classification Accuracy The overall mean sensitivity for detection of meta- stases by the pathologists in this study was 94.6% (95% confidence interval [CI], 93.4%-95.8%). To evaluate the impact of the assisted read on accuracy, we analyzed per- formance by case category and assistance modality (Fig. 3A). For micrometastases, sensitivity was significantly higher with Negative (Specificity) Micromet (Sensitivity) Macromet (Sensitivity) 0.7 0.5 0.6 0.8 0.9 1.0 p=0.02 A B Performance Unassisted Assisted FIGURE 3. Improved metastasis detection with algorithm assistance. A, Data represents performance across all images by image category and assistance modality. Error bars indicate SE. The performance metric corresponds to corresponds to specificity for negative cases and sensitivity for micrometastases (micromet) and macrometastases (macromet). B, Operating point of individual pathologists with and without assistance for micrometastases and negative cases, overlayed on the receiver operating characteristic curve of the algorithm. AUC indicates area under the curve. Copyright © 2018 Wolters Kluwer Health, Inc. All rights reserved. www.ajsp.com | 5 • 민감도/특이도 • 인공지능을 사용한 경우 Micromet의 경우에 유의미하게 상승 • Negative와 Macromet 은 개선이 유의미하지 않음 Am J Sure Pathol 2018
- 32. • 판독 시간 (per image) • 인공지능의 보조를 받으면, Negative와 Micromet 은 유의미하게 감소 • 특히, Micromet은 약 2분에서 1분으로 절반 가량 감소 • ITC(Isolated Tumor Cell)와 Negative는 유의미하지 않음 Downloadedfromhttps://journals.lww.com/ajspbyBhDMf5ePHKav1zEoum1tQfN4a+kJLhEZgbsIHo4XMi0hCywCX1AWnYQp/IlQrHD3MyLIZIvnCFZVJ56DGsD590P5lh5KqE20T/dBX3x9CoM=on10/14/2018 Impact of Deep Learning Assistance on the Histopathologic Review of Lymph Nodes for Metastatic Breast Cancer David F. Steiner, MD, PhD,* Robert MacDonald, PhD,* Yun Liu, PhD,* Peter Truszkowski, MD,* Jason D. Hipp, MD, PhD, FCAP,* Christopher Gammage, MS,* Florence Thng, MS,† Lily Peng, MD, PhD,* and Martin C. Stumpe, PhD* Abstract: Advances in the quality of whole-slide images have set the stage for the clinical use of digital images in anatomic pathology. Along with advances in computer image analysis, this raises the possibility for computer-assisted diagnostics in pathology to improve histopathologic interpretation and clinical care. To evaluate the potential impact of digital assistance on interpretation of digitized slides, we conducted a multireader multicase study utilizing our deep learning algorithm for the detection of breast cancer metastasis in lymph nodes. Six pathologists reviewed 70 digitized slides from lymph node sections in 2 reader modes, unassisted and assisted, with a wash- out period between sessions. In the assisted mode, the deep learning algorithm was used to identify and outline regions with high like- lihood of containing tumor. Algorithm-assisted pathologists demon- strated higher accuracy than either the algorithm or the pathologist alone. In particular, algorithm assistance significantly increased the sensitivity of detection for micrometastases (91% vs. 83%, P=0.02). In addition, average review time per image was significantly shorter with assistance than without assistance for both micrometastases (61 vs. 116 s, P=0.002) and negative images (111 vs. 137 s, P=0.018). Lastly, pathologists were asked to provide a numeric score regarding the difficulty of each image classification. On the basis of this score, pathologists considered the image review of micrometastases to be significantly easier when interpreted with assistance (P=0.0005). Utilizing a proof of concept assistant tool, this study demonstrates the potential of a deep learning algorithm to improve pathologist accu- racy and efficiency in a digital pathology workflow. Key Words: artificial intelligence, machine learning, digital pathology, breast cancer, computer aided detection (Am J Surg Pathol 2018;00:000–000) The regulatory approval and gradual implementation of whole-slide scanners has enabled the digitization of glass slides for remote consults and archival purposes.1 Digitiza- tion alone, however, does not necessarily improve the con- sistency or efficiency of a pathologist’s primary workflow. In fact, image review on a digital medium can be slightly slower than on glass, especially for pathologists with limited digital pathology experience.2 However, digital pathology and image analysis tools have already demonstrated po- tential benefits, including the potential to reduce inter-reader variability in the evaluation of breast cancer HER2 status.3,4 Digitization also opens the door for assistive tools based on Artificial Intelligence (AI) to improve efficiency and con- sistency, decrease fatigue, and increase accuracy.5 Among AI technologies, deep learning has demon- strated strong performance in many automated image-rec- ognition applications.6–8 Recently, several deep learning– based algorithms have been developed for the detection of breast cancer metastases in lymph nodes as well as for other applications in pathology.9,10 Initial findings suggest that some algorithms can even exceed a pathologist’s sensitivity for detecting individual cancer foci in digital images. How- ever, this sensitivity gain comes at the cost of increased false positives, potentially limiting the utility of such algorithms for automated clinical use.11 In addition, deep learning algo- rithms are inherently limited to the task for which they have been specifically trained. While we have begun to understand the strengths of these algorithms (such as exhaustive search) and their weaknesses (sensitivity to poor optical focus, tumor mimics; manuscript under review), the potential clinical util- ity of such algorithms has not been thoroughly examined. While an accurate algorithm alone will not necessarily aid pathologists or improve clinical interpretation, these benefits may be achieved through thoughtful and appropriate in- tegration of algorithm predictions into the clinical workflow.8 From the *Google AI Healthcare; and †Verily Life Sciences, Mountain View, CA. D.F.S., R.M., and Y.L. are co-first authors (equal contribution). Work done as part of the Google Brain Healthcare Technology Fellowship (D.F.S. and P.T.). Conflicts of Interest and Source of Funding: D.F.S., R.M., Y.L., P.T., J.D.H., C.G., F.T., L.P., M.C.S. are employees of Alphabet and have Alphabet stock. Correspondence: David F. Steiner, MD, PhD, Google AI Healthcare, 1600 Amphitheatre Way, Mountain View, CA 94043 (e-mail: davesteiner@google.com). Supplemental Digital Content is available for this article. Direct URL citations appear in the printed text and are provided in the HTML and PDF versions of this article on the journal’s website, www.ajsp.com. Copyright © 2018 The Author(s). Published by Wolters Kluwer Health, Inc. This is an open-access article distributed under the terms of the Creative Commons Attribution-Non Commercial-No Derivatives License 4.0 (CCBY-NC-ND), where it is permissible to download and share the work provided it is properly cited. The work cannot be changed in any way or used commercially without permission from the journal. ORIGINAL ARTICLE Am J Surg Pathol Volume 00, Number 00, ’’ 2018 www.ajsp.com | 1 nificant differences for the other categories (Table 3). DISCUSSION Recent studies have described the ability of deep learning algorithms to perform on par with expert pathologists for isolated diagnostic tasks.10 Underlying these exciting advances, however, is the important notion that these algorithms do not replace the breadth and contextual knowledge of human pathologists and that even the best algorithms would need to digitized HE slides, and show that a digital tool developed to assist with the identification of lymph node metastases can indeed augment the efficiency and accuracy of pathologists. In regards to accuracy, algorithm assistance im- proved the sensitivity of detection of micrometastases from 83% to 91% and resulted in higher overall diagnostic accuracy than that of either unassisted pathologist inter- pretation or the computer algorithm alone. Although deep learning algorithms have been credited with comparable Unassisted Assisted TimeofReview(seconds) Timeofreviewperimage(seconds) Negative ITC Micromet Macromet A B p=0.002 p=0.02 Unassisted Assisted Micrometastases FIGURE 5. Average review time per image decreases with assistance. A, Average review time per image across all pathologists analyzed by category. Black circles are average times with assistance, gray triangles represent average times without assistance. Error bars indicate 95% confidence interval. B, Micrometastasis time of review decreases for nearly all images with assistance. Circles represent average review time for each individual micrometastasis image, averaged across the 6 pathologists by assistance modality. The dashed lines connect the points corresponding to the same image with and without assistance. The 2 images that were not reviewed faster on average with assistance are represented with red dot-dash lines. Vertical lines of the box represent quartiles, and the diamond indicates the average of review time for micrometastases in that modality. Micromet indicates mi- crometastasis; macromet, macrometastasis. Am J Sure Pathol 2018