SlideShare une entreprise Scribd logo
1  sur  60
Wind Power integration 
PSTI 
28.08.14
Synopsis 
•Statistics 
• Fundamentals 
• Classification 
• Integration techniques with grid 
• Major Phases in the Wind project 
• Scheduling and forecasting
World Wide Wind Generation 
Year 
Capacity 
(MW) 
Growth 
(MW) 
Growth 
(%) 
1995 4,800 - - 
1996 6,100 1,300 27.1 
1997 7,482 1,382 22.7 
1998 9,670 2,188 29.3 
1999 13,699 4,029 64.3 
2000 18,040 4,341 31.7 
2001 24,318 6,279 34.9 
2002 31,184 6,866 28.3 
2003 39,333 8,149 26.2 
2004 47,661 8,329 21.2 
2005 59,062 11,401 24 
2006 74,174 15,112 25.6 
2007 93,958 19,784 26.7 
2008 121,246 27,289 29.1 
2009 157,909 36,664 30.3 
2010 194,558 36,649 23.3 
2011 237,022 42,465 21.9 
2012 282,683 45,661 19.3 
2013 318,510 35,828 12.7
Top 10 countries 
by nameplate wind power capacity 
(2013 year-end) 
Country 
New 2013 
Wind power total 
capacity % world 
total 
capacity (MW) (MW) 
World total 35,289 MW 318,105 MW 100% 
China 16,088 91,412 28.7 
United States 1,084 61,091 19.2 
Germany 3,238 34,250 10.8 
Spain 175 22,959 7.2 
India 1,729 20,150 6.3 
UK 1,883 10,531 3.3 
Italy 444 8,552 2.7 
France 631 8,254 2.6 
Canada 1,599 7,803 2.5 
Denmark 657 4,772 1.5
STATE WISE WIND INSTALLATIONS IN INDIA as on 31.04.14 
State Mar-14 Mar-13 Mar-12 Mar-11 Mar-10 Mar-09 
Tamil Nadu 7275.68 7,162.18 6,987.60 5904.4 4907 4304.5 
Maharashtra 4064.95 3,021.85 2,733.30 2310.8 2078 1938.9 
Gujarat 3447.28 3,174.58 2,966.30 2175.5 1864 1566.5 
Rajasthan 2783.45 2,684.65 2,070.70 1524.8 1088 738.4 
Karnataka 2323.85 2,135.15 1,933.50 1730 1473 1327.4 
Andhra Pradesh 783.35 447.65 245.5 200.2 236 122.5 
Madhya Pradesh 423.4 386 376.4 275.5 229 212.8 
Kerala 35.1 35.1 35.1 32.8 28 27 
Others 4.3 4.3 3.2 0 4 1.1 
Total 21141.4 19,051.46 17365 14158 11807 10242.3
Total generation capacity is : 233,929.94 MW as on 31.12.13
Sources of renewable energy in India 
as of December 2013, MNRE India
Renewal Energy Installed Capacity in India (as of 31 January 2014) 
Installed capacity 
(in MW) 
Wind 20,298.83 
Small Hydel Power Projects 3,774.15 
Bagasse Cogeneration 2,512.88 
Solar 2,208.36 
Biomass Power & Gasification 1,285.60 
Waste to Power 99.08 
30,177.90 
Type Technology 
Grid Connected Power 
Total - Grid Connected Power 
Wind Portfolio is 8.68 % in the total generation capacity of country
Synopsis
Why Seasons
General circulation 
The regions around equator, at 0° latitude 
are heated more by the sun than the rest of 
the globe. These hot areas are indicated in 
the warm colours, red, orange and yellow 
in this infrared picture of sea surface 
temperatures (taken from a NASA satellite, 
NOAA-7 in July 1984). 
Hot air is lighter than cold air and will rise 
into the sky until it reaches approximately 
10 km (6 miles) altitude and will spread to 
the North and the South. If the globe did 
not rotate, the air would simply arrive at 
the North Pole and the South Pole, sink 
down, and return to the equator. 
The power emission from the 
sun is 1.37 kW/m 2 on the 
surface of the sphere, which 
has the sun as its centre and 
the average radius of the earth 
trajectory. The power hits a 
circular disc with an area of 
of 1.27 x 10 14 m 2 . The 
power emitted to the earth is 
thus 1.74 x 10 17W.
Secondary Circulation 
The wind rises from the equator and moves north and south in the higher layers 
of the atmosphere. 
Around 30°; latitude in both hemispheres the Coriolis force prevents the air from 
moving much farther. At this latitude there is a high pressure area, as the air 
begins sinking down again. 
As the wind rises from the equator there will be a low pressure area close to 
ground level attracting winds from the North and South. 
At the Poles, there will be high pressure due to the 
cooling of the air. 
Keeping in mind the bending force of the Coriolis 
force, we thus have the following general results for 
the prevailing wind direction: 
Latitude: 90-60°N 60-30°N 30-0°N 0-30°S 30-60°S 60-90°S 
Direction: NE SW NE SE NW SE
Tertiary Circulations 
Land masses are heated by the sun more quickly than the sea in 
the daytime. The air rises, flows out to the sea, and creates a low 
pressure at ground level which attracts the cool air from the sea. 
This is called a sea breeze. At nightfall there is often a period of 
calm when land and sea temperatures are equal. 
At night the wind blows in the opposite direction. The land 
breeze at night generally has lower wind speeds, because the 
temperature difference between land and sea is smaller at night. 
The monsoon known from South-East Asia is in reality a large-scale 
form of the sea breeze and land breeze, varying in its 
direction between seasons, because land masses are heated or 
cooled more quickly than the sea. 
Sea Breezes
Mountain winds 
Mountain regions display many interesting weather patterns. One example is the valley 
wind which originates on south-facing slopes (north-facing in the southern hemisphere). 
When the slopes and the neighboring air are heated the density of the air decreases, and 
the air ascends towards the top following the surface of the slope. At night the wind 
direction is reversed, and turns into a down slope wind. 
If the valley floor is sloped, the air may move down or up the valley, as a canyon wind. 
Winds flowing down the leeward sides of mountains can be quite powerful:
Site / WTG Classification 
Wind Class/Turbulence 
Annual average wind speed at 
hub-height(m/s) 
Extreme 50-year gust in 
meters/second (miles/hour) 
I A High wind - Higher Turbulence 18% 10.0 70 (156) 
I B High wind - Lower Turbulence 16% 10.0 70 (156) 
II A Medium wind - Higher Turbulence 18% 8.5 59.5 (133) 
II B Medium wind - Lower Turbulence 16% 8.5 59.5 (133) 
III A Low wind - Higher Turbulence 18% 7.5 52.5 (117) 
III B Low wind - Lower Turbulence 16% 7.5 52.5 (117) 
IV 6.0 42.0 (94)
Wind Power Conversion technologies 
• There is a kinetic energy in the moving air. That is Wind 
• P = ½ rAV3Cp 
Where P = the power of the wind measured in W (Watt). 
r = (rho) = the density of dry air = 1.225 measured in kg/m 3 (kilograms per cubic meter, at average atmospheric 
pressure at sea level at 15° C). 
v = the velocity of the wind measured in m/s (meters per second). 
A= Area of the turbine in Square meters 
Cp = Conversion Factor (or) Efficiency of the turbine 
• The mechanical device which converts this kinetic energy to Mechanical 
rotational energy is called Turbine
BETZ Limit 
The lower the value of V2, the more energy extracted by the wind 
turbine, the more is the efficiency. 
So if V2 =0 , do we produce maximum power? 
Max Theoretical Efficiency= 59% when V2/V1=1/3
Nacelle 
Tower 
Hub 
Blade
Operation of WTG
Synopsis
Classification of turbines By Mechanical features 
Turbine 
direction 
Vertical Horizontal 
Wind 
direction 
UP 
Wind 
DOWN 
Wind 
Number of 
blades 
TWO 
Blade 
THREE 
Blade
Vertical Axis Wind Turbines Downwind Machines 
Two-Bladed
Classification of turbines By Mechanical features 
Turbine 
regulation 
PITCH STALL 
BREAKING 
Aerodynamic Mechanical 
Tower 
Tubular Lattice
Regulation 
PITCH Regulation STALL Regulation
Generators 
Wind 
Generators 
Synchronous 
WRSG PMSG 
Asynchronous 
WRIG 
DFIG Flexi Slip 
SCIG 
Single Speed Dual Speed
Synopsis
Generators - Asynchronous 
Advantages: 
1) These generators are nothing but the induction Motors 
2) Very simple mechanism 
3) There is no need of huge synchronizing and excitation 
circuits 
Disadvantages: 
1) Draws inductive reactance from 
grid causing low power factor 
2) Requires power factor 
correction circuit and Capacitors 
3) Huge wear and tear
Induction generator
Flexi Slip System WRIG
Induction Generator - DFIG
Generators - Synchronous 
Advantages: 
1) These generators can generate their own VAR 
2) By changing excitation we can generate the power at leading 
or lagging. No need of power factor correction capacitors 
3) Wind mills with synchronous generators will have lesser cut-in 
wind speed (they can generate power at low wind speed 
also) 
4) There is no need of huge gear boxes 
5) In certain cases the Wind mills can be operated as stand 
alone system of generation 
Disadvantages: 
1) These generators requires huge power electronic 
support 
2) Requires very sophisticated controls
The gear concept and gearless concept in a component 
comparison 
Main Shaft 
Hub 
Rotor Shaft 
Bearings 
Clutch 
Gear Brake 
Generator 
Generator Rotor 
Generator Stator 
Hub 
Main Bearing 
Axle pin 
Conventional Gearless
Typical Synchronous Wind Energy Converter Block Diagram
Power Block Diagram
Synopsis
Major Phases of the project
Wind Resourcing and Assessing 
• wind mast with 2 sets of Anemometers & wind vanes at 
different heights will be erected at the prospective site. 
• Height of wind mast will be depending up of the class of the 
site 
• Wind Speed, Wind direction, Temperature and Pressure are 
measured 
• Measurement Period: 
– In general : Minimum of 1 year! 
– 3 to 5 years is ideal for better estimation of wind 
climate prevailing at the site 
Analysis of measured wind data will be the key to 
• Select wind turbine type based on wind 
resource 
• Design wind farm layout based on site 
conditions 
• Calculate energy output
Key – outputs of WRA 
REV07, 05-03-2014 
Probability of 
Exceedence 
PLF(%) 
P50 30.00 
P75 26.78 
P90 23.87 
Vagarai Monthly % Distribution 
Apr 2.7% 
May 7.8% 
Jun 18.4% 
Jul 20.5% 
Aug 18.1% 
Sep 14.9% 
Oct 2.4% 
Nov 1.9% 
Dec 2.1% 
Jan 3.6% 
Feb 4.6% 
Mar 3.1% 
Total 100.00% 
Wind 
rose
WRA –micrositing
Access Roads and Power Evacuation
Construction Activities 
BAR BENDING AND CENTERING 
WORK.
CONCRETE FILLING IN TO THE FOUNDATION.
FINAL LOOK OF THE FOUNDATION.
Receipt of tower 
sections 
Unloading the 
tower sections
Receiving the machine 
and unloading
Blades receipt 
and unloading
Nacelle 
Tower 
Hub 
Blade
Synopsis
The epicenter of this report is to deal with the issues and challenges facing by all the stakeholders under this mechanism and aimed to provide a thought process for resolving 
the difficulties aroused because of this mechanism in the sector. 
in MW in % 
Total Installed 
Capacity 
233930 100 
Renewable 
capacity Installed 
29989 12.82 
Wind 20149 8.61 
Solar 2180 0.93 
India is a rapidly growing economy which needs energy to meet its growth objectives in a 
sustainable manner. The power generation from non-conventional sources like Wind and Solar 
is an integral part of the energy system. The generation from wind and solar is depends upon 
the nature with a benefit of being a clean energy source and a challenge of being an infirm 
source of generation and to predict the generation for optimal management of electricity grid 
increases manifold. 
Indian Electricity Grid Code (IEGC) Regulation 2010 which was announced on 28th Apr 2010 
identified this challenge. Origin of Forecasting & Scheduling of Wind and Solar power has 
come through IEGC 2010 and introduced in the form of commercial implication mechanism 
known as Renewable Regulatory Fund (RRF) which becomes the prime focus for the 
Regulators. 
Objective of IEGC to brings together: 
- A single set of technical and commercial rules, 
- Facilitation of the optimal operation of the grid, 
- Facilitation for functioning of power markets, 
- Facilitation of the development of renewable energy sources by specifying the technical and commercial aspects for 
integration of these resources into the grid. 
Instead of following the objectives first, the main focus moved towards the procedural implementation of RRF mechanism without understanding the facts of 
technical and operational know-hows. The installation falls under RRF for forecasting and scheduling as per CERC order dated 16.01.2013 is not even 1% of 
total installed capacity in the country. 
“Does ensuing the 1% of wind/solar generation out of total installed capacity is the real motive?” 
Answer is no… 
Backdrop of RRF Mechanism
IEGC 2010 
IWEA AND CERC PETITION - TASK 
NLDC - DETAILED RRF PROCEDURE 
SLDCS TO SUBMIT MOCK 
EXERCISE DATA 
FORCE FORMED 
TASK FORCE SUBMITTED REPORT 
TO CERC 
COORDINATING AGENCY/ 
REFERENCE RATE INTRODUCED BY 
CERC 
CERC ACCORDED DETAILED RRF 
PROCEDURE 
NLDC - DRAFT DETAILED RRF 
PROCEDURE 
…. FILED APPEAL IN CHENNAI 
RRF STARTED 
HIGH COURT - MATTER 
RRF COMMERCIAL MECHNAISM 
SUSPENDED TILL FURTHER ORDERS 
….FILED APPEAL IN DELHI HIGH 
COURT 
28th Apr 
2010 
18th Feb 
2011 
30th Nov 
2011 
27th Mar 
2012 
04th Sep 
2012 
16th Jan 
2013 
12th Jun 
2013 
09th Jul 
2013 
15th Jul 
2013 
07th Jan 
2014 
DATE MILESTONE 
28th Apr 2010 IEGC 2010 
18th Feb 2011 NLDC - Detailed RRF Procedure 
30th Nov 2011 SLDCs to submit mock exercise data 
27th Mar 2012 IWEA and CERC Petition - Task force formed 
04th Sep 2012 Task force submitted report to CERC 
16th Jan 2013 Coordinating Agency/ Reference Rate introduced by CERC 
DATE MILESTONE 
12th Jun 2013 NLDC - Draft Detailed RRF Procedure 
09th Jul 2013 CERC accorded Detailed RRF Procedure 
15th Jul 2013 RRF started 
… . Filed appeal in Chennai High Court - Matter 
… .Filed appeal in Delhi high Court 
07th Jan 2014 RRF Commercial Mechnaism suspended till further orders 
RRF Timeline
Commercial Settlement Overview 
Dev % 
range 
0 - 30 30 - 50 > 50 -30 - 0 < -30 
0 – 30 yes - - - - 
30 – 50 yes yes - - - 
> 50 yes yes yes - - 
-30 – 0 - - - yes - 
< -30 - - - yes yes 
Dev % 
range 
0 - 30 30 -50 > 50 -30 - 0 < -30 
0 – 30 A - - - - 
30 – 50 A B - - - 
> 50 A B C - - 
-30 – 0 - - - A - 
< -30 - - - A B 
Commercial 
Settlement 
• A. PPA rate – settled by Utility 
• B. PPA rate – settled by Utility + UI charges w.r.t. frequency settled through RRF 
• C. UI @ 50 Hz – settled through RRF
Wind Power Scheduling Challenges 
Wind Power Forecasting 
Communicate forecasted and 
actual data with SLDC 
Adaptation of “Availability based tariff” 
Liability of inaccurate forecasts 
• Wind power forecast technology is 
not advanced. 
• Forecast does not meet the 
required accuracy limits. 
• Security issues in data 
communication 
• Installation of ABT meters at 
pooling stations 
• Most plants in rural areas 
• Will make the existing projects 
signed under PT and APPC + REC 
unviable. 
• Will adversely effect the growth of 
wind industry in India. 
• No forecasting agency or 
coordinating agency promises 
accurate forecast.
Thank you

Contenu connexe

Tendances

Tendances (20)

Hybrid power generation system
Hybrid power generation systemHybrid power generation system
Hybrid power generation system
 
solar wind hybrid system(renewable sources)
solar wind hybrid system(renewable sources)solar wind hybrid system(renewable sources)
solar wind hybrid system(renewable sources)
 
Wind power plant
Wind power plantWind power plant
Wind power plant
 
Wind Power in India
Wind Power in IndiaWind Power in India
Wind Power in India
 
Wind energy
Wind energyWind energy
Wind energy
 
Siting and Planning Design of Wind Turbines
Siting and Planning Design of Wind TurbinesSiting and Planning Design of Wind Turbines
Siting and Planning Design of Wind Turbines
 
Wind energy
Wind energyWind energy
Wind energy
 
Wind energy
Wind energyWind energy
Wind energy
 
Wind energy
Wind energyWind energy
Wind energy
 
Doubly fed-induction-generator
Doubly fed-induction-generatorDoubly fed-induction-generator
Doubly fed-induction-generator
 
Wind farm grid issues
Wind farm grid issuesWind farm grid issues
Wind farm grid issues
 
Wind Power Generation Schemes
Wind Power Generation SchemesWind Power Generation Schemes
Wind Power Generation Schemes
 
Solar pv connected to grid
Solar pv connected to gridSolar pv connected to grid
Solar pv connected to grid
 
WIND POWER GENERATION
WIND POWER GENERATIONWIND POWER GENERATION
WIND POWER GENERATION
 
Solar power satellite
Solar power satelliteSolar power satellite
Solar power satellite
 
Power electronics in Wind Turbine Systems
Power electronics in Wind Turbine SystemsPower electronics in Wind Turbine Systems
Power electronics in Wind Turbine Systems
 
Power electronic converter in wind turbine
Power electronic converter in wind turbinePower electronic converter in wind turbine
Power electronic converter in wind turbine
 
Wind power
Wind powerWind power
Wind power
 
PV Wind Hybrid Systems
PV Wind Hybrid SystemsPV Wind Hybrid Systems
PV Wind Hybrid Systems
 
Wind energy
Wind energyWind energy
Wind energy
 

En vedette

Mtech power system(2016 17)
Mtech power system(2016 17)Mtech power system(2016 17)
Mtech power system(2016 17)MSR PROJECTS
 
Classification of Hydraulic Turbines
Classification of Hydraulic TurbinesClassification of Hydraulic Turbines
Classification of Hydraulic TurbinesIshant Gautam.
 
integration of solar and wind power generation system
integration of solar and wind power generation systemintegration of solar and wind power generation system
integration of solar and wind power generation systempranavi kasina
 
Lclr filter design and modelling for harmonic mitigation in interconnected mi...
Lclr filter design and modelling for harmonic mitigation in interconnected mi...Lclr filter design and modelling for harmonic mitigation in interconnected mi...
Lclr filter design and modelling for harmonic mitigation in interconnected mi...eSAT Journals
 
Dc microgrid for wind and solar power integration
Dc microgrid for wind and solar power integrationDc microgrid for wind and solar power integration
Dc microgrid for wind and solar power integrationProjectsatbangalore
 
Solar and wind power forecasting
Solar and wind power forecastingSolar and wind power forecasting
Solar and wind power forecastingRCREEE
 
Solar wind power integration with grid-issues and mitigation strategy
Solar wind power integration with grid-issues and mitigation strategy Solar wind power integration with grid-issues and mitigation strategy
Solar wind power integration with grid-issues and mitigation strategy Ashish Verma
 
Solar power integration with grid
Solar power integration with gridSolar power integration with grid
Solar power integration with gridashishant
 
Smart grid iit-jodhpur-apr10
Smart grid iit-jodhpur-apr10Smart grid iit-jodhpur-apr10
Smart grid iit-jodhpur-apr10tec2
 
The Biology of Love 3rd Version
The Biology of Love 3rd VersionThe Biology of Love 3rd Version
The Biology of Love 3rd VersionStacy Baker
 
Learn To Love
Learn To LoveLearn To Love
Learn To LoveBaiju NT
 
Microgrid Presentation
Microgrid PresentationMicrogrid Presentation
Microgrid PresentationShahab Khan
 
MicroGrid and Energy Storage System COMPLETE DETAILS NEW PPT
MicroGrid and Energy Storage System COMPLETE DETAILS NEW PPTMicroGrid and Energy Storage System COMPLETE DETAILS NEW PPT
MicroGrid and Energy Storage System COMPLETE DETAILS NEW PPT Abin Baby
 
Hybrid solar wind power generation system
Hybrid solar wind power generation systemHybrid solar wind power generation system
Hybrid solar wind power generation systemSaurabh Pandey
 
abb micro-grids and-renewable_energy_integration
abb micro-grids and-renewable_energy_integrationabb micro-grids and-renewable_energy_integration
abb micro-grids and-renewable_energy_integrationSteve Wittrig
 
Wind turbines Power Point Presentation
Wind turbines Power Point PresentationWind turbines Power Point Presentation
Wind turbines Power Point PresentationMd. Rimon Mia
 
Love, courtship, and marriage
Love, courtship, and marriageLove, courtship, and marriage
Love, courtship, and marriagedupax
 
Types of turbine & thier application
Types of turbine & thier applicationTypes of turbine & thier application
Types of turbine & thier applicationdaudsangeenkhan
 

En vedette (20)

Mtech power system(2016 17)
Mtech power system(2016 17)Mtech power system(2016 17)
Mtech power system(2016 17)
 
Classification of Hydraulic Turbines
Classification of Hydraulic TurbinesClassification of Hydraulic Turbines
Classification of Hydraulic Turbines
 
integration of solar and wind power generation system
integration of solar and wind power generation systemintegration of solar and wind power generation system
integration of solar and wind power generation system
 
Lclr filter design and modelling for harmonic mitigation in interconnected mi...
Lclr filter design and modelling for harmonic mitigation in interconnected mi...Lclr filter design and modelling for harmonic mitigation in interconnected mi...
Lclr filter design and modelling for harmonic mitigation in interconnected mi...
 
Dc microgrid for wind and solar power integration
Dc microgrid for wind and solar power integrationDc microgrid for wind and solar power integration
Dc microgrid for wind and solar power integration
 
Solar and wind power forecasting
Solar and wind power forecastingSolar and wind power forecasting
Solar and wind power forecasting
 
Solar wind power integration with grid-issues and mitigation strategy
Solar wind power integration with grid-issues and mitigation strategy Solar wind power integration with grid-issues and mitigation strategy
Solar wind power integration with grid-issues and mitigation strategy
 
Solar power integration with grid
Solar power integration with gridSolar power integration with grid
Solar power integration with grid
 
Smart grid iit-jodhpur-apr10
Smart grid iit-jodhpur-apr10Smart grid iit-jodhpur-apr10
Smart grid iit-jodhpur-apr10
 
The Biology of Love 3rd Version
The Biology of Love 3rd VersionThe Biology of Love 3rd Version
The Biology of Love 3rd Version
 
Learn To Love
Learn To LoveLearn To Love
Learn To Love
 
Steam turbine Working
Steam turbine WorkingSteam turbine Working
Steam turbine Working
 
Microgrid Presentation
Microgrid PresentationMicrogrid Presentation
Microgrid Presentation
 
MicroGrid and Energy Storage System COMPLETE DETAILS NEW PPT
MicroGrid and Energy Storage System COMPLETE DETAILS NEW PPTMicroGrid and Energy Storage System COMPLETE DETAILS NEW PPT
MicroGrid and Energy Storage System COMPLETE DETAILS NEW PPT
 
Wind Power
Wind PowerWind Power
Wind Power
 
Hybrid solar wind power generation system
Hybrid solar wind power generation systemHybrid solar wind power generation system
Hybrid solar wind power generation system
 
abb micro-grids and-renewable_energy_integration
abb micro-grids and-renewable_energy_integrationabb micro-grids and-renewable_energy_integration
abb micro-grids and-renewable_energy_integration
 
Wind turbines Power Point Presentation
Wind turbines Power Point PresentationWind turbines Power Point Presentation
Wind turbines Power Point Presentation
 
Love, courtship, and marriage
Love, courtship, and marriageLove, courtship, and marriage
Love, courtship, and marriage
 
Types of turbine & thier application
Types of turbine & thier applicationTypes of turbine & thier application
Types of turbine & thier application
 

Similaire à Grid integration of the Wind Turbine Generator

WIND ENERGY REPORT AE 215- 2018 SOURCES OF FARM POWER
WIND ENERGY REPORT AE 215- 2018 SOURCES OF FARM POWERWIND ENERGY REPORT AE 215- 2018 SOURCES OF FARM POWER
WIND ENERGY REPORT AE 215- 2018 SOURCES OF FARM POWERmusadoto
 
Wind power plant
Wind power plantWind power plant
Wind power plantshrey1993
 
EPG - Unit 04 - Wind Power Plant
EPG - Unit 04 - Wind Power PlantEPG - Unit 04 - Wind Power Plant
EPG - Unit 04 - Wind Power PlantPremanandDesai
 
Wind Energy Technology & Application of Remote Sensing
Wind Energy Technology & Application of Remote SensingWind Energy Technology & Application of Remote Sensing
Wind Energy Technology & Application of Remote SensingSiraj Ahmed
 
Study About Wind turbines
Study About Wind turbinesStudy About Wind turbines
Study About Wind turbinesElia Tohmé
 
Powerpoint Presentation On WIND ENERGY
Powerpoint Presentation On WIND ENERGYPowerpoint Presentation On WIND ENERGY
Powerpoint Presentation On WIND ENERGYArunima Sethi
 
WIND TURBINE turbine development Wind turbines are classified into two genera...
WIND TURBINE turbine development Wind turbines are classified into two genera...WIND TURBINE turbine development Wind turbines are classified into two genera...
WIND TURBINE turbine development Wind turbines are classified into two genera...Mohan313217
 
Wind characteristics, wind speed and energy
Wind characteristics, wind speed and energyWind characteristics, wind speed and energy
Wind characteristics, wind speed and energysanthosh kumar
 
Overview of Wind Energy
Overview of Wind EnergyOverview of Wind Energy
Overview of Wind EnergyJerilene
 
IRJET - Measurement and Analysis of the Voltage Current Characteristic of a M...
IRJET - Measurement and Analysis of the Voltage Current Characteristic of a M...IRJET - Measurement and Analysis of the Voltage Current Characteristic of a M...
IRJET - Measurement and Analysis of the Voltage Current Characteristic of a M...IRJET Journal
 
LECTURE No 6 wind.pptx
LECTURE No 6 wind.pptxLECTURE No 6 wind.pptx
LECTURE No 6 wind.pptxSaqibullah12
 
Design of PVC Bladed Horizontal Axis Wind Turbine for Low Wind Speed Region
Design of PVC Bladed Horizontal Axis Wind Turbine for Low Wind Speed RegionDesign of PVC Bladed Horizontal Axis Wind Turbine for Low Wind Speed Region
Design of PVC Bladed Horizontal Axis Wind Turbine for Low Wind Speed RegionIJERA Editor
 
WINDENERGY PPT.pptx
 WINDENERGY PPT.pptx WINDENERGY PPT.pptx
WINDENERGY PPT.pptxVENKATESHY8
 
wind turbine detailed presentation .ppt
wind turbine detailed presentation  .pptwind turbine detailed presentation  .ppt
wind turbine detailed presentation .pptpaktracks
 

Similaire à Grid integration of the Wind Turbine Generator (20)

WIND ENERGY REPORT AE 215- 2018 SOURCES OF FARM POWER
WIND ENERGY REPORT AE 215- 2018 SOURCES OF FARM POWERWIND ENERGY REPORT AE 215- 2018 SOURCES OF FARM POWER
WIND ENERGY REPORT AE 215- 2018 SOURCES OF FARM POWER
 
Wind energy
Wind energyWind energy
Wind energy
 
Wind power plant
Wind power plantWind power plant
Wind power plant
 
EPG - Unit 04 - Wind Power Plant
EPG - Unit 04 - Wind Power PlantEPG - Unit 04 - Wind Power Plant
EPG - Unit 04 - Wind Power Plant
 
Wind Energy Technology & Application of Remote Sensing
Wind Energy Technology & Application of Remote SensingWind Energy Technology & Application of Remote Sensing
Wind Energy Technology & Application of Remote Sensing
 
Study About Wind turbines
Study About Wind turbinesStudy About Wind turbines
Study About Wind turbines
 
CH 5 Wind Energy
CH 5 Wind EnergyCH 5 Wind Energy
CH 5 Wind Energy
 
Powerpoint Presentation On WIND ENERGY
Powerpoint Presentation On WIND ENERGYPowerpoint Presentation On WIND ENERGY
Powerpoint Presentation On WIND ENERGY
 
Final Presentation
Final PresentationFinal Presentation
Final Presentation
 
WIND TURBINE turbine development Wind turbines are classified into two genera...
WIND TURBINE turbine development Wind turbines are classified into two genera...WIND TURBINE turbine development Wind turbines are classified into two genera...
WIND TURBINE turbine development Wind turbines are classified into two genera...
 
Wind characteristics, wind speed and energy
Wind characteristics, wind speed and energyWind characteristics, wind speed and energy
Wind characteristics, wind speed and energy
 
Overview of Wind Energy
Overview of Wind EnergyOverview of Wind Energy
Overview of Wind Energy
 
IRJET - Measurement and Analysis of the Voltage Current Characteristic of a M...
IRJET - Measurement and Analysis of the Voltage Current Characteristic of a M...IRJET - Measurement and Analysis of the Voltage Current Characteristic of a M...
IRJET - Measurement and Analysis of the Voltage Current Characteristic of a M...
 
LECTURE No 6 wind.pptx
LECTURE No 6 wind.pptxLECTURE No 6 wind.pptx
LECTURE No 6 wind.pptx
 
Wind turbine
Wind turbineWind turbine
Wind turbine
 
Wind Power Feasible
Wind Power FeasibleWind Power Feasible
Wind Power Feasible
 
Power from wind in india
Power from wind in indiaPower from wind in india
Power from wind in india
 
Design of PVC Bladed Horizontal Axis Wind Turbine for Low Wind Speed Region
Design of PVC Bladed Horizontal Axis Wind Turbine for Low Wind Speed RegionDesign of PVC Bladed Horizontal Axis Wind Turbine for Low Wind Speed Region
Design of PVC Bladed Horizontal Axis Wind Turbine for Low Wind Speed Region
 
WINDENERGY PPT.pptx
 WINDENERGY PPT.pptx WINDENERGY PPT.pptx
WINDENERGY PPT.pptx
 
wind turbine detailed presentation .ppt
wind turbine detailed presentation  .pptwind turbine detailed presentation  .ppt
wind turbine detailed presentation .ppt
 

Dernier

Energy Awareness training ppt for manufacturing process.pptx
Energy Awareness training ppt for manufacturing process.pptxEnergy Awareness training ppt for manufacturing process.pptx
Energy Awareness training ppt for manufacturing process.pptxsiddharthjain2303
 
Correctly Loading Incremental Data at Scale
Correctly Loading Incremental Data at ScaleCorrectly Loading Incremental Data at Scale
Correctly Loading Incremental Data at ScaleAlluxio, Inc.
 
"Exploring the Essential Functions and Design Considerations of Spillways in ...
"Exploring the Essential Functions and Design Considerations of Spillways in ..."Exploring the Essential Functions and Design Considerations of Spillways in ...
"Exploring the Essential Functions and Design Considerations of Spillways in ...Erbil Polytechnic University
 
11. Properties of Liquid Fuels in Energy Engineering.pdf
11. Properties of Liquid Fuels in Energy Engineering.pdf11. Properties of Liquid Fuels in Energy Engineering.pdf
11. Properties of Liquid Fuels in Energy Engineering.pdfHafizMudaserAhmad
 
THE SENDAI FRAMEWORK FOR DISASTER RISK REDUCTION
THE SENDAI FRAMEWORK FOR DISASTER RISK REDUCTIONTHE SENDAI FRAMEWORK FOR DISASTER RISK REDUCTION
THE SENDAI FRAMEWORK FOR DISASTER RISK REDUCTIONjhunlian
 
Gurgaon ✡️9711147426✨Call In girls Gurgaon Sector 51 escort service
Gurgaon ✡️9711147426✨Call In girls Gurgaon Sector 51 escort serviceGurgaon ✡️9711147426✨Call In girls Gurgaon Sector 51 escort service
Gurgaon ✡️9711147426✨Call In girls Gurgaon Sector 51 escort servicejennyeacort
 
Industrial Safety Unit-IV workplace health and safety.ppt
Industrial Safety Unit-IV workplace health and safety.pptIndustrial Safety Unit-IV workplace health and safety.ppt
Industrial Safety Unit-IV workplace health and safety.pptNarmatha D
 
Main Memory Management in Operating System
Main Memory Management in Operating SystemMain Memory Management in Operating System
Main Memory Management in Operating SystemRashmi Bhat
 
System Simulation and Modelling with types and Event Scheduling
System Simulation and Modelling with types and Event SchedulingSystem Simulation and Modelling with types and Event Scheduling
System Simulation and Modelling with types and Event SchedulingBootNeck1
 
CCS355 Neural Networks & Deep Learning Unit 1 PDF notes with Question bank .pdf
CCS355 Neural Networks & Deep Learning Unit 1 PDF notes with Question bank .pdfCCS355 Neural Networks & Deep Learning Unit 1 PDF notes with Question bank .pdf
CCS355 Neural Networks & Deep Learning Unit 1 PDF notes with Question bank .pdfAsst.prof M.Gokilavani
 
multiple access in wireless communication
multiple access in wireless communicationmultiple access in wireless communication
multiple access in wireless communicationpanditadesh123
 
complete construction, environmental and economics information of biomass com...
complete construction, environmental and economics information of biomass com...complete construction, environmental and economics information of biomass com...
complete construction, environmental and economics information of biomass com...asadnawaz62
 
Earthing details of Electrical Substation
Earthing details of Electrical SubstationEarthing details of Electrical Substation
Earthing details of Electrical Substationstephanwindworld
 
Comparative study of High-rise Building Using ETABS,SAP200 and SAFE., SAFE an...
Comparative study of High-rise Building Using ETABS,SAP200 and SAFE., SAFE an...Comparative study of High-rise Building Using ETABS,SAP200 and SAFE., SAFE an...
Comparative study of High-rise Building Using ETABS,SAP200 and SAFE., SAFE an...Erbil Polytechnic University
 
Mine Environment II Lab_MI10448MI__________.pptx
Mine Environment II Lab_MI10448MI__________.pptxMine Environment II Lab_MI10448MI__________.pptx
Mine Environment II Lab_MI10448MI__________.pptxRomil Mishra
 
Ch10-Global Supply Chain - Cadena de Suministro.pdf
Ch10-Global Supply Chain - Cadena de Suministro.pdfCh10-Global Supply Chain - Cadena de Suministro.pdf
Ch10-Global Supply Chain - Cadena de Suministro.pdfChristianCDAM
 
TechTAC® CFD Report Summary: A Comparison of Two Types of Tubing Anchor Catchers
TechTAC® CFD Report Summary: A Comparison of Two Types of Tubing Anchor CatchersTechTAC® CFD Report Summary: A Comparison of Two Types of Tubing Anchor Catchers
TechTAC® CFD Report Summary: A Comparison of Two Types of Tubing Anchor Catcherssdickerson1
 

Dernier (20)

Energy Awareness training ppt for manufacturing process.pptx
Energy Awareness training ppt for manufacturing process.pptxEnergy Awareness training ppt for manufacturing process.pptx
Energy Awareness training ppt for manufacturing process.pptx
 
Correctly Loading Incremental Data at Scale
Correctly Loading Incremental Data at ScaleCorrectly Loading Incremental Data at Scale
Correctly Loading Incremental Data at Scale
 
"Exploring the Essential Functions and Design Considerations of Spillways in ...
"Exploring the Essential Functions and Design Considerations of Spillways in ..."Exploring the Essential Functions and Design Considerations of Spillways in ...
"Exploring the Essential Functions and Design Considerations of Spillways in ...
 
11. Properties of Liquid Fuels in Energy Engineering.pdf
11. Properties of Liquid Fuels in Energy Engineering.pdf11. Properties of Liquid Fuels in Energy Engineering.pdf
11. Properties of Liquid Fuels in Energy Engineering.pdf
 
THE SENDAI FRAMEWORK FOR DISASTER RISK REDUCTION
THE SENDAI FRAMEWORK FOR DISASTER RISK REDUCTIONTHE SENDAI FRAMEWORK FOR DISASTER RISK REDUCTION
THE SENDAI FRAMEWORK FOR DISASTER RISK REDUCTION
 
Gurgaon ✡️9711147426✨Call In girls Gurgaon Sector 51 escort service
Gurgaon ✡️9711147426✨Call In girls Gurgaon Sector 51 escort serviceGurgaon ✡️9711147426✨Call In girls Gurgaon Sector 51 escort service
Gurgaon ✡️9711147426✨Call In girls Gurgaon Sector 51 escort service
 
Industrial Safety Unit-IV workplace health and safety.ppt
Industrial Safety Unit-IV workplace health and safety.pptIndustrial Safety Unit-IV workplace health and safety.ppt
Industrial Safety Unit-IV workplace health and safety.ppt
 
Main Memory Management in Operating System
Main Memory Management in Operating SystemMain Memory Management in Operating System
Main Memory Management in Operating System
 
System Simulation and Modelling with types and Event Scheduling
System Simulation and Modelling with types and Event SchedulingSystem Simulation and Modelling with types and Event Scheduling
System Simulation and Modelling with types and Event Scheduling
 
Designing pile caps according to ACI 318-19.pptx
Designing pile caps according to ACI 318-19.pptxDesigning pile caps according to ACI 318-19.pptx
Designing pile caps according to ACI 318-19.pptx
 
CCS355 Neural Networks & Deep Learning Unit 1 PDF notes with Question bank .pdf
CCS355 Neural Networks & Deep Learning Unit 1 PDF notes with Question bank .pdfCCS355 Neural Networks & Deep Learning Unit 1 PDF notes with Question bank .pdf
CCS355 Neural Networks & Deep Learning Unit 1 PDF notes with Question bank .pdf
 
multiple access in wireless communication
multiple access in wireless communicationmultiple access in wireless communication
multiple access in wireless communication
 
POWER SYSTEMS-1 Complete notes examples
POWER SYSTEMS-1 Complete notes  examplesPOWER SYSTEMS-1 Complete notes  examples
POWER SYSTEMS-1 Complete notes examples
 
complete construction, environmental and economics information of biomass com...
complete construction, environmental and economics information of biomass com...complete construction, environmental and economics information of biomass com...
complete construction, environmental and economics information of biomass com...
 
Earthing details of Electrical Substation
Earthing details of Electrical SubstationEarthing details of Electrical Substation
Earthing details of Electrical Substation
 
Comparative study of High-rise Building Using ETABS,SAP200 and SAFE., SAFE an...
Comparative study of High-rise Building Using ETABS,SAP200 and SAFE., SAFE an...Comparative study of High-rise Building Using ETABS,SAP200 and SAFE., SAFE an...
Comparative study of High-rise Building Using ETABS,SAP200 and SAFE., SAFE an...
 
Mine Environment II Lab_MI10448MI__________.pptx
Mine Environment II Lab_MI10448MI__________.pptxMine Environment II Lab_MI10448MI__________.pptx
Mine Environment II Lab_MI10448MI__________.pptx
 
Ch10-Global Supply Chain - Cadena de Suministro.pdf
Ch10-Global Supply Chain - Cadena de Suministro.pdfCh10-Global Supply Chain - Cadena de Suministro.pdf
Ch10-Global Supply Chain - Cadena de Suministro.pdf
 
young call girls in Green Park🔝 9953056974 🔝 escort Service
young call girls in Green Park🔝 9953056974 🔝 escort Serviceyoung call girls in Green Park🔝 9953056974 🔝 escort Service
young call girls in Green Park🔝 9953056974 🔝 escort Service
 
TechTAC® CFD Report Summary: A Comparison of Two Types of Tubing Anchor Catchers
TechTAC® CFD Report Summary: A Comparison of Two Types of Tubing Anchor CatchersTechTAC® CFD Report Summary: A Comparison of Two Types of Tubing Anchor Catchers
TechTAC® CFD Report Summary: A Comparison of Two Types of Tubing Anchor Catchers
 

Grid integration of the Wind Turbine Generator

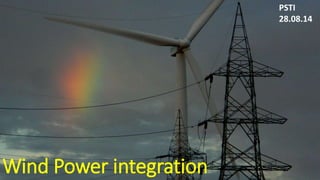
  • 1. Wind Power integration PSTI 28.08.14
  • 2. Synopsis •Statistics • Fundamentals • Classification • Integration techniques with grid • Major Phases in the Wind project • Scheduling and forecasting
  • 3. World Wide Wind Generation Year Capacity (MW) Growth (MW) Growth (%) 1995 4,800 - - 1996 6,100 1,300 27.1 1997 7,482 1,382 22.7 1998 9,670 2,188 29.3 1999 13,699 4,029 64.3 2000 18,040 4,341 31.7 2001 24,318 6,279 34.9 2002 31,184 6,866 28.3 2003 39,333 8,149 26.2 2004 47,661 8,329 21.2 2005 59,062 11,401 24 2006 74,174 15,112 25.6 2007 93,958 19,784 26.7 2008 121,246 27,289 29.1 2009 157,909 36,664 30.3 2010 194,558 36,649 23.3 2011 237,022 42,465 21.9 2012 282,683 45,661 19.3 2013 318,510 35,828 12.7
  • 4. Top 10 countries by nameplate wind power capacity (2013 year-end) Country New 2013 Wind power total capacity % world total capacity (MW) (MW) World total 35,289 MW 318,105 MW 100% China 16,088 91,412 28.7 United States 1,084 61,091 19.2 Germany 3,238 34,250 10.8 Spain 175 22,959 7.2 India 1,729 20,150 6.3 UK 1,883 10,531 3.3 Italy 444 8,552 2.7 France 631 8,254 2.6 Canada 1,599 7,803 2.5 Denmark 657 4,772 1.5
  • 5.
  • 6. STATE WISE WIND INSTALLATIONS IN INDIA as on 31.04.14 State Mar-14 Mar-13 Mar-12 Mar-11 Mar-10 Mar-09 Tamil Nadu 7275.68 7,162.18 6,987.60 5904.4 4907 4304.5 Maharashtra 4064.95 3,021.85 2,733.30 2310.8 2078 1938.9 Gujarat 3447.28 3,174.58 2,966.30 2175.5 1864 1566.5 Rajasthan 2783.45 2,684.65 2,070.70 1524.8 1088 738.4 Karnataka 2323.85 2,135.15 1,933.50 1730 1473 1327.4 Andhra Pradesh 783.35 447.65 245.5 200.2 236 122.5 Madhya Pradesh 423.4 386 376.4 275.5 229 212.8 Kerala 35.1 35.1 35.1 32.8 28 27 Others 4.3 4.3 3.2 0 4 1.1 Total 21141.4 19,051.46 17365 14158 11807 10242.3
  • 7. Total generation capacity is : 233,929.94 MW as on 31.12.13
  • 8. Sources of renewable energy in India as of December 2013, MNRE India
  • 9. Renewal Energy Installed Capacity in India (as of 31 January 2014) Installed capacity (in MW) Wind 20,298.83 Small Hydel Power Projects 3,774.15 Bagasse Cogeneration 2,512.88 Solar 2,208.36 Biomass Power & Gasification 1,285.60 Waste to Power 99.08 30,177.90 Type Technology Grid Connected Power Total - Grid Connected Power Wind Portfolio is 8.68 % in the total generation capacity of country
  • 12. General circulation The regions around equator, at 0° latitude are heated more by the sun than the rest of the globe. These hot areas are indicated in the warm colours, red, orange and yellow in this infrared picture of sea surface temperatures (taken from a NASA satellite, NOAA-7 in July 1984). Hot air is lighter than cold air and will rise into the sky until it reaches approximately 10 km (6 miles) altitude and will spread to the North and the South. If the globe did not rotate, the air would simply arrive at the North Pole and the South Pole, sink down, and return to the equator. The power emission from the sun is 1.37 kW/m 2 on the surface of the sphere, which has the sun as its centre and the average radius of the earth trajectory. The power hits a circular disc with an area of of 1.27 x 10 14 m 2 . The power emitted to the earth is thus 1.74 x 10 17W.
  • 13. Secondary Circulation The wind rises from the equator and moves north and south in the higher layers of the atmosphere. Around 30°; latitude in both hemispheres the Coriolis force prevents the air from moving much farther. At this latitude there is a high pressure area, as the air begins sinking down again. As the wind rises from the equator there will be a low pressure area close to ground level attracting winds from the North and South. At the Poles, there will be high pressure due to the cooling of the air. Keeping in mind the bending force of the Coriolis force, we thus have the following general results for the prevailing wind direction: Latitude: 90-60°N 60-30°N 30-0°N 0-30°S 30-60°S 60-90°S Direction: NE SW NE SE NW SE
  • 14. Tertiary Circulations Land masses are heated by the sun more quickly than the sea in the daytime. The air rises, flows out to the sea, and creates a low pressure at ground level which attracts the cool air from the sea. This is called a sea breeze. At nightfall there is often a period of calm when land and sea temperatures are equal. At night the wind blows in the opposite direction. The land breeze at night generally has lower wind speeds, because the temperature difference between land and sea is smaller at night. The monsoon known from South-East Asia is in reality a large-scale form of the sea breeze and land breeze, varying in its direction between seasons, because land masses are heated or cooled more quickly than the sea. Sea Breezes
  • 15. Mountain winds Mountain regions display many interesting weather patterns. One example is the valley wind which originates on south-facing slopes (north-facing in the southern hemisphere). When the slopes and the neighboring air are heated the density of the air decreases, and the air ascends towards the top following the surface of the slope. At night the wind direction is reversed, and turns into a down slope wind. If the valley floor is sloped, the air may move down or up the valley, as a canyon wind. Winds flowing down the leeward sides of mountains can be quite powerful:
  • 16.
  • 17. Site / WTG Classification Wind Class/Turbulence Annual average wind speed at hub-height(m/s) Extreme 50-year gust in meters/second (miles/hour) I A High wind - Higher Turbulence 18% 10.0 70 (156) I B High wind - Lower Turbulence 16% 10.0 70 (156) II A Medium wind - Higher Turbulence 18% 8.5 59.5 (133) II B Medium wind - Lower Turbulence 16% 8.5 59.5 (133) III A Low wind - Higher Turbulence 18% 7.5 52.5 (117) III B Low wind - Lower Turbulence 16% 7.5 52.5 (117) IV 6.0 42.0 (94)
  • 18. Wind Power Conversion technologies • There is a kinetic energy in the moving air. That is Wind • P = ½ rAV3Cp Where P = the power of the wind measured in W (Watt). r = (rho) = the density of dry air = 1.225 measured in kg/m 3 (kilograms per cubic meter, at average atmospheric pressure at sea level at 15° C). v = the velocity of the wind measured in m/s (meters per second). A= Area of the turbine in Square meters Cp = Conversion Factor (or) Efficiency of the turbine • The mechanical device which converts this kinetic energy to Mechanical rotational energy is called Turbine
  • 19. BETZ Limit The lower the value of V2, the more energy extracted by the wind turbine, the more is the efficiency. So if V2 =0 , do we produce maximum power? Max Theoretical Efficiency= 59% when V2/V1=1/3
  • 23. Classification of turbines By Mechanical features Turbine direction Vertical Horizontal Wind direction UP Wind DOWN Wind Number of blades TWO Blade THREE Blade
  • 24. Vertical Axis Wind Turbines Downwind Machines Two-Bladed
  • 25. Classification of turbines By Mechanical features Turbine regulation PITCH STALL BREAKING Aerodynamic Mechanical Tower Tubular Lattice
  • 26. Regulation PITCH Regulation STALL Regulation
  • 27. Generators Wind Generators Synchronous WRSG PMSG Asynchronous WRIG DFIG Flexi Slip SCIG Single Speed Dual Speed
  • 29. Generators - Asynchronous Advantages: 1) These generators are nothing but the induction Motors 2) Very simple mechanism 3) There is no need of huge synchronizing and excitation circuits Disadvantages: 1) Draws inductive reactance from grid causing low power factor 2) Requires power factor correction circuit and Capacitors 3) Huge wear and tear
  • 31.
  • 32.
  • 35. Generators - Synchronous Advantages: 1) These generators can generate their own VAR 2) By changing excitation we can generate the power at leading or lagging. No need of power factor correction capacitors 3) Wind mills with synchronous generators will have lesser cut-in wind speed (they can generate power at low wind speed also) 4) There is no need of huge gear boxes 5) In certain cases the Wind mills can be operated as stand alone system of generation Disadvantages: 1) These generators requires huge power electronic support 2) Requires very sophisticated controls
  • 36. The gear concept and gearless concept in a component comparison Main Shaft Hub Rotor Shaft Bearings Clutch Gear Brake Generator Generator Rotor Generator Stator Hub Main Bearing Axle pin Conventional Gearless
  • 37. Typical Synchronous Wind Energy Converter Block Diagram
  • 40. Major Phases of the project
  • 41. Wind Resourcing and Assessing • wind mast with 2 sets of Anemometers & wind vanes at different heights will be erected at the prospective site. • Height of wind mast will be depending up of the class of the site • Wind Speed, Wind direction, Temperature and Pressure are measured • Measurement Period: – In general : Minimum of 1 year! – 3 to 5 years is ideal for better estimation of wind climate prevailing at the site Analysis of measured wind data will be the key to • Select wind turbine type based on wind resource • Design wind farm layout based on site conditions • Calculate energy output
  • 42. Key – outputs of WRA REV07, 05-03-2014 Probability of Exceedence PLF(%) P50 30.00 P75 26.78 P90 23.87 Vagarai Monthly % Distribution Apr 2.7% May 7.8% Jun 18.4% Jul 20.5% Aug 18.1% Sep 14.9% Oct 2.4% Nov 1.9% Dec 2.1% Jan 3.6% Feb 4.6% Mar 3.1% Total 100.00% Wind rose
  • 44. Access Roads and Power Evacuation
  • 45.
  • 46. Construction Activities BAR BENDING AND CENTERING WORK.
  • 47. CONCRETE FILLING IN TO THE FOUNDATION.
  • 48. FINAL LOOK OF THE FOUNDATION.
  • 49. Receipt of tower sections Unloading the tower sections
  • 50. Receiving the machine and unloading
  • 51. Blades receipt and unloading
  • 52.
  • 53.
  • 56. The epicenter of this report is to deal with the issues and challenges facing by all the stakeholders under this mechanism and aimed to provide a thought process for resolving the difficulties aroused because of this mechanism in the sector. in MW in % Total Installed Capacity 233930 100 Renewable capacity Installed 29989 12.82 Wind 20149 8.61 Solar 2180 0.93 India is a rapidly growing economy which needs energy to meet its growth objectives in a sustainable manner. The power generation from non-conventional sources like Wind and Solar is an integral part of the energy system. The generation from wind and solar is depends upon the nature with a benefit of being a clean energy source and a challenge of being an infirm source of generation and to predict the generation for optimal management of electricity grid increases manifold. Indian Electricity Grid Code (IEGC) Regulation 2010 which was announced on 28th Apr 2010 identified this challenge. Origin of Forecasting & Scheduling of Wind and Solar power has come through IEGC 2010 and introduced in the form of commercial implication mechanism known as Renewable Regulatory Fund (RRF) which becomes the prime focus for the Regulators. Objective of IEGC to brings together: - A single set of technical and commercial rules, - Facilitation of the optimal operation of the grid, - Facilitation for functioning of power markets, - Facilitation of the development of renewable energy sources by specifying the technical and commercial aspects for integration of these resources into the grid. Instead of following the objectives first, the main focus moved towards the procedural implementation of RRF mechanism without understanding the facts of technical and operational know-hows. The installation falls under RRF for forecasting and scheduling as per CERC order dated 16.01.2013 is not even 1% of total installed capacity in the country. “Does ensuing the 1% of wind/solar generation out of total installed capacity is the real motive?” Answer is no… Backdrop of RRF Mechanism
  • 57. IEGC 2010 IWEA AND CERC PETITION - TASK NLDC - DETAILED RRF PROCEDURE SLDCS TO SUBMIT MOCK EXERCISE DATA FORCE FORMED TASK FORCE SUBMITTED REPORT TO CERC COORDINATING AGENCY/ REFERENCE RATE INTRODUCED BY CERC CERC ACCORDED DETAILED RRF PROCEDURE NLDC - DRAFT DETAILED RRF PROCEDURE …. FILED APPEAL IN CHENNAI RRF STARTED HIGH COURT - MATTER RRF COMMERCIAL MECHNAISM SUSPENDED TILL FURTHER ORDERS ….FILED APPEAL IN DELHI HIGH COURT 28th Apr 2010 18th Feb 2011 30th Nov 2011 27th Mar 2012 04th Sep 2012 16th Jan 2013 12th Jun 2013 09th Jul 2013 15th Jul 2013 07th Jan 2014 DATE MILESTONE 28th Apr 2010 IEGC 2010 18th Feb 2011 NLDC - Detailed RRF Procedure 30th Nov 2011 SLDCs to submit mock exercise data 27th Mar 2012 IWEA and CERC Petition - Task force formed 04th Sep 2012 Task force submitted report to CERC 16th Jan 2013 Coordinating Agency/ Reference Rate introduced by CERC DATE MILESTONE 12th Jun 2013 NLDC - Draft Detailed RRF Procedure 09th Jul 2013 CERC accorded Detailed RRF Procedure 15th Jul 2013 RRF started … . Filed appeal in Chennai High Court - Matter … .Filed appeal in Delhi high Court 07th Jan 2014 RRF Commercial Mechnaism suspended till further orders RRF Timeline
  • 58. Commercial Settlement Overview Dev % range 0 - 30 30 - 50 > 50 -30 - 0 < -30 0 – 30 yes - - - - 30 – 50 yes yes - - - > 50 yes yes yes - - -30 – 0 - - - yes - < -30 - - - yes yes Dev % range 0 - 30 30 -50 > 50 -30 - 0 < -30 0 – 30 A - - - - 30 – 50 A B - - - > 50 A B C - - -30 – 0 - - - A - < -30 - - - A B Commercial Settlement • A. PPA rate – settled by Utility • B. PPA rate – settled by Utility + UI charges w.r.t. frequency settled through RRF • C. UI @ 50 Hz – settled through RRF
  • 59. Wind Power Scheduling Challenges Wind Power Forecasting Communicate forecasted and actual data with SLDC Adaptation of “Availability based tariff” Liability of inaccurate forecasts • Wind power forecast technology is not advanced. • Forecast does not meet the required accuracy limits. • Security issues in data communication • Installation of ABT meters at pooling stations • Most plants in rural areas • Will make the existing projects signed under PT and APPC + REC unviable. • Will adversely effect the growth of wind industry in India. • No forecasting agency or coordinating agency promises accurate forecast.