Introduction to Debuggers
•
45 j'aime•26,788 vues

A quick tutorial on what debuggers are and how to use them. We present a debugging example using GDB. At the end of this tutorial, you will be able to work your way through a crash and analyze the cause of the error responsible for the crash.

Recommandé
Contenu connexe
Tendances
Tendances (20)
Similaire à Introduction to Debuggers
Similaire à Introduction to Debuggers (20)
Plus de Saumil Shah
Plus de Saumil Shah (20)
Dernier
Dernier (20)
Introduction to Debuggers
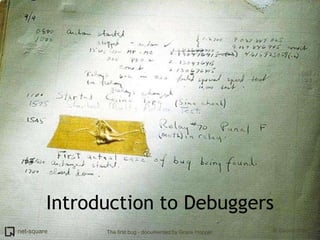
- 1. Introduction to Debuggers The first bug - documented by Grace Hopper
- 2. Introduction
- 3. # who am i Saumil Shah CEO Net-square. Hacker, Speaker, Trainer, Author. M.S. Computer Science Purdue University. Google: "saumil" LinkedIn: saumilshah
- 4. Preview
- 5. Debuggers
- 6. What is a debugger?
- 7. What is a debugger? A program used for debugging other programs or process. It provides...
- 8. What is a debugger? A program used for debugging other programs or process. It provides... Fine grained control over process execution Inspection of CPU state Inspection of process memory
- 9. A debugger lets you...
- 10. Popular debuggers gdb windbg
- 14. crash1.c int main(int argc, char *argv[]) { int number; int *pointer; number = atoi(argv[1]); pointer = number; printnum(pointer); } void printnum(int *x) { printf("The number supplied is %d", *x); }
- 15. What does crash1.c do?
- 16. What does crash1.c do? crash1 takes the first command line argument and converts it to an integer
- 17. What does crash1.c do? crash1 takes the first command line argument and converts it to an integer It then assigns a pointer to this integer... ...and passes it to a function - printnum()
- 18. What does crash1.c do? crash1 takes the first command line argument and converts it to an integer It then assigns a pointer to this integer... ...and passes it to a function - printnum() There are TWO bugs in this program Can you spot them?
- 19. Using gdb
- 20. gdb We shall debug crash1.c using gdb.
- 21. gdb We shall debug crash1.c using gdb. gdb is a command line debugger.
- 22. gdb We shall debug crash1.c using gdb. gdb is a command line debugger. It is very unfriendly at first... ...but very powerful!
- 23. Compiling crash1.c Before we debug crash1.c, we need to compile it. We shall then run crash1 from within gdb itself.
- 24. Compile crash1.c and load it using gdb $ gcc crash1.c -o crash1
- 25. Compile crash1.c and load it using gdb $ gcc crash1.c -o crash1 $ gdb crash1 GNU gdb (GDB) 7.2 Copyright (C) 2010 Free Software Foundation, Inc. License GPLv3+: GNU GPL version 3 or later <http://gnu.org/licenses/gpl.html> This is free software: you are free to change and redistribute it. There is NO WARRANTY, to the extent permitted by law. Type "show copying" and "show warranty" for details. This GDB was configured as "i686-pc-linux-gnu". For bug reporting instructions, please see: <http://www.gnu.org/software/gdb/bugs/>... Reading symbols from /home/user0/crash1...done. (gdb)
- 26. Now run it...
- 27. Now run it... ...with no command line arguments.
- 28. Now run it... ...with no command line arguments. (gdb) run Starting program: /home/user0/crash1 Program received signal SIGSEGV, Segmentation fault. 0x40044c2e in __strtol_internal () from /lib/i686/libc.so.6
- 29. Now run it... ...with no command line arguments. (gdb) run Starting program: /home/user0/crash1 Program received signal SIGSEGV, Segmentation fault. 0x40044c2e in __strtol_internal () from /lib/i686/libc.so.6 The program crashes.
- 30. Now run it... ...with no command line arguments. (gdb) run Starting program: /home/user0/crash1 Program received signal SIGSEGV, Segmentation fault. 0x40044c2e in __strtol_internal () from /lib/i686/libc.so.6 The program crashes. Where in the code did it crash?
- 31. Now run it... ...with no command line arguments. (gdb) run Starting program: /home/user0/crash1 Program received signal SIGSEGV, Segmentation fault. 0x40044c2e in __strtol_internal () from /lib/i686/libc.so.6 The program crashes. Where in the code did it crash? Let us find out where exactly it has crashed.
- 32. Use gdb command "backtrace"
- 33. Use gdb command "backtrace" It tries to reconstruct frames on the stack. We can find out the sequence of function calls at the time of the crash.
- 34. Use gdb command "backtrace" It tries to reconstruct frames on the stack. We can find out the sequence of function calls at the time of the crash. (gdb) backtrace #0 0x40044c2e in __strtol_internal () from /lib/i686/libc.so.6 #1 0x40042579 in atoi () from /lib/i686/libc.so.6 #2 0x0804838c in main ()
- 35. Use gdb command "backtrace" It tries to reconstruct frames on the stack. We can find out the sequence of function calls at the time of the crash. (gdb) backtrace #0 0x40044c2e in __strtol_internal () from /lib/i686/libc.so.6 #1 0x40042579 in atoi () from /lib/i686/libc.so.6 #2 0x0804838c in main () Looks like it crashed after calling atoi().
- 36. Use gdb command "backtrace" It tries to reconstruct frames on the stack. We can find out the sequence of function calls at the time of the crash. (gdb) backtrace #0 0x40044c2e in __strtol_internal () from /lib/i686/libc.so.6 #1 0x40042579 in atoi () from /lib/i686/libc.so.6 #2 0x0804838c in main () Looks like it crashed after calling atoi(). That's right. Let us check out the instructions in the code where it has crashed. EIP points to the last instruction executed.
- 37. "x" to examine memory
- 38. "x" to examine memory (gdb) x/10i $eip => 0x40044c2e: movzx ecx,BYTE PTR [edi] 0x40044c31: mov eax,DWORD PTR [esi] 0x40044c33: movsx edx,cl 0x40044c36: movzx eax,WORD PTR [eax+edx*2] 0x40044c3a: and eax,0x2000 0x40044c3f: test ax,ax
- 39. "x" to examine memory (gdb) x/10i $eip => 0x40044c2e: movzx ecx,BYTE PTR [edi] 0x40044c31: mov eax,DWORD PTR [esi] 0x40044c33: movsx edx,cl 0x40044c36: movzx eax,WORD PTR [eax+edx*2] 0x40044c3a: and eax,0x2000 0x40044c3f: test ax,ax So what is x/10i ?
- 40. "x" to examine memory (gdb) x/10i $eip => 0x40044c2e: movzx ecx,BYTE PTR [edi] 0x40044c31: mov eax,DWORD PTR [esi] 0x40044c33: movsx edx,cl 0x40044c36: movzx eax,WORD PTR [eax+edx*2] 0x40044c3a: and eax,0x2000 0x40044c3f: test ax,ax So what is x/10i ? "x" displays memory contents in various formats. "i" is for instructions (disassembly). 10 is the count of instructions to disassemble. Here are some more options for "x"
- 41. "x" - Examine Memory
- 42. Where did the fault occur?
- 43. Where did the fault occur? Let us see the faulting instruction again.
- 44. Where did the fault occur? Let us see the faulting instruction again. (gdb) x/10i $eip => 0x40044c2e: movzx ecx,BYTE PTR [edi]
- 45. Where did the fault occur? Let us see the faulting instruction again. (gdb) x/10i $eip => 0x40044c2e: movzx ecx,BYTE PTR [edi] movzx ecx, byte ptr [edi] takes the byte at memory address stored within EDI and copies it into the ECX register.
- 46. Where did the fault occur? Let us see the faulting instruction again. (gdb) x/10i $eip => 0x40044c2e: movzx ecx,BYTE PTR [edi] movzx ecx, byte ptr [edi] takes the byte at memory address stored within EDI and copies it into the ECX register. I see no apparent error here.
- 47. Where did the fault occur? Let us see the faulting instruction again. (gdb) x/10i $eip => 0x40044c2e: movzx ecx,BYTE PTR [edi] movzx ecx, byte ptr [edi] takes the byte at memory address stored within EDI and copies it into the ECX register. I see no apparent error here. It depends on where EDI points to. Let us inspect the registers.
- 48. Use the "info registers" command.
- 49. Use the "info registers" command. (gdb) info registers eax 0x40136660 0x40136660 ecx 0x0 0x0 edx 0x0 0x0 ebx 0x40148f50 0x40148f50 esp 0xbffff8d0 0xbffff8d0 ebp 0xbffff928 0xbffff928 esi 0x4014b8b8 0x4014b8b8 edi 0x0 0x0 eip 0x40044c2e 0x40044c2e <__strtol_internal+142> eflags 0x10206 [ PF IF RF ]
- 50. Use the "info registers" command. (gdb) info registers eax 0x40136660 0x40136660 ecx 0x0 0x0 edx 0x0 0x0 ebx 0x40148f50 0x40148f50 esp 0xbffff8d0 0xbffff8d0 ebp 0xbffff928 0xbffff928 esi 0x4014b8b8 0x4014b8b8 edi 0x0 0x0 eip 0x40044c2e 0x40044c2e <__strtol_internal+142> eflags 0x10206 [ PF IF RF ] I see that EDI is 0.
- 51. Use the "info registers" command. (gdb) info registers eax 0x40136660 0x40136660 ecx 0x0 0x0 edx 0x0 0x0 ebx 0x40148f50 0x40148f50 esp 0xbffff8d0 0xbffff8d0 ebp 0xbffff928 0xbffff928 esi 0x4014b8b8 0x4014b8b8 edi 0x0 0x0 eip 0x40044c2e 0x40044c2e <__strtol_internal+142> eflags 0x10206 [ PF IF RF ] I see that EDI is 0. EDI is a NULL pointer. It points to non-existent memory. Hence the crash.
- 52. Let us try and inspect local variables and arguments, if any.
- 53. Let us try and inspect local variables and arguments, if any. Use the "info locals" and "info args" commands.
- 54. Let us try and inspect local variables and arguments, if any. Use the "info locals" and "info args" commands. (gdb) info locals No symbol table info available. (gdb) info args No symbol table info available.
- 55. Let us try and inspect local variables and arguments, if any. Use the "info locals" and "info args" commands. (gdb) info locals No symbol table info available. (gdb) info args No symbol table info available. What does this mean?
- 56. Let us try and inspect local variables and arguments, if any. Use the "info locals" and "info args" commands. (gdb) info locals No symbol table info available. (gdb) info args No symbol table info available. What does this mean? The compiled binary does not contain debugging information to resolve symbols.
- 57. Let us try and inspect local variables and arguments, if any. Use the "info locals" and "info args" commands. (gdb) info locals No symbol table info available. (gdb) info args No symbol table info available. What does this mean? The compiled binary does not contain debugging information to resolve symbols. We need to compile the binary again, this time with proper debugging information.
- 58. Quit the debugger (gdb) q
- 59. Quit the debugger (gdb) q Recompile with debugging information enabled. $ gcc -g crash1.c -o crash1
- 60. Quit the debugger (gdb) q Recompile with debugging information enabled. $ gcc -g crash1.c -o crash1 The "-g" flag tells the compiler to include symbolic debugging information in the compiled binary.
- 61. Load crash1 in gdb again
- 62. Load crash1 in gdb again $ gdb crash1 GNU gdb (GDB) 7.2 Copyright (C) 2010 Free Software Foundation, Inc. License GPLv3+: GNU GPL version 3 or later <http://gnu.org/licenses/gpl.html> This is free software: you are free to change and redistribute it. There is NO WARRANTY, to the extent permitted by law. Type "show copying" and "show warranty" for details. This GDB was configured as "i686-pc-linux-gnu". For bug reporting instructions, please see: <http://www.gnu.org/software/gdb/bugs/>... Reading symbols from /home/user0/crash1...done. (gdb)
- 63. Load crash1 in gdb again $ gdb crash1 GNU gdb (GDB) 7.2 Copyright (C) 2010 Free Software Foundation, Inc. License GPLv3+: GNU GPL version 3 or later <http://gnu.org/licenses/gpl.html> This is free software: you are free to change and redistribute it. There is NO WARRANTY, to the extent permitted by law. Type "show copying" and "show warranty" for details. This GDB was configured as "i686-pc-linux-gnu". For bug reporting instructions, please see: <http://www.gnu.org/software/gdb/bugs/>... Reading symbols from /home/user0/crash1...done. (gdb) Let us look at the program listing, which is now available from the debugging information.
- 64. Use gdb's "list" command
- 65. Use gdb's "list" command (gdb) list 1 #include <stdio.h> 2 3 void printnum(int *x); 4 5 int main(int argc, char *argv[]) 6 { 7 int number; 8 int *pointer; 9 10 number = atoi(argv[1]);
- 66. Use gdb's "list" command (gdb) list 1 #include <stdio.h> 2 3 void printnum(int *x); 4 5 int main(int argc, char *argv[]) 6 { 7 int number; 8 int *pointer; 9 10 number = atoi(argv[1]); But there are more than 10 lines in this program.
- 67. Use gdb's "list" command (gdb) list 1 #include <stdio.h> 2 3 void printnum(int *x); 4 5 int main(int argc, char *argv[]) 6 { 7 int number; 8 int *pointer; 9 10 number = atoi(argv[1]); But there are more than 10 lines in this program. Press Enter on a blank gdb prompt to get another screenful of program listing.
- 68. Recap We know that the program crashed when executing atoi(argv[1]).
- 69. Recap We know that the program crashed when executing atoi(argv[1]). We shall now set a breakpoint at the statement where atoi() is called.
- 70. Recap We know that the program crashed when executing atoi(argv[1]). We shall now set a breakpoint at the statement where atoi() is called. atoi() is called in line #10: 7 int number; 8 int *pointer; 9 10 number = atoi(argv[1]);
- 71. Use gdb's "break" command to set a breakpoint.
- 72. Use gdb's "break" command to set a breakpoint. (gdb) break 10 Breakpoint 1 at 0x804837c: file crash1.c, line 10.
- 73. Use gdb's "break" command to set a breakpoint. (gdb) break 10 Breakpoint 1 at 0x804837c: file crash1.c, line 10. Now let us run the program.
- 74. Use gdb's "break" command to set a breakpoint. (gdb) break 10 Breakpoint 1 at 0x804837c: file crash1.c, line 10. Now let us run the program. (gdb) run Starting program: /home/user0/crash1 Breakpoint 1, main (argc=0x1, argv=0xbffff9b4) at crash1.c:10 10 number = atoi(argv[1]);
- 75. Use gdb's "break" command to set a breakpoint. (gdb) break 10 Breakpoint 1 at 0x804837c: file crash1.c, line 10. Now let us run the program. (gdb) run Starting program: /home/user0/crash1 Breakpoint 1, main (argc=0x1, argv=0xbffff9b4) at crash1.c:10 10 number = atoi(argv[1]); Process execution is suspended when it reaches the breakpoint. Control is transferred to gdb.
- 76. Use gdb's "break" command to set a breakpoint. (gdb) break 10 Breakpoint 1 at 0x804837c: file crash1.c, line 10. Now let us run the program. (gdb) run Starting program: /home/user0/crash1 Breakpoint 1, main (argc=0x1, argv=0xbffff9b4) at crash1.c:10 10 number = atoi(argv[1]); Process execution is suspended when it reaches the breakpoint. Control is transferred to gdb. Let us now look at argv[1]. gdb will now allow us to inspect variables symbolically.
- 77. gdb's "print" command lets us inspect variables.
- 78. gdb's "print" command lets us inspect variables. (gdb) print argv[1] $1 = 0x0
- 79. gdb's "print" command lets us inspect variables. (gdb) print argv[1] $1 = 0x0 argv[1] is the culprit NULL pointer! This is what gets loaded into the EDI register (remember?)
- 80. gdb's "print" command lets us inspect variables. (gdb) print argv[1] $1 = 0x0 argv[1] is the culprit NULL pointer! This is what gets loaded into the EDI register (remember?) Let us continue with the process execution.
- 81. gdb's "print" command lets us inspect variables. (gdb) print argv[1] $1 = 0x0 argv[1] is the culprit NULL pointer! This is what gets loaded into the EDI register (remember?) Let us continue with the process execution. (gdb) continue Continuing. Program received signal SIGSEGV, Segmentation fault. 0x40044c2e in __strtol_internal () from /lib/i686/libc.so.6
- 82. gdb's "print" command lets us inspect variables. (gdb) print argv[1] $1 = 0x0 argv[1] is the culprit NULL pointer! This is what gets loaded into the EDI register (remember?) Let us continue with the process execution. (gdb) continue Continuing. Program received signal SIGSEGV, Segmentation fault. 0x40044c2e in __strtol_internal () from /lib/i686/libc.so.6 As expected, here's the segmentation fault. Verify the value of EDI using "info registers" and the disassembly of the crash using "x/10i $eip"
- 83. Bug #1 - Null pointer To fix this problem the programmer needs to check the number of command line arguments before using argv[1] in the program.
- 84. Bug #1 - Null pointer To fix this problem the programmer needs to check the number of command line arguments before using argv[1] in the program. For now, we shall run the program with a valid argv[1] supplied.
- 85. Bug #1 - Null pointer To fix this problem the programmer needs to check the number of command line arguments before using argv[1] in the program. For now, we shall run the program with a valid argv[1] supplied. On to bug #2. Quit gdb and load crash1 again.
- 86. Load crash1 in gdb again. $ gdb crash1 GNU gdb (GDB) 7.2 ... Reading symbols from /home/user0/crash1...done. (gdb)
- 87. Load crash1 in gdb again. $ gdb crash1 GNU gdb (GDB) 7.2 ... Reading symbols from /home/user0/crash1...done. (gdb) Run it with argument 1 as 255 (or any number) (gdb) run 255 Starting program: /home/user0/crash1 255 Program received signal SIGSEGV, Segmentation fault. 0x080483b4 in printnum (x=0xff) at crash1.c:17 17 printf("The number supplied is %d", *x);
- 88. Load crash1 in gdb again. $ gdb crash1 GNU gdb (GDB) 7.2 ... Reading symbols from /home/user0/crash1...done. (gdb) Run it with argument 1 as 255 (or any number) (gdb) run 255 Starting program: /home/user0/crash1 255 Program received signal SIGSEGV, Segmentation fault. 0x080483b4 in printnum (x=0xff) at crash1.c:17 17 printf("The number supplied is %d", *x); Another segmentation fault. Another crash.
- 89. What do we do now?
- 90. What do we do now? I thought I asked the questions!
- 91. What do we do now? I thought I asked the questions! We see where we crashed by examining frames from the stack. The "backtrace" command. (gdb) backtrace #0 0x080483b4 in printnum (x=0xff) at crash1.c:17 #1 0x080483a3 in main (argc=0x2, argv=0xbffff9b4) at crash1.c:12
- 92. What do we do now? I thought I asked the questions! We see where we crashed by examining frames from the stack. The "backtrace" command. (gdb) backtrace #0 0x080483b4 in printnum (x=0xff) at crash1.c:17 #1 0x080483a3 in main (argc=0x2, argv=0xbffff9b4) at crash1.c:12 We crashed inside printnum(). Let us inspect the arguments passed to printnum().
- 93. What do we do now? I thought I asked the questions! We see where we crashed by examining frames from the stack. The "backtrace" command. (gdb) backtrace #0 0x080483b4 in printnum (x=0xff) at crash1.c:17 #1 0x080483a3 in main (argc=0x2, argv=0xbffff9b4) at crash1.c:12 We crashed inside printnum(). Let us inspect the arguments passed to printnum(). (gdb) info args x = 0xff
- 94. What do we do now? I thought I asked the questions! We see where we crashed by examining frames from the stack. The "backtrace" command. (gdb) backtrace #0 0x080483b4 in printnum (x=0xff) at crash1.c:17 #1 0x080483a3 in main (argc=0x2, argv=0xbffff9b4) at crash1.c:12 We crashed inside printnum(). Let us inspect the arguments passed to printnum(). (gdb) info args x = 0xff Isn't x a pointer to an integer (int *x)?
- 95. That's right. x is an integer pointer, set to 0xff.
- 96. That's right. x is an integer pointer, set to 0xff. So it points to memory address 0x000000ff?
- 97. That's right. x is an integer pointer, set to 0xff. So it points to memory address 0x000000ff? Yes. This memory cannot be referenced. Fetching its contents (*x) results in an error.
- 98. That's right. x is an integer pointer, set to 0xff. So it points to memory address 0x000000ff? Yes. This memory cannot be referenced. Fetching its contents (*x) results in an error. How did x get set to 0x000000ff?
- 99. That's right. x is an integer pointer, set to 0xff. So it points to memory address 0x000000ff? Yes. This memory cannot be referenced. Fetching its contents (*x) results in an error. How did x get set to 0x000000ff? The answer lies in how printnum() was called.
- 100. That's right. x is an integer pointer, set to 0xff. So it points to memory address 0x000000ff? Yes. This memory cannot be referenced. Fetching its contents (*x) results in an error. How did x get set to 0x000000ff? The answer lies in how printnum() was called. Let us switch to its calling frame - frame 1 - and inspect frame 1's local variables.
- 101. gdb's "frame <n>" command lets you switch context to other frames.
- 102. gdb's "frame <n>" command lets you switch context to other frames. (gdb) frame 1 #1 0x080483a3 in main (argc=0x2, argv=0xbffff9b4) at crash1.c:12 12 printnum(pointer);
- 103. gdb's "frame <n>" command lets you switch context to other frames. (gdb) frame 1 #1 0x080483a3 in main (argc=0x2, argv=0xbffff9b4) at crash1.c:12 12 printnum(pointer); Inspect frame 1's local variables.
- 104. gdb's "frame <n>" command lets you switch context to other frames. (gdb) frame 1 #1 0x080483a3 in main (argc=0x2, argv=0xbffff9b4) at crash1.c:12 12 printnum(pointer); Inspect frame 1's local variables. (gdb) info locals number = 0xff pointer = 0xff
- 105. gdb's "frame <n>" command lets you switch context to other frames. (gdb) frame 1 #1 0x080483a3 in main (argc=0x2, argv=0xbffff9b4) at crash1.c:12 12 printnum(pointer); Inspect frame 1's local variables. (gdb) info locals number = 0xff pointer = 0xff Do you see the second bug now?
- 106. gdb's "frame <n>" command lets you switch context to other frames. (gdb) frame 1 #1 0x080483a3 in main (argc=0x2, argv=0xbffff9b4) at crash1.c:12 12 printnum(pointer); Inspect frame 1's local variables. (gdb) info locals number = 0xff pointer = 0xff Do you see the second bug now? We are reading the number 255 (0xff) and assigning it to the pointer directly.
- 107. Absolutely correct. What should we do instead?
- 108. Absolutely correct. What should we do instead? Make the pointer POINT to the number.
- 109. Absolutely correct. What should we do instead? Make the pointer POINT to the number. Set the pointer's value to be the ADDRESS of the number and not its value.
- 110. Bug #2 - Pointer mess-up The faulting statement is: pointer = number;
- 111. Bug #2 - Pointer mess-up The faulting statement is: pointer = number; Instead it should be: pointer = &number; //address of number
- 112. Bug #2 - Pointer mess-up The faulting statement is: pointer = number; Instead it should be: pointer = &number; //address of number Let us see what happens at assembly level. Dump instructions at EIP and inspect the registers.
- 113. (gdb) frame 0
- 114. (gdb) frame 0 (gdb) x/10i $eip => 0x80483b4 <printnum+12>: push DWORD PTR [eax] 0x80483b6 <printnum+14>: push 0x8048488 0x80483bb <printnum+19>: call 0x804828c <printf@plt> 0x80483c0 <printnum+24>: add esp,0x10 0x80483c3 <printnum+27>: leave 0x80483c4 <printnum+28>: ret
- 115. (gdb) frame 0 (gdb) x/10i $eip => 0x80483b4 <printnum+12>: push DWORD PTR [eax] 0x80483b6 <printnum+14>: push 0x8048488 0x80483bb <printnum+19>: call 0x804828c <printf@plt> 0x80483c0 <printnum+24>: add esp,0x10 0x80483c3 <printnum+27>: leave 0x80483c4 <printnum+28>: ret (gdb) info registers eax 0xff 0xff ecx 0x0 0x0 edx 0x0 0x0 ebx 0x40148f50 0x40148f50 esp 0xbffff938 0xbffff938 ebp 0xbffff948 0xbffff948 esi 0x40012780 0x40012780 edi 0xbffff9b4 0xbffff9b4 eip 0x80483b4 0x80483b4 <printnum+12> eflags 0x10292 [ AF SF IF RF ]
- 116. (gdb) frame 0 (gdb) x/10i $eip => 0x80483b4 <printnum+12>: push DWORD PTR [eax] 0x80483b6 <printnum+14>: push 0x8048488 0x80483bb <printnum+19>: call 0x804828c <printf@plt> 0x80483c0 <printnum+24>: add esp,0x10 0x80483c3 <printnum+27>: leave 0x80483c4 <printnum+28>: ret (gdb) info registers eax 0xff 0xff ecx 0x0 0x0 edx 0x0 0x0 ebx 0x40148f50 0x40148f50 esp 0xbffff938 0xbffff938 ebp 0xbffff948 0xbffff948 esi 0x40012780 0x40012780 edi 0xbffff9b4 0xbffff9b4 eip 0x80483b4 0x80483b4 <printnum+12> eflags 0x10292 [ AF SF IF RF ] We are trying to push a value whose address is stored in EAX. This address is 0x000000ff.
- 117. There are two PUSHes. The first pushes the contents at address EAX onto the stack.
- 118. There are two PUSHes. The first pushes the contents at address EAX onto the stack. EAX stores the address of the pointer x.
- 119. There are two PUSHes. The first pushes the contents at address EAX onto the stack. EAX stores the address of the pointer x. DWORD PTR [EAX] implies *x (contents at addr x)
- 120. There are two PUSHes. The first pushes the contents at address EAX onto the stack. EAX stores the address of the pointer x. DWORD PTR [EAX] implies *x (contents at addr x) What does the second PUSH do? push 0x08048488
- 121. There are two PUSHes. The first pushes the contents at address EAX onto the stack. EAX stores the address of the pointer x. DWORD PTR [EAX] implies *x (contents at addr x) What does the second PUSH do? push 0x08048488 0x08048488 looks like a memory address. Notice that the next instruction is a CALL to printf. => 0x80483b4 <printnum+12>: push DWORD PTR [eax] 0x80483b6 <printnum+14>: push 0x8048488 0x80483bb <printnum+19>: call 0x804828c <printf@plt>
- 122. There are two PUSHes. The first pushes the contents at address EAX onto the stack. EAX stores the address of the pointer x. DWORD PTR [EAX] implies *x (contents at addr x) What does the second PUSH do? push 0x08048488 0x08048488 looks like a memory address. Notice that the next instruction is a CALL to printf. => 0x80483b4 <printnum+12>: push DWORD PTR [eax] 0x80483b6 <printnum+14>: push 0x8048488 0x80483bb <printnum+19>: call 0x804828c <printf@plt> The two PUSHes set up the parameters passed to printf().
- 123. printf() printf("The number supplied is %d", *x);
- 124. printf() printf("The number supplied is %d", *x); push DWORD PTR [eax]
- 125. printf() printf("The number supplied is %d", *x); push DWORD PTR [eax] push 0x8048488
- 126. printf() printf("The number supplied is %d", *x); push DWORD PTR [eax] push 0x8048488 call 0x804828c
- 127. printf() printf("The number supplied is %d", *x); push DWORD PTR [eax] push 0x8048488 call 0x804828c Remember our discussion in the tutorial "HOW FUNCTIONS WORK?"
- 128. So where does address 0x08048488 point to?
- 129. So where does address 0x08048488 point to? It should point to the string: "The number supplied is %d"
- 130. So where does address 0x08048488 point to? It should point to the string: "The number supplied is %d" Let us use the "x" command and find out. We shall use "x/s" to display the output as a string.
- 131. So where does address 0x08048488 point to? It should point to the string: "The number supplied is %d" Let us use the "x" command and find out. We shall use "x/s" to display the output as a string. (gdb) x/s 0x08048488 0x8048488: "The number supplied is %d"
- 132. Disassembling printnum() To wrap this up, let us dive into the assembly code of function printnum(). We shall map out the concepts discussed in "HOW FUNCTIONS WORK".
- 133. Use the "disassemble" command
- 134. Use the "disassemble" command (gdb) disassemble printnum Dump of assembler code for function printnum: 0x080483a8 <+0>: push ebp 0x080483a9 <+1>: mov ebp,esp 0x080483ab <+3>: sub esp,0x8 0x080483ae <+6>: sub esp,0x8 0x080483b1 <+9>: mov eax,DWORD PTR [ebp+0x8] => 0x080483b4 <+12>: push DWORD PTR [eax] 0x080483b6 <+14>: push 0x8048488 0x080483bb <+19>: call 0x804828c <printf@plt> 0x080483c0 <+24>: add esp,0x10 0x080483c3 <+27>: leave 0x080483c4 <+28>: ret End of assembler dump.
- 135. Use the "disassemble" command (gdb) disassemble printnum Dump of assembler code for function printnum: 0x080483a8 <+0>: push ebp 0x080483a9 <+1>: mov ebp,esp 0x080483ab <+3>: sub esp,0x8 0x080483ae <+6>: sub esp,0x8 0x080483b1 <+9>: mov eax,DWORD PTR [ebp+0x8] => 0x080483b4 <+12>: push DWORD PTR [eax] 0x080483b6 <+14>: push 0x8048488 0x080483bb <+19>: call 0x804828c <printf@plt> 0x080483c0 <+24>: add esp,0x10 0x080483c3 <+27>: leave 0x080483c4 <+28>: ret End of assembler dump. Let us map this disassembly to the various components of a function.
- 136. printnum() disassembly Prologue push ebp mov ebp,esp sub esp,0x8 sub esp,0x8 mov eax,DWORD PTR [ebp+0x8] push DWORD PTR [eax] push 0x8048488 call 0x804828c <printf@plt> add esp,0x10 leave ret Body Epilogue Return
- 137. printnum() disassembly Prologue push ebp mov ebp,esp sub esp,0x8 sub esp,0x8 mov eax,DWORD PTR [ebp+0x8] > push DWORD PTR [eax] push 0x8048488 call 0x804828c <printf@plt> add esp,0x10 leave ret Body Epilogue Return Crash occurs at "push dword ptr [eax]".
- 138. printnum() disassembly Prologue push ebp mov ebp,esp sub esp,0x8 sub esp,0x8 mov eax,DWORD PTR [ebp+0x8] > push DWORD PTR [eax] push 0x8048488 call 0x804828c <printf@plt> add esp,0x10 leave ret Body Epilogue Return Crash occurs at "push dword ptr [eax]". Let us see how the stack is built up.
- 139. Before printnum() is called push ebp mov ebp,esp sub esp,0x8 sub esp,0x8 mov eax,DWORD PTR [ebp+0x8] push DWORD PTR [eax] push 0x8048488 call 0x804828c <printf@plt> add esp,0x10 leave ret Pointer x is pushed on the stack... 0x000000ff ESP ... EBP
- 140. Before printnum() is called > push ebp mov ebp,esp sub esp,0x8 sub esp,0x8 mov eax,DWORD PTR [ebp+0x8] push DWORD PTR [eax] push 0x8048488 call 0x804828c <printf@plt> add esp,0x10 leave ret ...and printnum is CALLed. Saved EIP ESP 0x000000ff param 1 ... EBP
- 141. Prologue push ebp > mov ebp,esp sub esp,0x8 sub esp,0x8 mov eax,DWORD PTR [ebp+0x8] push DWORD PTR [eax] push 0x8048488 call 0x804828c <printf@plt> add esp,0x10 leave ret Old EBP ESP Save the old frame pointer. Saved EIP 0x000000ff param 1 ... EBP
- 142. Prologue push ebp mov ebp,esp > sub esp,0x8 sub esp,0x8 mov eax,DWORD PTR [ebp+0x8] push DWORD PTR [eax] push 0x8048488 call 0x804828c <printf@plt> add esp,0x10 leave ret Old EBP EBP ESP Set the EBP to the current frame. Saved EIP 0x000000ff param 1 ...
- 143. Prologue push ebp mov ebp,esp sub esp,0x8 sub esp,0x8 > mov eax,DWORD PTR [ebp+0x8] push DWORD PTR [eax] push 0x8048488 call 0x804828c <printf@plt> add esp,0x10 leave ret ... ESP ... ... ... Old EBP EBP Leave some space on the stack (16 bytes) Saved EIP 0x000000ff param 1 ...
- 144. Body push ebp mov ebp,esp sub esp,0x8 sub esp,0x8 mov eax,DWORD PTR [ebp+0x8] > push DWORD PTR [eax] push 0x8048488 call 0x804828c <printf@plt> add esp,0x10 leave ret ... ESP ... ... ... Old EBP EBP EAX = 0x000000ff Saved EIP 0x000000ff param 1 ...
- 145. Segmentation Fault! push ebp mov ebp,esp sub esp,0x8 sub esp,0x8 mov eax,DWORD PTR [ebp+0x8] >push DWORD PTR [eax] push 0x8048488 call 0x804828c <printf@plt> add esp,0x10 leave ret ... ESP ... ... ... Old EBP EBP Memory at 0x000000ff cannot be referenced. Saved EIP 0x000000ff param 1 ...
- 146. Segmentation Fault! push ebp mov ebp,esp sub esp,0x8 sub esp,0x8 mov eax,DWORD PTR [ebp+0x8] >push DWORD PTR [eax] push 0x8048488 call 0x804828c <printf@plt> add esp,0x10 leave ret ... ESP ... ... ... Old EBP EBP Memory at 0x000000ff cannot be referenced. Saved EIP 0x000000ff param 1 What will stack memory contain at this moment? ...
- 147. Examine stack memory and registers
- 148. Examine stack memory and registers (gdb) x/16xw $esp 0xbffff938: 0x0000000a 0x00000000 0x40042550 0x40012df8 0xbffff948: 0xbffff968 0x080483a3 0x000000ff 0xbffff9b4 0xbffff958: 0xbffff968 0x080483dc 0x000000ff 0x000000ff 0xbffff968: 0xbffff988 0x4002e7f7 0x00000002 0xbffff9b4
- 149. Examine stack memory and registers (gdb) x/16xw $esp 0xbffff938: 0x0000000a 0x00000000 0x40042550 0x40012df8 0xbffff948: 0xbffff968 0x080483a3 0x000000ff 0xbffff9b4 0xbffff958: 0xbffff968 0x080483dc 0x000000ff 0x000000ff 0xbffff968: 0xbffff988 0x4002e7f7 0x00000002 0xbffff9b4 (gdb) info registers eax 0xff ecx 0x0 edx 0x0 ebx 0x40148f50 esp 0xbffff938 ebp 0xbffff948 esi 0x40012780 edi 0xbffff9b4 eip 0x80483b4
- 150. Examine stack memory and registers (gdb) x/16xw $esp 0xbffff938: 0x0000000a 0x00000000 0x40042550 0x40012df8 0xbffff948: 0xbffff968 0x080483a3 0x000000ff 0xbffff9b4 0xbffff958: 0xbffff968 0x080483dc 0x000000ff 0x000000ff 0xbffff968: 0xbffff988 0x4002e7f7 0x00000002 0xbffff9b4 (gdb) info registers eax 0xff ecx 0x0 edx 0x0 ebx 0x40148f50 esp 0xbffff938 ebp 0xbffff948 esi 0x40012780 edi 0xbffff9b4 eip 0x80483b4 0x0000000a ESP0xbffff938: 0x00000000 0xbffff93c: 0x40042550 0xbffff940: 0xbffff944: 0x40012df8 EBP0xbffff948: 0xbffff968 Saved EIP 0xbffff94c: 0x080483a3 Param 1 0xbffff950: 0x000000ff 0xbffff954: 0xbffff9b4 0xbffff958: 0xbffff968
- 151. Recap We have seen how to analyze crashes and identify causes of errors. We also saw a lot of gdb commands and when to use them.
- 152. Summary of gdb commands
- 153. A few gdb commands
- 154. A few more gdb commands
- 155. Review
- 156. END photo: Brian Searle - bit.ly/fpcxY9