SlideShare une entreprise Scribd logo
1  sur  10
Télécharger pour lire hors ligne
Different Types of Graphs
MATHEMATICS PRESENTATION
Line Graph
Line graphs are ideal for
showing trends and
patterns over time. They
are commonly used in
various fields such as
economics, science, and
finance to visualize
changes in data over
continuous time intervals.
Graphs are visual representations of data that are used to
communicate, analyse, and interpret information. They serve as
powerful tools for summarising datasets, identifying patterns and
trends, comparing different variables or groups, and making data-
driven decisions. By presenting data graphically, graphs help make
information more accessible, engaging, and actionable for both
experts and non-experts alike.
Side-by-side bar gRAPH
Side-by-side bar graphs
compare two or more
categories across
different groups or
conditions. They make it
easier to identify
patterns, differences, and
relationships between the
groups. 0
5
10
15
20
Fish Cats Dogs
stacked bar graph
Side-by-side bar graphs
compare two or more
categories across
different groups or
conditions. They make it
easier to identify
patterns, differences, and
relationships between the
groups. 0
10
20
30
40
50
Year 5 Year 6 Year 7 Year 8
Pie Chart
Pie charts are useful for
displaying the relative
proportions or
percentages of different
categories within a
dataset. They are
effective in showing the
composition of a whole.
Histogram
Histograms are best used
to visualise the frequency
distribution of continuous
data. They are
particularly useful for
identifying patterns and
distributions within
datasets.
Scatter Plot
Scatter plots are ideal for
visualising relationships
or correlations between
two variables. They are
commonly used to
identify patterns and
trends in data points.
Box Plot
Box plots are useful for
visually summarising the
distribution, spread, and
variability of a dataset.
They are effective in
identifying outliers and
comparing the distribution
of data across different
groups or categories
Monday
Tuesday
Wednesday
Thursday
Friday
Pictograph
Pictographs are useful for
presenting data in a
visually appealing and
easily understandable
way, especially for
younger audiences or
when dealing with simple
data sets.

Contenu connexe

Similaire à Different Types of Graphs Mathematics Presentation.pdf

Charissa Kristine B
Charissa Kristine BCharissa Kristine B
Charissa Kristine Bjuvinmiscala
 
Data Visualisation.pdf
Data Visualisation.pdfData Visualisation.pdf
Data Visualisation.pdfThiyagu K
 
Different types of charts
Different types of chartsDifferent types of charts
Different types of chartsZakaria Salim
 
Graphicalrepresntationofdatausingstatisticaltools2019_210902_105156.pdf
Graphicalrepresntationofdatausingstatisticaltools2019_210902_105156.pdfGraphicalrepresntationofdatausingstatisticaltools2019_210902_105156.pdf
Graphicalrepresntationofdatausingstatisticaltools2019_210902_105156.pdfHimakshi7
 
Different Diagrams & Charts in Modern Education (Educational Technology)
Different Diagrams & Charts in Modern Education (Educational Technology)Different Diagrams & Charts in Modern Education (Educational Technology)
Different Diagrams & Charts in Modern Education (Educational Technology)Jewel Jem
 
Graphs and chars
Graphs and charsGraphs and chars
Graphs and charssalemhusin
 
Exploi Exploratory Data Analysis.pdf
Exploi Exploratory Data Analysis.pdfExploi Exploratory Data Analysis.pdf
Exploi Exploratory Data Analysis.pdf21CS031MouneshT
 
Lab file on research methodology
Lab file on research methodologyLab file on research methodology
Lab file on research methodologySukhchain Aggarwal
 
Top 7 types of Statistics Graphs for Data Representation
Top 7 types of Statistics Graphs for Data RepresentationTop 7 types of Statistics Graphs for Data Representation
Top 7 types of Statistics Graphs for Data RepresentationStat Analytica
 
GIS Ostrava 2018 – Insights for ArGIS
GIS Ostrava 2018 – Insights for ArGISGIS Ostrava 2018 – Insights for ArGIS
GIS Ostrava 2018 – Insights for ArGISJan Novotný
 
Atamullayev Suxrob topic 9 XT1-2031.pptx
Atamullayev Suxrob topic 9 XT1-2031.pptxAtamullayev Suxrob topic 9 XT1-2031.pptx
Atamullayev Suxrob topic 9 XT1-2031.pptxsuxrobatamullaev
 
Data Analysis, Presentation and Interpretation of Data
Data Analysis, Presentation and Interpretation of DataData Analysis, Presentation and Interpretation of Data
Data Analysis, Presentation and Interpretation of DataRoqui Malijan
 
Guía sobre como diseñar graficos para tus informes
Guía sobre como diseñar graficos para tus informesGuía sobre como diseñar graficos para tus informes
Guía sobre como diseñar graficos para tus informesGroupM Spain
 
Problem Solving Tools - Susan
Problem Solving Tools - SusanProblem Solving Tools - Susan
Problem Solving Tools - Susanelsanora
 
Understanding on graph in bpo
Understanding on graph in bpoUnderstanding on graph in bpo
Understanding on graph in bpoAjit Kumar
 

Similaire à Different Types of Graphs Mathematics Presentation.pdf (20)

Charissa Kristine B
Charissa Kristine BCharissa Kristine B
Charissa Kristine B
 
Bigdata
BigdataBigdata
Bigdata
 
Data Visualisation.pdf
Data Visualisation.pdfData Visualisation.pdf
Data Visualisation.pdf
 
Different types of charts
Different types of chartsDifferent types of charts
Different types of charts
 
Graphicalrepresntationofdatausingstatisticaltools2019_210902_105156.pdf
Graphicalrepresntationofdatausingstatisticaltools2019_210902_105156.pdfGraphicalrepresntationofdatausingstatisticaltools2019_210902_105156.pdf
Graphicalrepresntationofdatausingstatisticaltools2019_210902_105156.pdf
 
Different Diagrams & Charts in Modern Education (Educational Technology)
Different Diagrams & Charts in Modern Education (Educational Technology)Different Diagrams & Charts in Modern Education (Educational Technology)
Different Diagrams & Charts in Modern Education (Educational Technology)
 
Making Sense of Data - 3rd Sector Learning Lab
Making Sense of Data - 3rd Sector Learning LabMaking Sense of Data - 3rd Sector Learning Lab
Making Sense of Data - 3rd Sector Learning Lab
 
Graphs and chars
Graphs and charsGraphs and chars
Graphs and chars
 
Graphs in Biostatistics
Graphs in Biostatistics Graphs in Biostatistics
Graphs in Biostatistics
 
Exploi Exploratory Data Analysis.pdf
Exploi Exploratory Data Analysis.pdfExploi Exploratory Data Analysis.pdf
Exploi Exploratory Data Analysis.pdf
 
Lab file on research methodology
Lab file on research methodologyLab file on research methodology
Lab file on research methodology
 
Top 7 types of Statistics Graphs for Data Representation
Top 7 types of Statistics Graphs for Data RepresentationTop 7 types of Statistics Graphs for Data Representation
Top 7 types of Statistics Graphs for Data Representation
 
GIS Ostrava 2018 – Insights for ArGIS
GIS Ostrava 2018 – Insights for ArGISGIS Ostrava 2018 – Insights for ArGIS
GIS Ostrava 2018 – Insights for ArGIS
 
Data Visualization
Data VisualizationData Visualization
Data Visualization
 
Atamullayev Suxrob topic 9 XT1-2031.pptx
Atamullayev Suxrob topic 9 XT1-2031.pptxAtamullayev Suxrob topic 9 XT1-2031.pptx
Atamullayev Suxrob topic 9 XT1-2031.pptx
 
Data Analysis, Presentation and Interpretation of Data
Data Analysis, Presentation and Interpretation of DataData Analysis, Presentation and Interpretation of Data
Data Analysis, Presentation and Interpretation of Data
 
Guía sobre como diseñar graficos para tus informes
Guía sobre como diseñar graficos para tus informesGuía sobre como diseñar graficos para tus informes
Guía sobre como diseñar graficos para tus informes
 
Data Visualization Technique - How to Design Charts and Graphs
Data Visualization Technique - How to Design Charts and GraphsData Visualization Technique - How to Design Charts and Graphs
Data Visualization Technique - How to Design Charts and Graphs
 
Problem Solving Tools - Susan
Problem Solving Tools - SusanProblem Solving Tools - Susan
Problem Solving Tools - Susan
 
Understanding on graph in bpo
Understanding on graph in bpoUnderstanding on graph in bpo
Understanding on graph in bpo
 

Dernier

IGNOU MSCCFT and PGDCFT Exam Question Pattern: MCFT003 Counselling and Family...
IGNOU MSCCFT and PGDCFT Exam Question Pattern: MCFT003 Counselling and Family...IGNOU MSCCFT and PGDCFT Exam Question Pattern: MCFT003 Counselling and Family...
IGNOU MSCCFT and PGDCFT Exam Question Pattern: MCFT003 Counselling and Family...PsychoTech Services
 
Nutritional Needs Presentation - HLTH 104
Nutritional Needs Presentation - HLTH 104Nutritional Needs Presentation - HLTH 104
Nutritional Needs Presentation - HLTH 104misteraugie
 
Interactive Powerpoint_How to Master effective communication
Interactive Powerpoint_How to Master effective communicationInteractive Powerpoint_How to Master effective communication
Interactive Powerpoint_How to Master effective communicationnomboosow
 
Unit-IV- Pharma. Marketing Channels.pptx
Unit-IV- Pharma. Marketing Channels.pptxUnit-IV- Pharma. Marketing Channels.pptx
Unit-IV- Pharma. Marketing Channels.pptxVishalSingh1417
 
Russian Escort Service in Delhi 11k Hotel Foreigner Russian Call Girls in Delhi
Russian Escort Service in Delhi 11k Hotel Foreigner Russian Call Girls in DelhiRussian Escort Service in Delhi 11k Hotel Foreigner Russian Call Girls in Delhi
Russian Escort Service in Delhi 11k Hotel Foreigner Russian Call Girls in Delhikauryashika82
 
Kisan Call Centre - To harness potential of ICT in Agriculture by answer farm...
Kisan Call Centre - To harness potential of ICT in Agriculture by answer farm...Kisan Call Centre - To harness potential of ICT in Agriculture by answer farm...
Kisan Call Centre - To harness potential of ICT in Agriculture by answer farm...Krashi Coaching
 
The Most Excellent Way | 1 Corinthians 13
The Most Excellent Way | 1 Corinthians 13The Most Excellent Way | 1 Corinthians 13
The Most Excellent Way | 1 Corinthians 13Steve Thomason
 
Measures of Dispersion and Variability: Range, QD, AD and SD
Measures of Dispersion and Variability: Range, QD, AD and SDMeasures of Dispersion and Variability: Range, QD, AD and SD
Measures of Dispersion and Variability: Range, QD, AD and SDThiyagu K
 
Holdier Curriculum Vitae (April 2024).pdf
Holdier Curriculum Vitae (April 2024).pdfHoldier Curriculum Vitae (April 2024).pdf
Holdier Curriculum Vitae (April 2024).pdfagholdier
 
Beyond the EU: DORA and NIS 2 Directive's Global Impact
Beyond the EU: DORA and NIS 2 Directive's Global ImpactBeyond the EU: DORA and NIS 2 Directive's Global Impact
Beyond the EU: DORA and NIS 2 Directive's Global ImpactPECB
 
Q4-W6-Restating Informational Text Grade 3
Q4-W6-Restating Informational Text Grade 3Q4-W6-Restating Informational Text Grade 3
Q4-W6-Restating Informational Text Grade 3JemimahLaneBuaron
 
APM Welcome, APM North West Network Conference, Synergies Across Sectors
APM Welcome, APM North West Network Conference, Synergies Across SectorsAPM Welcome, APM North West Network Conference, Synergies Across Sectors
APM Welcome, APM North West Network Conference, Synergies Across SectorsAssociation for Project Management
 
A Critique of the Proposed National Education Policy Reform
A Critique of the Proposed National Education Policy ReformA Critique of the Proposed National Education Policy Reform
A Critique of the Proposed National Education Policy ReformChameera Dedduwage
 
Accessible design: Minimum effort, maximum impact
Accessible design: Minimum effort, maximum impactAccessible design: Minimum effort, maximum impact
Accessible design: Minimum effort, maximum impactdawncurless
 
Software Engineering Methodologies (overview)
Software Engineering Methodologies (overview)Software Engineering Methodologies (overview)
Software Engineering Methodologies (overview)eniolaolutunde
 
Student login on Anyboli platform.helpin
Student login on Anyboli platform.helpinStudent login on Anyboli platform.helpin
Student login on Anyboli platform.helpinRaunakKeshri1
 
The basics of sentences session 2pptx copy.pptx
The basics of sentences session 2pptx copy.pptxThe basics of sentences session 2pptx copy.pptx
The basics of sentences session 2pptx copy.pptxheathfieldcps1
 

Dernier (20)

IGNOU MSCCFT and PGDCFT Exam Question Pattern: MCFT003 Counselling and Family...
IGNOU MSCCFT and PGDCFT Exam Question Pattern: MCFT003 Counselling and Family...IGNOU MSCCFT and PGDCFT Exam Question Pattern: MCFT003 Counselling and Family...
IGNOU MSCCFT and PGDCFT Exam Question Pattern: MCFT003 Counselling and Family...
 
Nutritional Needs Presentation - HLTH 104
Nutritional Needs Presentation - HLTH 104Nutritional Needs Presentation - HLTH 104
Nutritional Needs Presentation - HLTH 104
 
Interactive Powerpoint_How to Master effective communication
Interactive Powerpoint_How to Master effective communicationInteractive Powerpoint_How to Master effective communication
Interactive Powerpoint_How to Master effective communication
 
Unit-IV- Pharma. Marketing Channels.pptx
Unit-IV- Pharma. Marketing Channels.pptxUnit-IV- Pharma. Marketing Channels.pptx
Unit-IV- Pharma. Marketing Channels.pptx
 
Russian Escort Service in Delhi 11k Hotel Foreigner Russian Call Girls in Delhi
Russian Escort Service in Delhi 11k Hotel Foreigner Russian Call Girls in DelhiRussian Escort Service in Delhi 11k Hotel Foreigner Russian Call Girls in Delhi
Russian Escort Service in Delhi 11k Hotel Foreigner Russian Call Girls in Delhi
 
Kisan Call Centre - To harness potential of ICT in Agriculture by answer farm...
Kisan Call Centre - To harness potential of ICT in Agriculture by answer farm...Kisan Call Centre - To harness potential of ICT in Agriculture by answer farm...
Kisan Call Centre - To harness potential of ICT in Agriculture by answer farm...
 
Mattingly "AI & Prompt Design: The Basics of Prompt Design"
Mattingly "AI & Prompt Design: The Basics of Prompt Design"Mattingly "AI & Prompt Design: The Basics of Prompt Design"
Mattingly "AI & Prompt Design: The Basics of Prompt Design"
 
The Most Excellent Way | 1 Corinthians 13
The Most Excellent Way | 1 Corinthians 13The Most Excellent Way | 1 Corinthians 13
The Most Excellent Way | 1 Corinthians 13
 
Measures of Dispersion and Variability: Range, QD, AD and SD
Measures of Dispersion and Variability: Range, QD, AD and SDMeasures of Dispersion and Variability: Range, QD, AD and SD
Measures of Dispersion and Variability: Range, QD, AD and SD
 
Holdier Curriculum Vitae (April 2024).pdf
Holdier Curriculum Vitae (April 2024).pdfHoldier Curriculum Vitae (April 2024).pdf
Holdier Curriculum Vitae (April 2024).pdf
 
Beyond the EU: DORA and NIS 2 Directive's Global Impact
Beyond the EU: DORA and NIS 2 Directive's Global ImpactBeyond the EU: DORA and NIS 2 Directive's Global Impact
Beyond the EU: DORA and NIS 2 Directive's Global Impact
 
Q4-W6-Restating Informational Text Grade 3
Q4-W6-Restating Informational Text Grade 3Q4-W6-Restating Informational Text Grade 3
Q4-W6-Restating Informational Text Grade 3
 
APM Welcome, APM North West Network Conference, Synergies Across Sectors
APM Welcome, APM North West Network Conference, Synergies Across SectorsAPM Welcome, APM North West Network Conference, Synergies Across Sectors
APM Welcome, APM North West Network Conference, Synergies Across Sectors
 
A Critique of the Proposed National Education Policy Reform
A Critique of the Proposed National Education Policy ReformA Critique of the Proposed National Education Policy Reform
A Critique of the Proposed National Education Policy Reform
 
Accessible design: Minimum effort, maximum impact
Accessible design: Minimum effort, maximum impactAccessible design: Minimum effort, maximum impact
Accessible design: Minimum effort, maximum impact
 
Software Engineering Methodologies (overview)
Software Engineering Methodologies (overview)Software Engineering Methodologies (overview)
Software Engineering Methodologies (overview)
 
Student login on Anyboli platform.helpin
Student login on Anyboli platform.helpinStudent login on Anyboli platform.helpin
Student login on Anyboli platform.helpin
 
Mattingly "AI & Prompt Design: Structured Data, Assistants, & RAG"
Mattingly "AI & Prompt Design: Structured Data, Assistants, & RAG"Mattingly "AI & Prompt Design: Structured Data, Assistants, & RAG"
Mattingly "AI & Prompt Design: Structured Data, Assistants, & RAG"
 
INDIA QUIZ 2024 RLAC DELHI UNIVERSITY.pptx
INDIA QUIZ 2024 RLAC DELHI UNIVERSITY.pptxINDIA QUIZ 2024 RLAC DELHI UNIVERSITY.pptx
INDIA QUIZ 2024 RLAC DELHI UNIVERSITY.pptx
 
The basics of sentences session 2pptx copy.pptx
The basics of sentences session 2pptx copy.pptxThe basics of sentences session 2pptx copy.pptx
The basics of sentences session 2pptx copy.pptx
 

Different Types of Graphs Mathematics Presentation.pdf

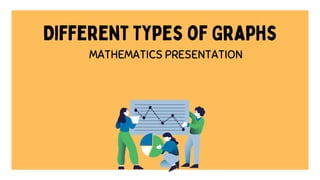
  • 1. Different Types of Graphs MATHEMATICS PRESENTATION
  • 2. Line Graph Line graphs are ideal for showing trends and patterns over time. They are commonly used in various fields such as economics, science, and finance to visualize changes in data over continuous time intervals.
  • 3. Graphs are visual representations of data that are used to communicate, analyse, and interpret information. They serve as powerful tools for summarising datasets, identifying patterns and trends, comparing different variables or groups, and making data- driven decisions. By presenting data graphically, graphs help make information more accessible, engaging, and actionable for both experts and non-experts alike.
  • 4. Side-by-side bar gRAPH Side-by-side bar graphs compare two or more categories across different groups or conditions. They make it easier to identify patterns, differences, and relationships between the groups. 0 5 10 15 20 Fish Cats Dogs
  • 5. stacked bar graph Side-by-side bar graphs compare two or more categories across different groups or conditions. They make it easier to identify patterns, differences, and relationships between the groups. 0 10 20 30 40 50 Year 5 Year 6 Year 7 Year 8
  • 6. Pie Chart Pie charts are useful for displaying the relative proportions or percentages of different categories within a dataset. They are effective in showing the composition of a whole.
  • 7. Histogram Histograms are best used to visualise the frequency distribution of continuous data. They are particularly useful for identifying patterns and distributions within datasets.
  • 8. Scatter Plot Scatter plots are ideal for visualising relationships or correlations between two variables. They are commonly used to identify patterns and trends in data points.
  • 9. Box Plot Box plots are useful for visually summarising the distribution, spread, and variability of a dataset. They are effective in identifying outliers and comparing the distribution of data across different groups or categories
  • 10. Monday Tuesday Wednesday Thursday Friday Pictograph Pictographs are useful for presenting data in a visually appealing and easily understandable way, especially for younger audiences or when dealing with simple data sets.