Tellusant - Quick Read - Defining and Quantifying Socioeconomic Levels
•
1 j'aime•22 vues

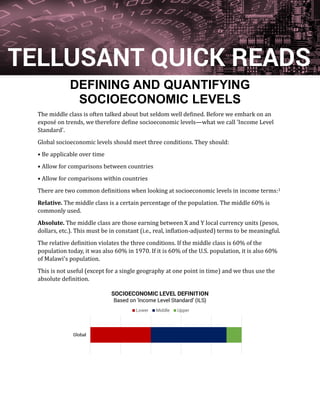
The middle class is often talked about but seldom well defined. Before we embark on an exposé on trends, we therefore define socioeconomic levels—what we call 'Income Level Standard'. The global middle class are those people within our chosen income bracket that represent 40-90% of the global population in 2015. This income bracket is always the same, over time, between countries, and within countries. The share of population this represents varies.

Recommandé
Recommandé
Contenu connexe
Similaire à Tellusant - Quick Read - Defining and Quantifying Socioeconomic Levels
Similaire à Tellusant - Quick Read - Defining and Quantifying Socioeconomic Levels (20)
Plus de Tellusant, Inc.
Plus de Tellusant, Inc. (11)
Dernier
Dernier (20)
Tellusant - Quick Read - Defining and Quantifying Socioeconomic Levels
- 1. DEFINING AND QUANTIFYING SOCIOECONOMIC LEVELS The middle class is often talked about but seldom well defined. Before we embark on an expose on trends, we therefore define socioeconomic levels—what we call 'Income Level Standard'. Global socioeconomic levels should meet three conditions. They should: • Be applicable over time • Allow for comparisons between countries • Allow for comparisons within countries There are two common definitions when looking at socioeconomic levels in income terms:1 Relative. The middle class is a certain percentage of the population. The middle 60% is commonly used. Absolute. The middle class are those earning between X and Y local currency units (pesos, dollars, etc.). This must be in constant (i.e., real, inflation-adjusted) terms to be meaningful. The relative definition violates the three conditions. If the middle class is 60% of the population today, it was also 60% in 1970. If it is 60% of the U.S. population, it is also 60% of Malawi's population. This is not useful (except for a single geography at one point in time) and we thus use the absolute definition. Global SOCIOECONOMIC LEVEL DEFINITION Based on 'Income Level Standard' (ILS) Lower Middle Upper TELLUSANT QUICK READS
- 2. Tellusant, Inc. | 240 Elm Street | Somerville, MA 02144 | USA https://tellusant.com | info@tellusant.com | +1-617-394-1800 The graph above shows a summary and a detailed definition. The global middle class are those people within our chosen income bracket that represent 40-90% of the population in 2015. This income bracket is always the same, over time, between countries, and within countries. The share of population this represents varies. The summary definition with 3 levels is easy on the eye for presentation purposes. The detailed definition with 7 levels is more useful when applied to consumer goods markets. The graph below shows the summary socioeconomic class composition for five countries. Not surprisingly, most Germans belong to the global upper class, few Mozambicans do. Colombia is close to the global average. The graph below shows how the socioeconomic classes have shifted over time (with a prediction till 2050). You may be surprised that the global lower class is in sharp decline, but it is a well-established fact. It is easy to see why when you note that incomes increase. All of this and more is included in TelluBase, our global income distribution hub covering 218 countries, 2,600 cities, and 2,400 subdivisions.2 1 Middle class can also be expressed in other terms like educational attainment, but this is impossible to quantify worldwide. 2 https://tellubase.telluplan.com 0% 20% 40% 60% 80% 100% Mozambique Bangladesh Colombia Malaysia Germany SELECT COUNTRY EXAMPLES 0 10 20 30 40 0 60 70 00 02 04 06 08 10 12 14 16 18 20 22 24 26 28 30 32 34 36 38 40 42 44 46 48 0 I I TI , o er Mi le Upper