Data Visualisation and Infographic Design: 'State of the Union'
•
15 j'aime•15,701 vues

Talk given by Andy Kirk at the 'Design of Understanding' 2014 conference.

Recommandé
Recommandé
Contenu connexe
En vedette
En vedette (20)
Similaire à Data Visualisation and Infographic Design: 'State of the Union'
Similaire à Data Visualisation and Infographic Design: 'State of the Union' (20)
Plus de Andy Kirk
Plus de Andy Kirk (20)
Dernier
Dernier (20)
Data Visualisation and Infographic Design: 'State of the Union'
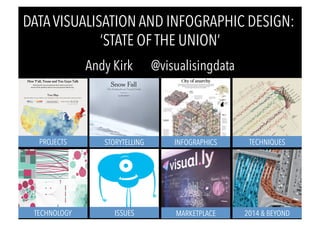
- 1. DATA VISUALISATION AND INFOGRAPHIC DESIGN: ‘STATE OF THE UNION’ Andy Kirk @visualisingdata PROJECTS STORYTELLING INFOGRAPHICS TECHNIQUES TECHNOLOGY ISSUES MARKETPLACE 2014 & BEYOND
- 2. INTRO You decide which one is me… Andy Kirk Andy Kirk Andy Kirk Andy Kirk Slightly moody 22 year old worship artist from Nashville, TN Journeyman Northern Irish footballer coming to the end of his career Renowned jazz saxophonist and bandleader Self-proclaimed data visualisation specialist
- 3. PROJECTS
- 4. PROJECTS Dialect Quiz Map | New York Times http://www.nytimes.com/interactive/2013/12/20/sunday-review/dialect-quiz-map.html?_r=0
- 5. PROJECTS US Gun Murders | Periscopic http://guns.periscopic.com/
- 6. PROJECTS Brooklyn’s Past and Present | BKLYNR http://bklynr.com/block-by-block-brooklyns-past-and-present/
- 7. PROJECTS The Age of a City | Justin Palmer http://labratrevenge.com/pdx/
- 8. PROJECTS Earth | Cameron Beccario http://earth.nullschool.net/
- 9. STORYTELLING
- 10. STORYTELLING Snow Fall | New York Times http://www.nytimes.com/projects/2012/snow-fall/#/?part=tunnel-creek
- 11. STORYTELLING Riding the Silk Road | New York Times www.nytimes.com/newsgraphics/2013/07/21/silk-road/
- 12. STORYTELLING Wealth Inequality in America | Politizane http://www.youtube.com/watch?v=QPKKQnijnsM
- 13. INFOGRAPHICS
- 14. INFOGRAPHICS What are the Odds? | Sofya Yampolsky http://visual.ly/what-are-odds
- 15. INFOGRAPHICS xkcd, Visual.ly http://xkcd.com/1273/ | http://visual.ly/
- 16. INFOGRAPHICS Infographic Portfolio | Adolfo Arranz, SCMP http://www.scmp.com/infographics/article/1193675/remembering-kowloon-walled-city | http://lasombra.blogs.com/la_sombra_del_asno/2013/05/sichuans-earthquake.html
- 17. TECHNIQUES
- 18. TECHNIQUES Accurat Studio for Corriere della Sera http://www.accurat.it/
- 19. TECHNIQUES History of NCAA Conferences | New York Times http://www.nytimes.com/newsgraphics/2013/11/30/football-conferences/
- 20. TECHNIQUES Swiss Map Series | Interactive Things for NZZ http://work.interactivethings.com/nzz-swiss-maps/
- 21. TECHNIQUES Volatility in the Eurozone Crisis | Jane Pong, SCMP http://officeofjane.com/projects/eurozone/
- 22. TECHNIQUES Small Multiples, Sankeys & Slope Graphs http://viz.ged-project.de/ | http://www.visualisingdata.com/index.php/2013/12/in-praise-of-slopegraphs/
- 23. TECHNOLOGY
- 24. TECHNOLOGY 200+ Tools | Visualisingdata.com http://www.visualisingdata.com/index.php/resources/
- 26. TECHNOLOGY RAW | Density Design Lab http://raw.densitydesign.org/
- 28. TECHNOLOGY CartoDB, Mapbox http://melbourneurbanforestvisual.com.au/bigmap.html | https://www.mapbox.com/showcase/#dataviz
- 29. ISSUES
- 30. ISSUES Constructive Criticism | HelpMeViz http://helpmeviz.com/
- 31. ISSUES Gender Balance? http://moritz.stefaner.eu/projects/gender-balance/#RATIO/NUM | http://www.visualisingdata.com/index.php/2013/03/1578-responses-to-the-first-data-visualisation-census/
- 32. ISSUES Information is Beautiful Awards | Kantar http://www.informationisbeautifulawards.com/2013-winners/
- 34. MARKETPLACE
- 35. MARKETPLACE Visual.ly “Visually said it grew 10 times since it launched its project center last year and has paid out $2 million to its network of 100,000 designers.” http://venturebeat.com/2014/01/14/visually-raises-8-1m-to-flood-the-internet-with-even-more-infographics/
- 36. MARKETPLACE Job Boards | Lynn Cherny & Flowing Data https://groups.google.com/forum/?fromgroups#!forum/data-vis-jobs | http://flowingdata.com/category/job-board/
- 38. MARKETPLACE Initiator Cognitive Science Skills? The 8 Hats of Visualisation Design Journalist Design Communicator Computer Science http://www.visualisingdata.com/index.php/2012/06/article-the-8-hats-of-data-visualisation-design/ Project Manager Data Science
- 39. 2014 & BEYOND
- 40. 2014 & BEYOND View from the cycle of hype http://public.brighttalk.com/resource/core/19507/august_21_hype_cycle_fenn_lehong_29685.pdf
- 41. 2014 & BEYOND Consumer Technology Advancements? http://www.datainnovation.org/2013/10/big-data-visualization-you-can-touch/ | http://www.visualisingdata.com/index.php/2013/11/3d-printing-capability-via-dataappeal-maps/
- 42. 2014 & BEYOND Multi-Sensory Representation http://www.washingtonpost.com/wp-srv/special/local/dc-shot-spotter/ | www.nytimes.com/newsgraphics/2013/quiet/#/map/
- 43. 2014 & BEYOND Multi-Sensory Representation http://ciid.dk/education/portfolio/idp12/courses/data-visualisation/projects/tasty-tweets/ | http://blog.emoto2012.org/ | http://www.sensorymaps.com/maps_cities/edi_smell.html
- 44. 2014 & BEYOND More ‘Design for Understanding’? http://www.washingtonpost.com/politics/for-christie-perhaps-a-bridge-too-far/2014/01/09/2928e054-797a-11e3-af7f-13bf0e9965f6_graphic.html | http://blog.visual.ly/how-data-visualization-changed-the-way-we-experience-sailing/
- 45. 2014 & BEYOND More ‘Data for Action’? “Even a lack of postings can tell the Red Cross something. If there is a social media black hole in a certain neighborhood, that probably means the area needs help.” http://www.fastcoexist.com/3020923/how-the-red-cross-used-tweets-to-save-lives-during-hurricane-sandy
- 46. DATA VISUALISATION AND INFOGRAPHIC DESIGN: ‘STATE OF THE UNION’ Andy Kirk @visualisingdata PROJECTS STORYTELLING INFOGRAPHICS TECHNIQUES TECHNOLOGY ISSUES MARKETPLACE 2014 & BEYOND